Using Bollinger Bands: Indicator Description
5 minutes for reading
In 1984, John Bollinger decided to create a system of analysis for investing, and as a result of long and scrupulous work he reached his goal at the beginning of the 90s. The indicator was named after its creator — Bollinger Bands. The name differs from language to language, but the essence remains the same; a full description of the indicator and the trading method is given in the book "Bollinger on Bollinger Bands". The indicator on the chart looks like three lines; it may be combined with other indicators in a separate window.
In the description of the indicator in the book "Bollinger on Bollinger Bands", it is said that the price remains at the borders of the lines 95% of the time and escapes those borders in 5 remaining percent. If volatility on the market is low, the upper and the lower lines are close to one the other, while the price is trading between them; the higher the volatility, the wider the channel formed by the three lines. According to the classification, the Bollinger Bands are a trend indicator as it shows both flats and directed price movements. The timeframe may be anything from M1 to a year.
The Bollinger Bands indicator is based on the Simple Moving Average (also known as ML) with a period 20; this is the central line, on the basis of which the upper and the lower lines are drawn. The upper line is the SMA (ML) plus 2 standard deviations, the lower line is the SMA (ML) minus 2 standard deviations. The settings of the Moving Average can be customized: instead of the basic calculation by the closing price, calculation by the opening candlestick price may be used, as well as its maximal and minimal values. A shift may be used. In some cases, it is set as 1, which is a shift forward by one candlestick, but other values may be introduced. Apart from calculating the Bollinger Bands on the basis of the Simple Moving Average, the indicator may also be based on the Smoothed and Exponential Moving Averages. The parameters are selected for each particular task and trading situation.
Calculation of the Bollinger Bands
The formula for the Bollinger Bands calculation on the example of an SMA:
The main (middle) line:
ML = SUM(CLOSE N)/ N = SMA (CLOSE N), where:
- SUM is the price during N timeframes
- CLOSE is the closing price of the candlestick
- N is the number of timeframes used
- SMA is the Simple Moving Average.
The upper line is calculated on the basis of the middle one:
TL = ML + (D*StdDev), where D is the number of standard deviations.
The lower line is also calculated on the basis of the middle line:
BL = ML – (D* StdDev), where D is the number of standard deviations.
StdDev is calculated as:
StdDev = SQRT (SUM ((CLOSE — SMA (CLOSE, N))^2, N)/N), where SQRT is the square root.
Presently, there is no need to calculate the indicator values manually, thanks to computer technologies. All calculations are carried out automatically as long as the parameter of the central line is set, depending on the preferences of the trader and the particular trading situation (classical setting is period 20, but in practice, it may vary from 12 to 24). Also, above it has been mentioned that there is a possibility to base the indicator on other settings of Moving Averages, such as those calculated for Open, Close, High or Low prices.
Signals of the Bollinger Bands
Example 1
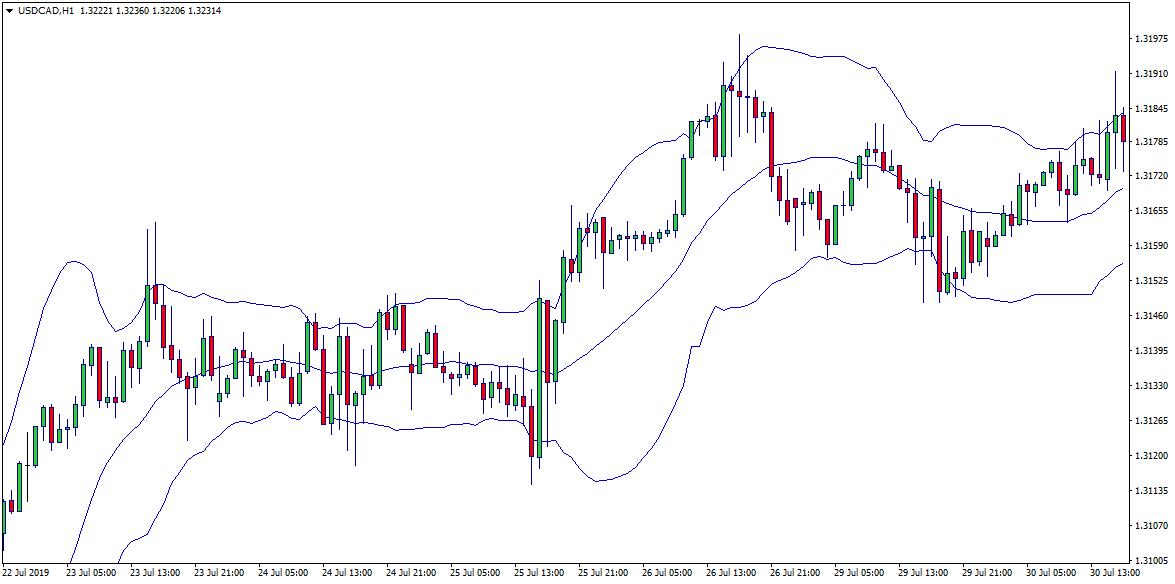
Buying — the price touches the upper line of the indicator and keeps growing, while the middle line is considered the support line.
Selling — the price touches the lower line of the indicator and keeps declining; the middle line will be considered the resistance level.
These signals may be false, so supplementary signals should be used for entering the trade, such as the volume indicator. Also, it should be kept in mind that the Bollinger Bands are a trend indicator, so in the times of a flat they may give many false signals
Example 2
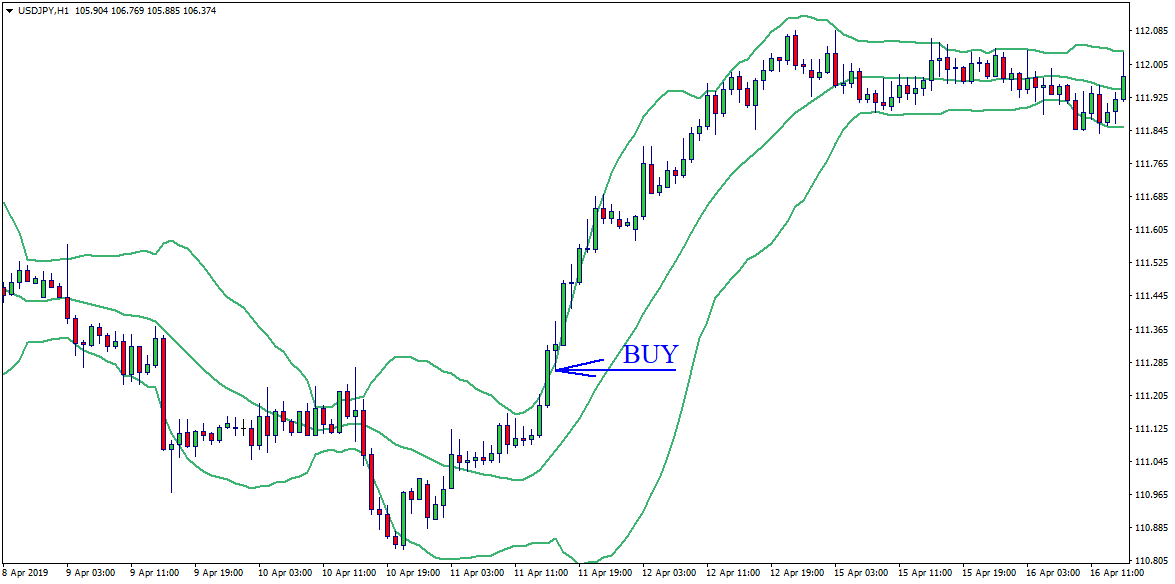
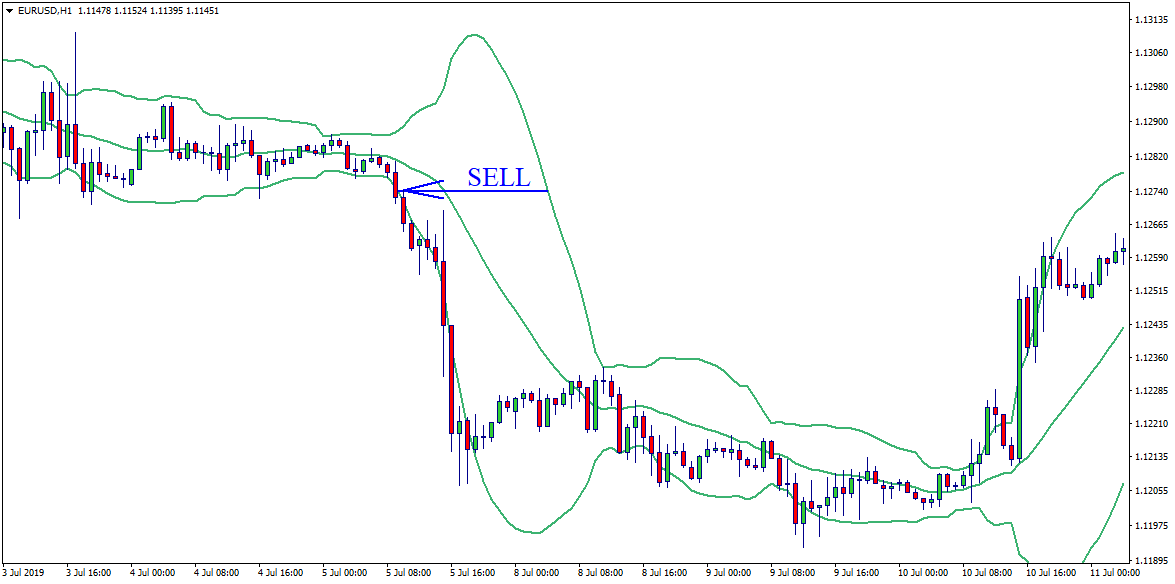
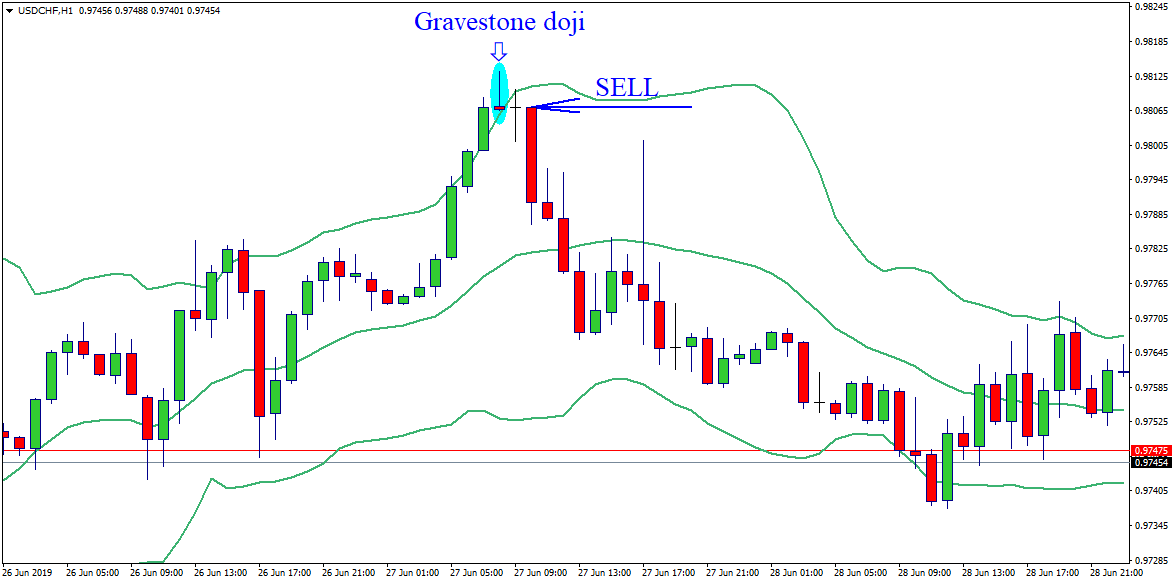
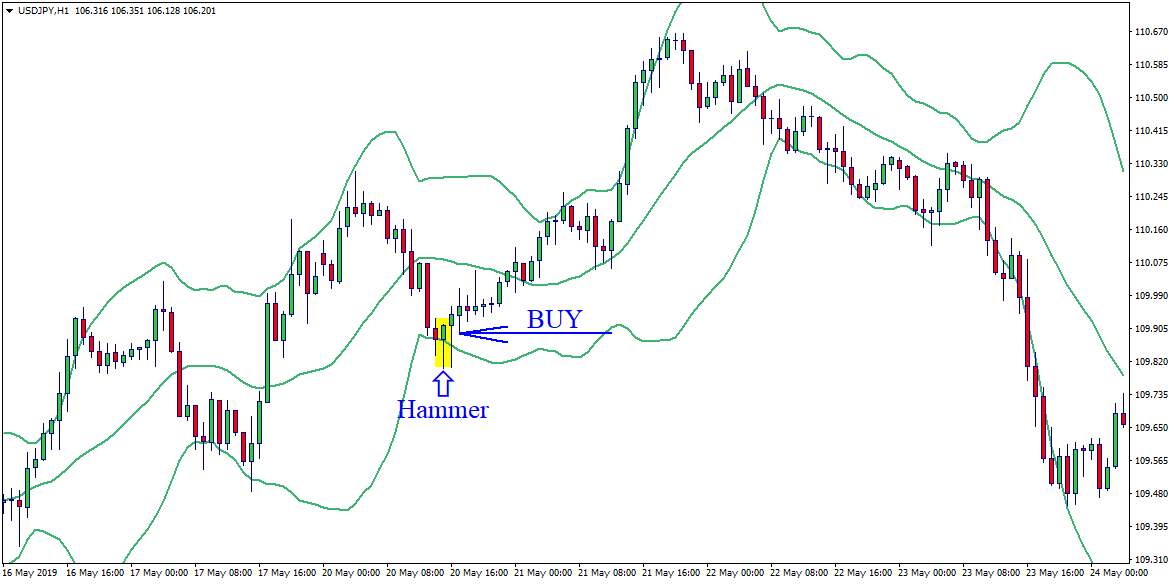
Trading at a bounce off the lines forming sort of resistance and support levels. Upon reaching the upper line, the price forms a reversal pattern, which might be a reversal candlestick from the classic candlestick analysis or signals from the Forex Price Action trading strategy; this case will be considered a signal to sell. Upon reaching the lower line of the indicator and forming a reversal pattern or a group of reversal candlesticks, either from the classical candlestick analysis or the Price Action strategy, the signal to buy appears. The price landmark in both cases will be the opposite Bollinger Bands lines.
Example 3
Combination of the Bollinger Bands indicator with other indicators. Here, there is a whole bunch of trading strategies available as almost any trader can invent their own combination of indicators and use it as a full-scale working strategy.
Summary
Practice shows, that if the Bollinger Bands are used without additional confirming signals (indicators), there emerge many false entrance signals. This factor may scare some traders off and create a negative appearance of the indicator.
However, the Bollinger Bands work rather well together with other indicators, such as Stochastic Oscillator, RSI, Parabolic SAR and other oscillators. On the basis of these combinations, some trading strategies have been designed, which are also worth paying attention to. However, the trader's fantasy in combining different indicators is virtually unlimited.
The Bollinger Bands indicator, though it was designed a long time ago, remains topical and gives good results if used the right way. It is equally applicable on Forex and on the stock market, regardless of the timeframe.


