Parabolic Sar Indicator: Description of Use

4 minutes for reading
The author of the Parabolic Sar is J. Welles Wilder. He first used it in 1976. In his book "New Concepts In Technical Trading Systems" Wilder presented several indicators: the Parabolic Sar, RSI, ADX.
In this article, we shall discuss the Parabolic Sar only.
We shall figure out:
What the Parabolic Sar is?
The Parabolic Sar is a trend indicator. It is meant to point at the exit points from the position. Sar is a contraction of Stop and Reverse. Also, we call it Parabolic, because what it draws on the chart reminds of a parabola.
At the same time, what it draws is similar to printed dots. Parabolic Sar highlights the prevailing trend. If the points are above the price chart, the trend is descending. If the points are below the price chart, the trend is ascending.
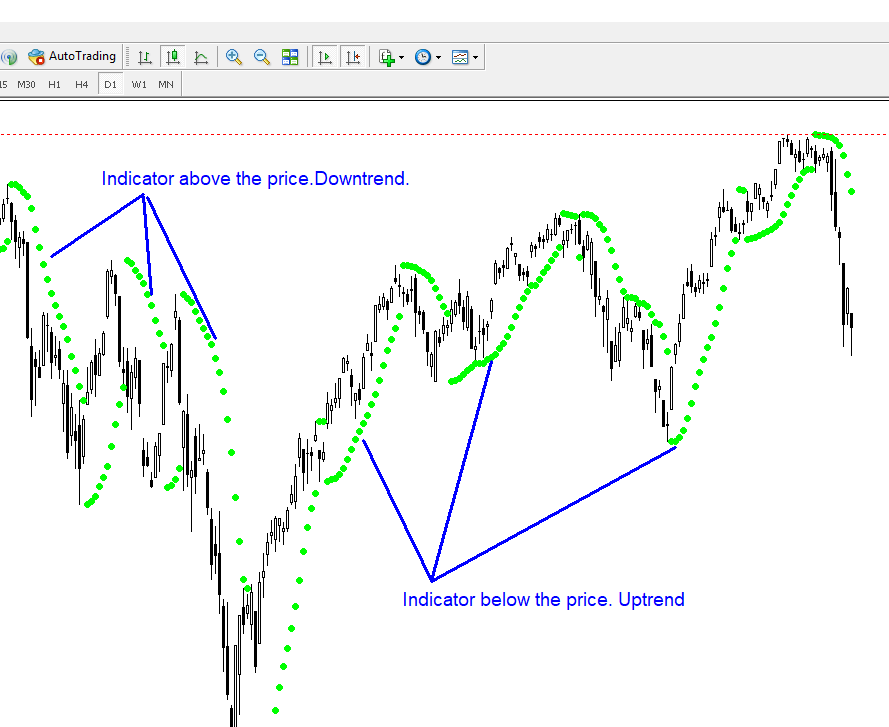
The strength of the trend may be defined as well. If the points follow closely one another, the trend is weak. If the points are far from each other, the trend is strong.
In case of an uptrend, a Stop Loss may be placed under a point and moved with each next one. It is sort of a trailing stop. Same may be done in case of a downtrend.
How to set up the Parabolic Sar indicator?
The indicator is set up on the chart the following way:
Open the MT4 terminal. Pick up the desired currency pair. Click the unfolding menu INSERT. A menu of 11 lines will appear. Click INDICATORS, then choose TREND. Find the Parabolic Sar in the window. Click on it.

A window with the indicator settings will appear on the chart.

The indicator settings are comprised of 4 windows.
The first one is STEP, regulating the sensitivity of the indicator. The smaller the value, the less sensitive the indicator is to price fluctuations. The larger it is, the more intensely the indicator reacts on price movements. The default setting is recommended.
The second parameter is MAXIMUM, setting up the distance between the price chart and the indicator points. The default setting is recommended.
The third window is STYLE, setting up the color of the indicator on the chart. Pick up whichever you wish.
Click OK. Done. Your settings appear on the chart.


How to trade with Parabolic Sar?
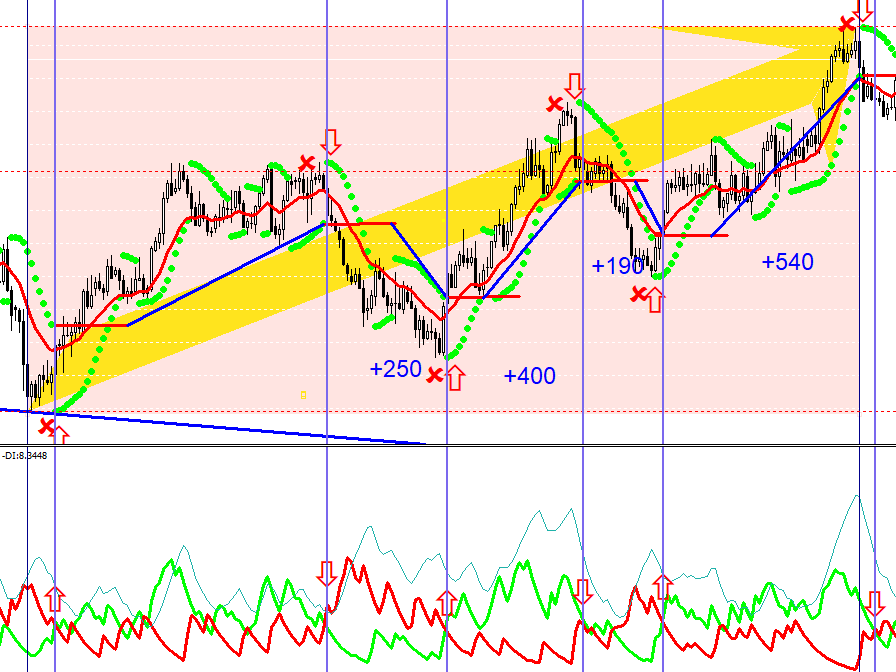
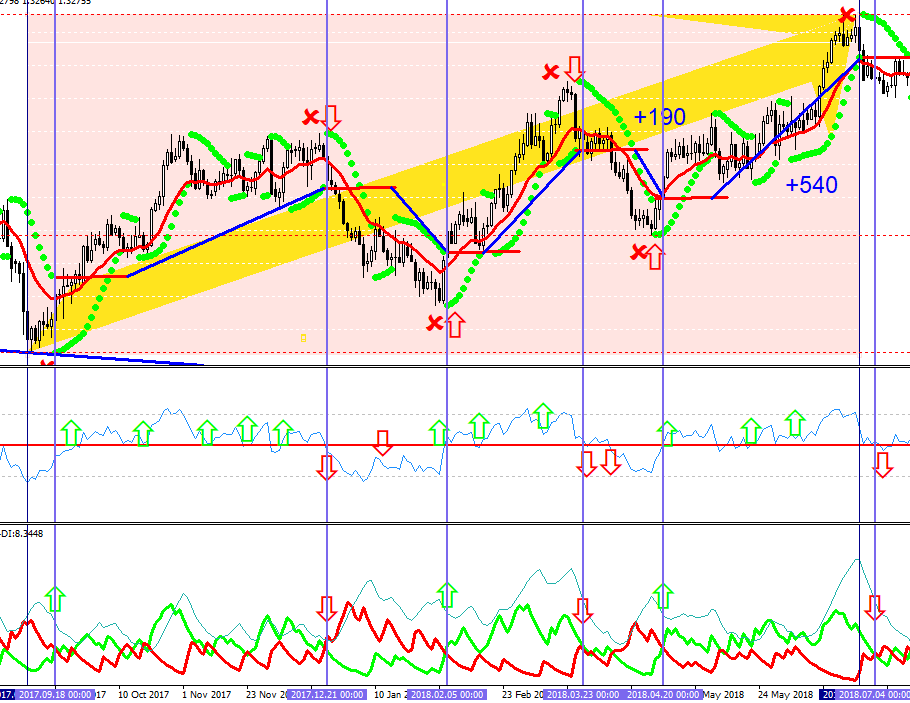
Let us look at the work of the indicator at the example of the CAD/USD pair.
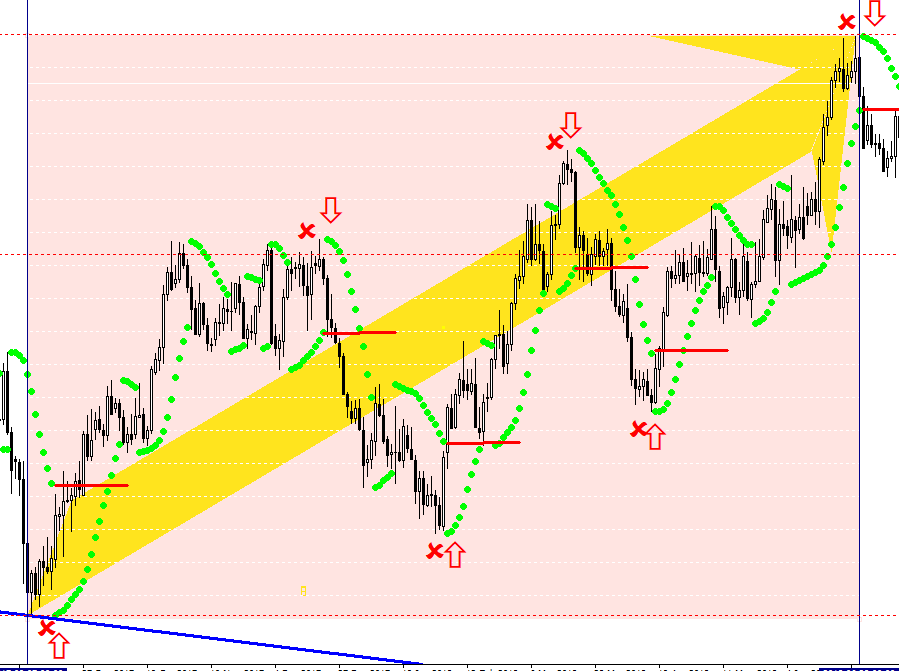
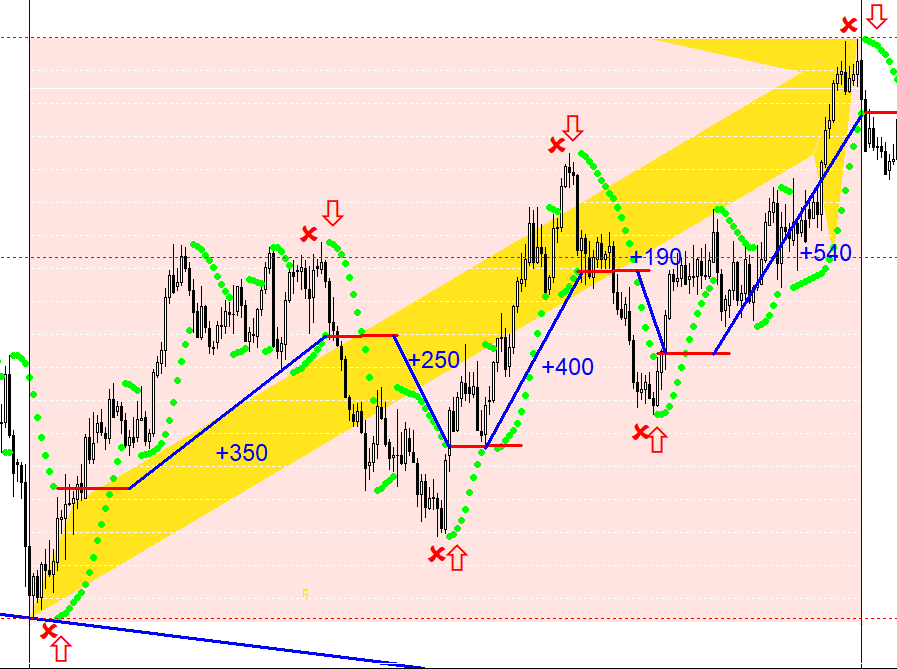
The chart is D1, the period is 10 month. All five trading actions during this period are quite obvious. In pic. 4, selling and buying operations are shown as red arrows. Stop Losses trigger as soon as the chart touches the indicator points. The possible profit is easy to count.
+350+250+400+190+540=1730 basic points.
And this is just one currency pair.
Any trader should add such an indicator to their portfolio.
The peculiarities of the Parabolic Sar
This indicator teaches the trader to be firm and patient as well as to comply accurately with the rules of work. The indicator, no matter how appealing it may seem, has its peculiarities.
It is not recommended to rely on one indicator solely. The quality of your work will increase significantly if you use additional filters to cut off false signals. A simple Moving Average (MA) indicator is a good example of such filter.
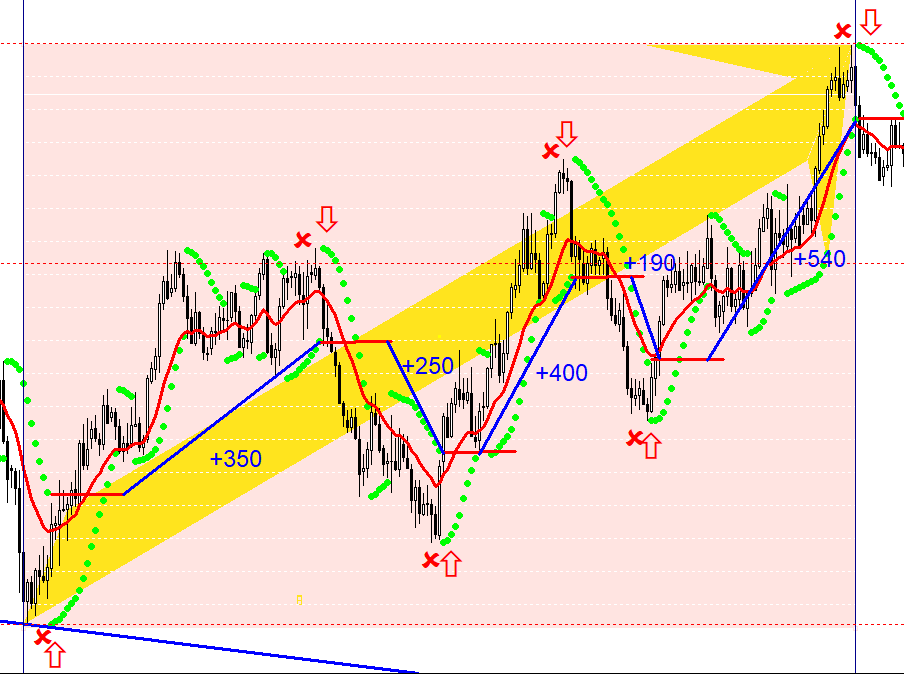
Another filter can be the ADX indicator. Even the author of Parabolic Sar uses ADX everywhere.
If for some reason, you have failed to open the position in time, you better not enter the market hastily. Try using additional signals of an RSI oscillator.
The Parabolic Sar is recommended for placing a Stop Loss. Fractal marks may also be used. In the case of selling, an SL should be put right above the tip of the fractal; in case of buying, it goes under the tip.

In times of corrections, the market often forms consolidation ranges. In such ranges the Parabolic Sar is of little help; trading in ranges is better avoided.
Try to create your own trading system, using the Parabolic Sar indicator. If your system includes another timeframe, such as H4, the reliability of the signals will increase many times. Your own trading system will yield only pleasure during work. Even if you get two losing trades in a row for some reason, do not quit your system, including Parabolic Sar, at once. Any loss is yet another reason to sort out the situation and make necessary corrections.
Wish you profitable trading!


