How to Set Up a Non-Farm Payrolls Trading Strategy?

5 minutes for reading
What are the Non-Farm Payrolls and what to trade them for?
Non-Farm Payrolls (NFP) are essential data on employment in the USA, which shows changes in the number of employees out of the agricultural sector of the country during the last month. The indicator is based on a poll answered by some 400,000 companies and 50,000 households. Empirically, it has been figured out that if the NFP increases stably by +200,000 every month, the GDP surplus equals roughly 3%.
The NFP data is published on the first Friday of every month simultaneously with one more important indicator, which is the Unemployment Rate. The latter shows the percentage of the unemployed who are in an active search of a job, in the overall number of the labor force in the USA.
So, why are the NFP interesting for a trader?
The answer is simple: as long as this is some very important data on the US economy, the reaction of the market on it might be significant, large-scale price movements might emerge, which can be used for trading.
Non-Farm Payrolls are a rather volatile indicator, and, depending on how much the real data differs from the forecast, it can move the market this or that way by a hundred points. If the index is much better than expected, the dollar is likely to grow robustly; if the NFP turns out much worse than expected, the USD is likely to fall.
The increased volatility of the NFP provides good opportunities for trading. If the trader manages to prepare a good trading strategy and enter the trade well, they can rather quickly (in one or two hours) make a serious profit.
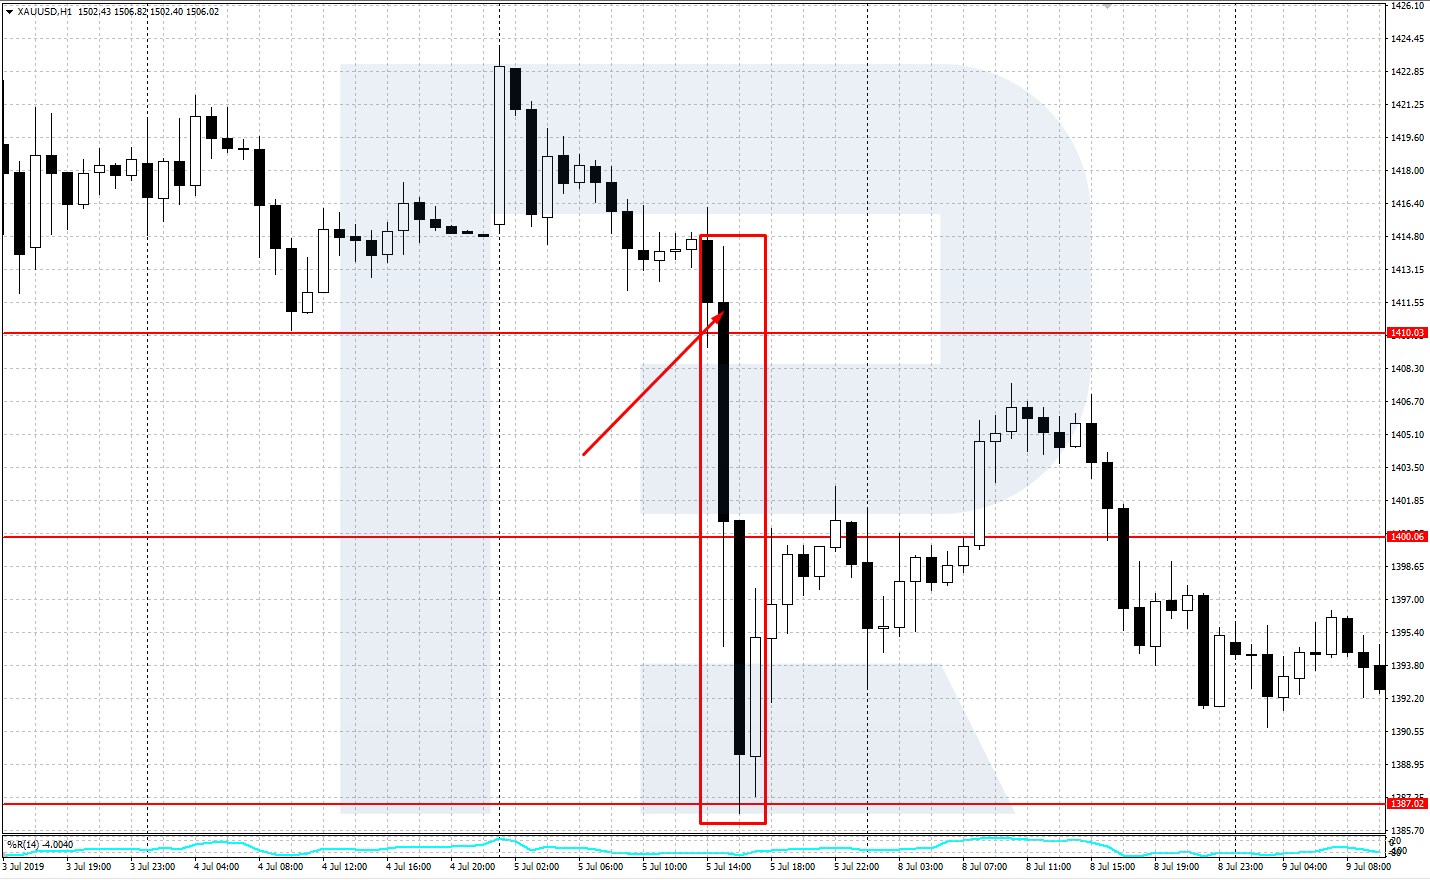
For example: on June 5th, 2019, the NFP data turned out to be much better than forecast — instead of the expected +160,000, the surplus amounted to +224,000. The dollar reacted by significant growth, gold (XAU/USD) declined by more than 200 points ($20) in two hours.


Three steps of trading the NFP
Choosing the time for a trade
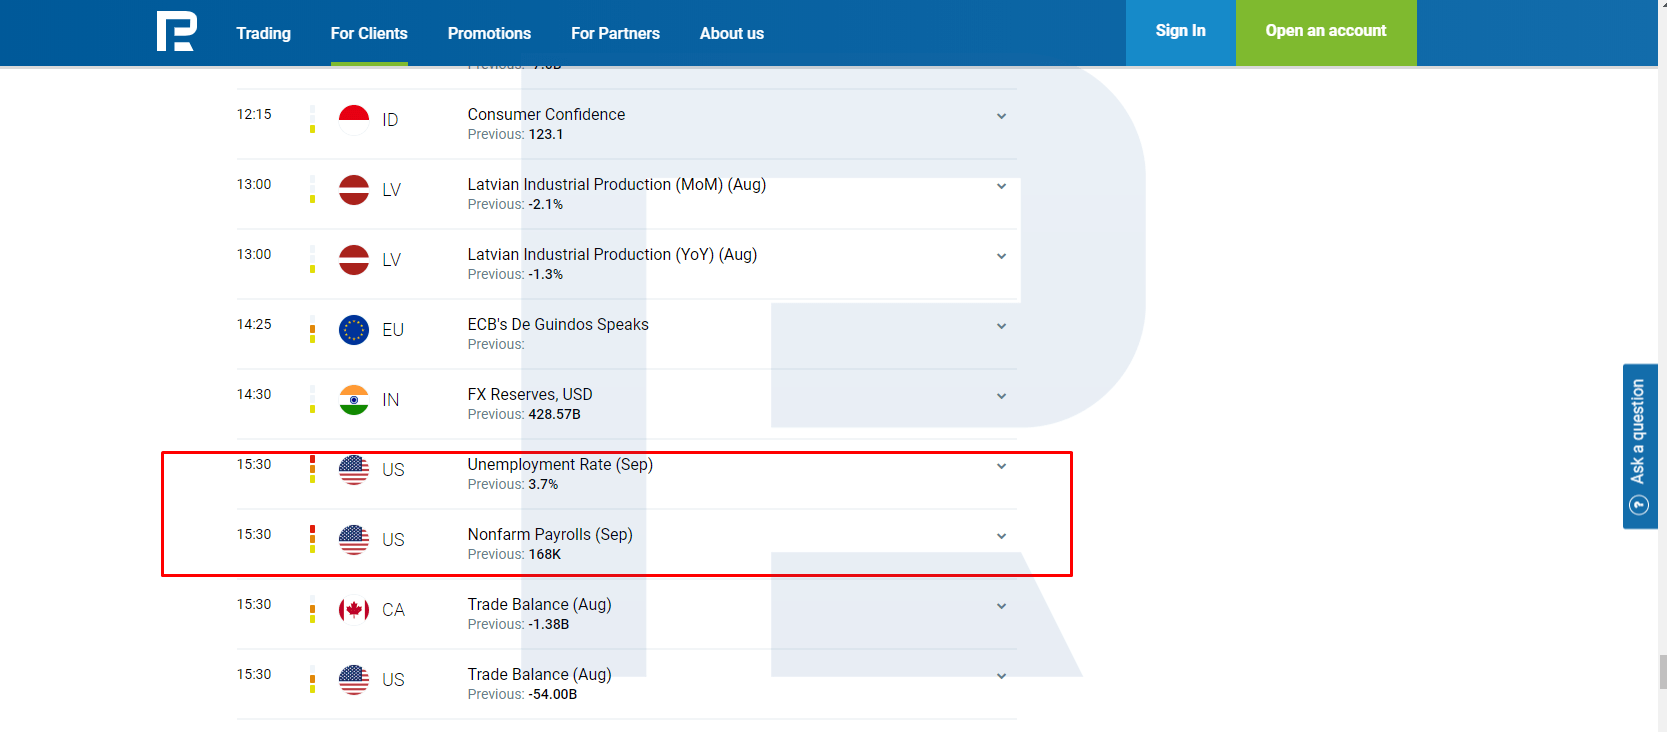
For this, we will need the economic calendar, in which we will find the date and time of the NFP publication. Let us take the NFP and the Unemployment Rate index in the US for Friday, October 4th, 2019. We look at the calendar and see that the publication of the news is planned for 3:30 p.m. Moscow time. By this moment, we need to carry out tech analysis and draft a trading plan.
Preparing a trading plan
To prepare a trading plan, you should analyze the price chart and decide the place and time of the trade. Here, tech analysis will be of great help as it will point at the closest strong support/resistance levels, price patterns, or graphic patterns that we can be guided by.
The tech analysis will allow us to find a perfect entrance to the market and show us the perspectives of future price movements. A complete trading plan gives us clear criteria for entering the market if we comply with all necessary conditions.
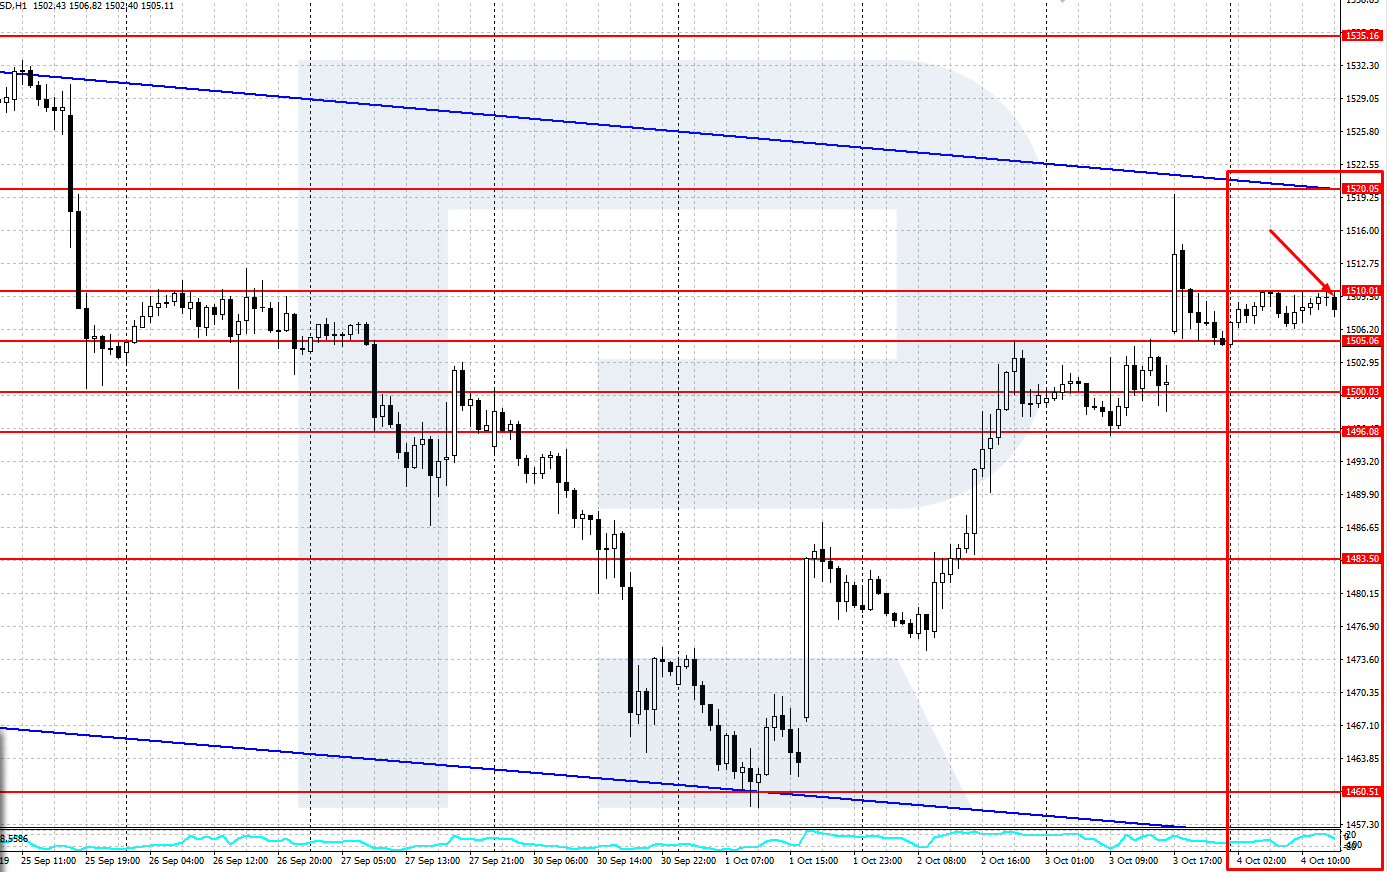
I prepared a trading plan for gold, XAU/USD. The long-term trend is an uptrend, in the short term, there is a descending correction; I found no formed price charts on H1 but drew the important support and resistance levels.
An hour before the publication of the NFP gold was trading near the upper border of a small price channel between the support level at $1505.00 and the resistance level at $1510.00. I decided that after the publication I would trade a confident breakaway or a false breakaway of the borders of this channel.


Trading the plan
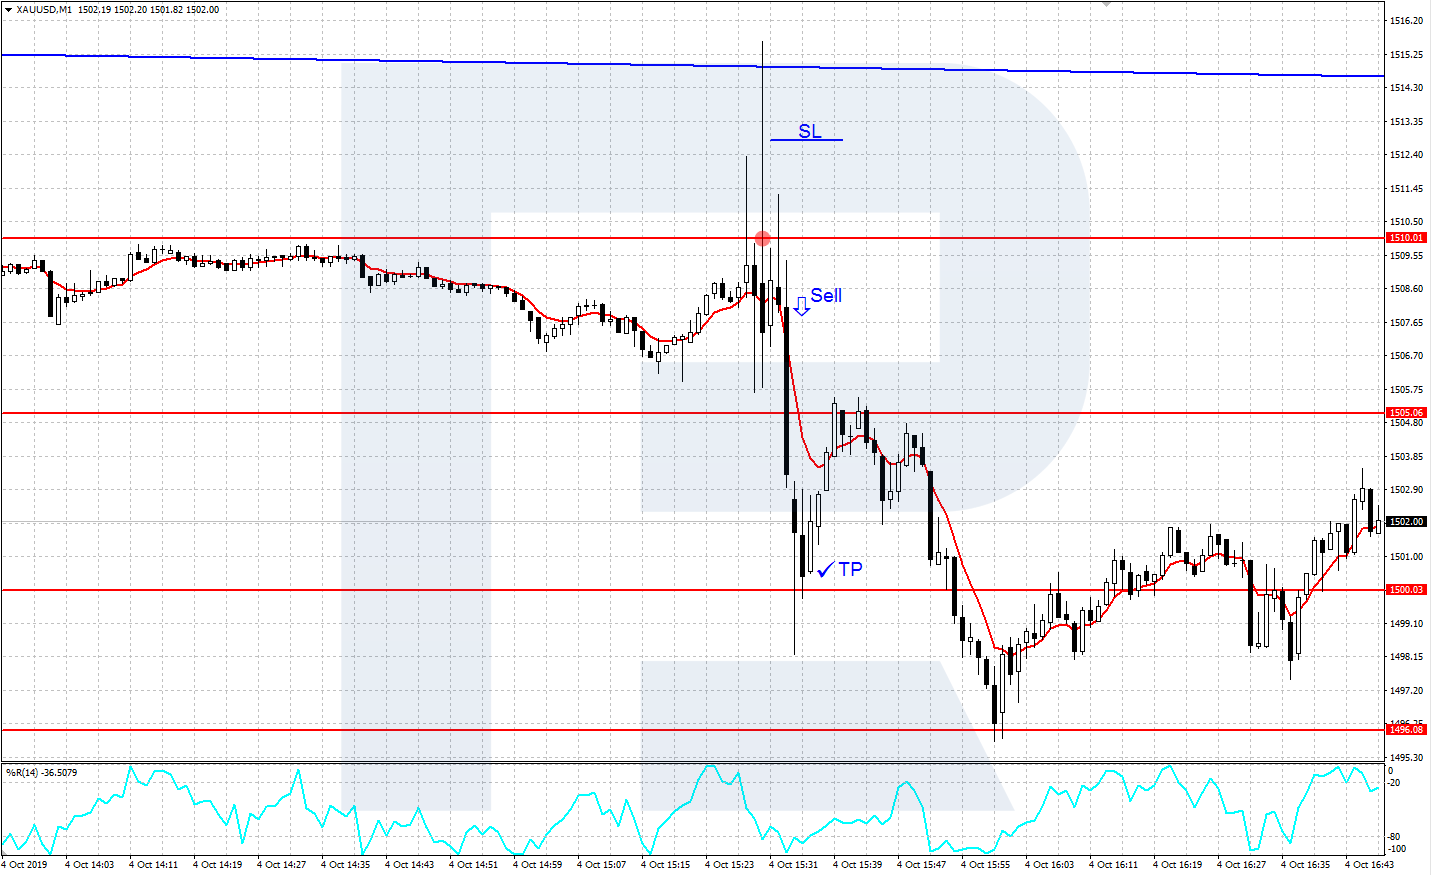
Right before the publication of the data, we go to the minimal timeframe M1 and watch closely the price movements at the levels specified in the plan. In our example, right after the publication of the news at 3:30 p.m., gold jumped above the resistance line at $1510.00, setting the new local minimum at $1515.60. However, it failed to stay there: the bears grasped at the wheel and closed the minute below $1510.00, demonstrating a false breakaway.
I opened my selling position based on the false breakaway of $1510.00 at the price of $1508.00; the Stop Loss was 50 points on $1513.00. Ideally, the SL should have been put behind the local maximum at $1515.60, but the SL to Take Profit ratio should also be taken into account: it must be no less than 1:1, better 1:2.
As the first goal for locking in profit, I chose the neat support level $1500.00; if it were broken away, I would hold the position till the price reached the next support levels. In the end, the XAU/USD quotations went downwards, and my position was closed at $1501.00 with a profit of +70 points.
It is worth noting that the position was opened based on technical indicators only, the news was not taken into account. The published data may be analyzed later when the trade is already open to evaluate the perspectives of further development and make a final decision about whether to lock in profit as quickly as possible or keep holding the position.
In our example, the NFP numbers turned out to be worse than forecast: +136,00 against +162,000. At the same time, the previous data was revised and increased, and the Unemployment Rate was decreased to 3.5% against the forecast of 3.7%. As a result, the dollar stopped falling rather soon and was swift to resume its growth, however, the controversy of the data restrained the movement.
Summary
Trading the news is risky as it may bring profit as well as losses equally fast, so the trader should make as balanced a decision as possible before venturing at it. In the case of the Non-Farm Payrolls, I recommend short-term intraday trading because if we leave the data for the weekend (Saturday and Sunday), the situation may change dramatically.


