Trading the News: How to Make Money on GDP?

5 minutes for reading
What is GDP and why is it useful for trading?
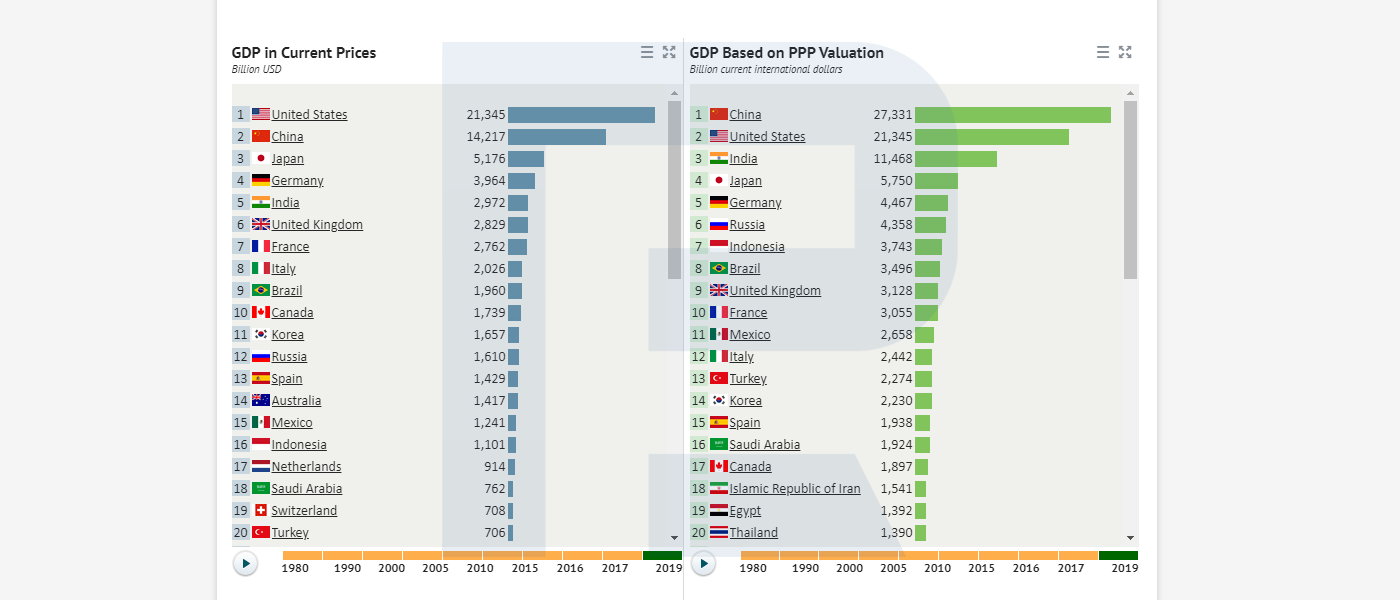
Gross domestic product, or GDP, is a macroeconomic indicator that demonstrates the gross price of all goods and services produced by all producers in the country during a set period. The size of the GDP increment reflects the level of economic development and helps evaluate its rate.
A GDP report is a vast analysis of all sectors of the economy. Analysts and other market participants study carefully those sections that are of interest to them and come to their conclusions about this or that branch of industry or the service sector, evaluating their perspectives.
Stable GDP growth indicated sustained economic development, hence, augments the stability and strengthening of the national currency. A slow-down of the GDP growth reveals some problems in the country’s economy and leads to a decline in the national currency rate.
Market players keep a close eye on the publication of the GDP data because a difference between the forecast and the factual index may entail serious fluctuations of the national currency. A strong market movement may provide a good trading opportunity if you get prepared in advance.
How do you use the GDP data in trading?
In the classical variant, the GDP data significantly higher than forecast promises growth of the national currency, so buys are in priority. Conversely, the GDP data weaker than expected entails a decline in the national currency rate, so sells are recommended. Also, you should evaluate the technical picture and prepare a trading plan.
Three steps of trading GDP
Choosing the time for trading
Open the economic calendar and find the date of the publication of the GDP data. Normally, such reports are published once in a quarter, which is not frequent.
For example, let us take the British GDP data for the 2nd quarter of 2019 (published August 9th, 2019). In the calendar, we find that the news is published at 11:30 a.m. Moscow time, by which time you need to evaluate the technical picture, the forecasts, and draft a plan.

Preparing the plan
Evaluate the forecasts of the British GDP in the 2nd quarter of 2019. It is expected to remain at a level of 0.0%. If, in reality, the index turns out to be better, the pound will have a reason for growth. And vice versa: if the GDP turns out to be worse than forecast, the pound is likely to start declining.
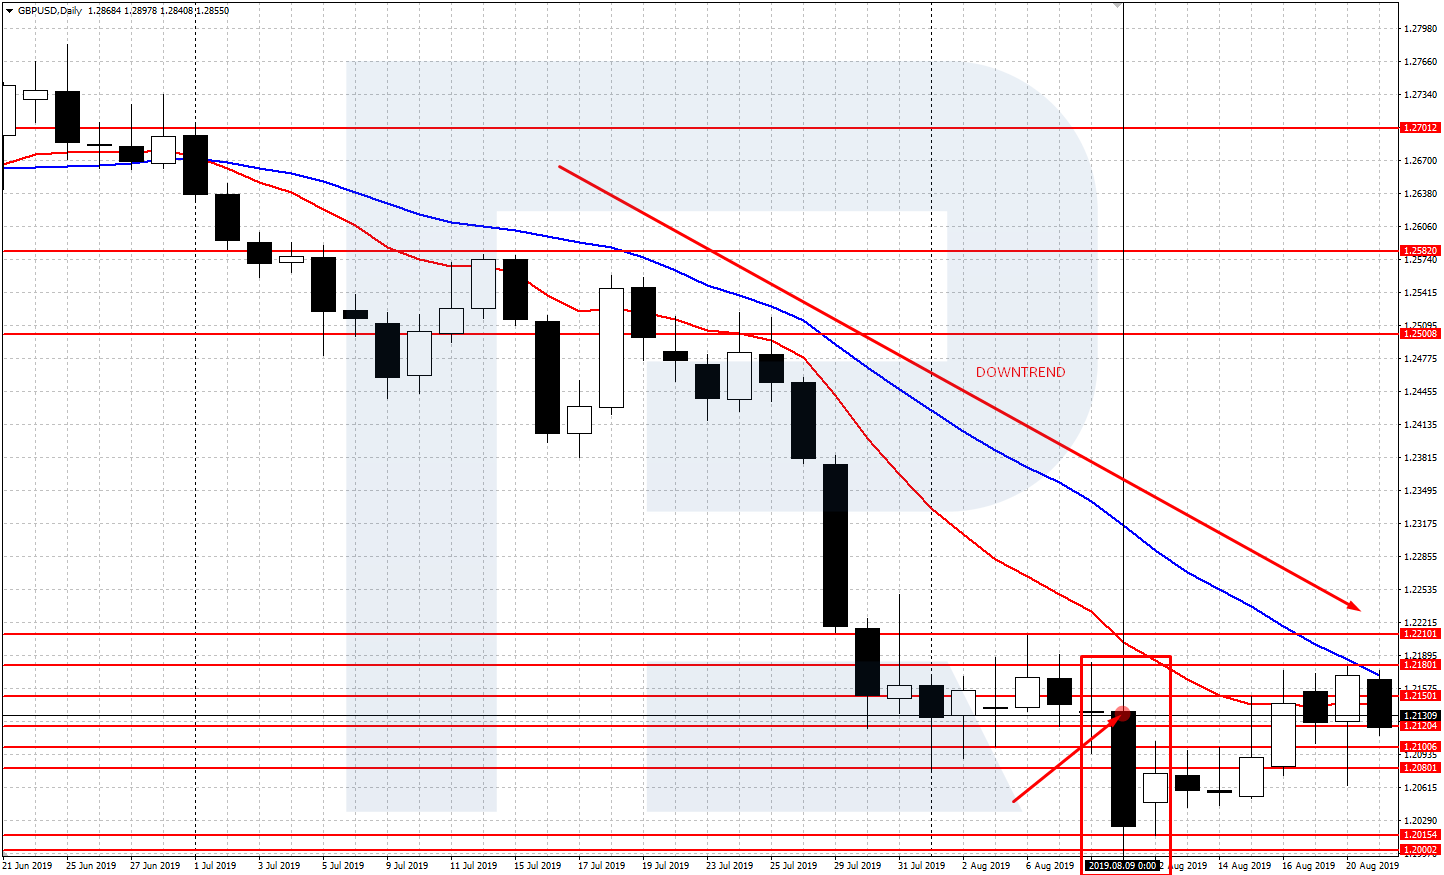
Then open the GDP/USD chart, mark the important levels and the support/resistance lines, price patterns. The intraday trend of the pound is declining, so selling positions are in priority, going along with the trend. There are no obvious price patterns on the chart, that is why we mostly look at the support/resistance levels.
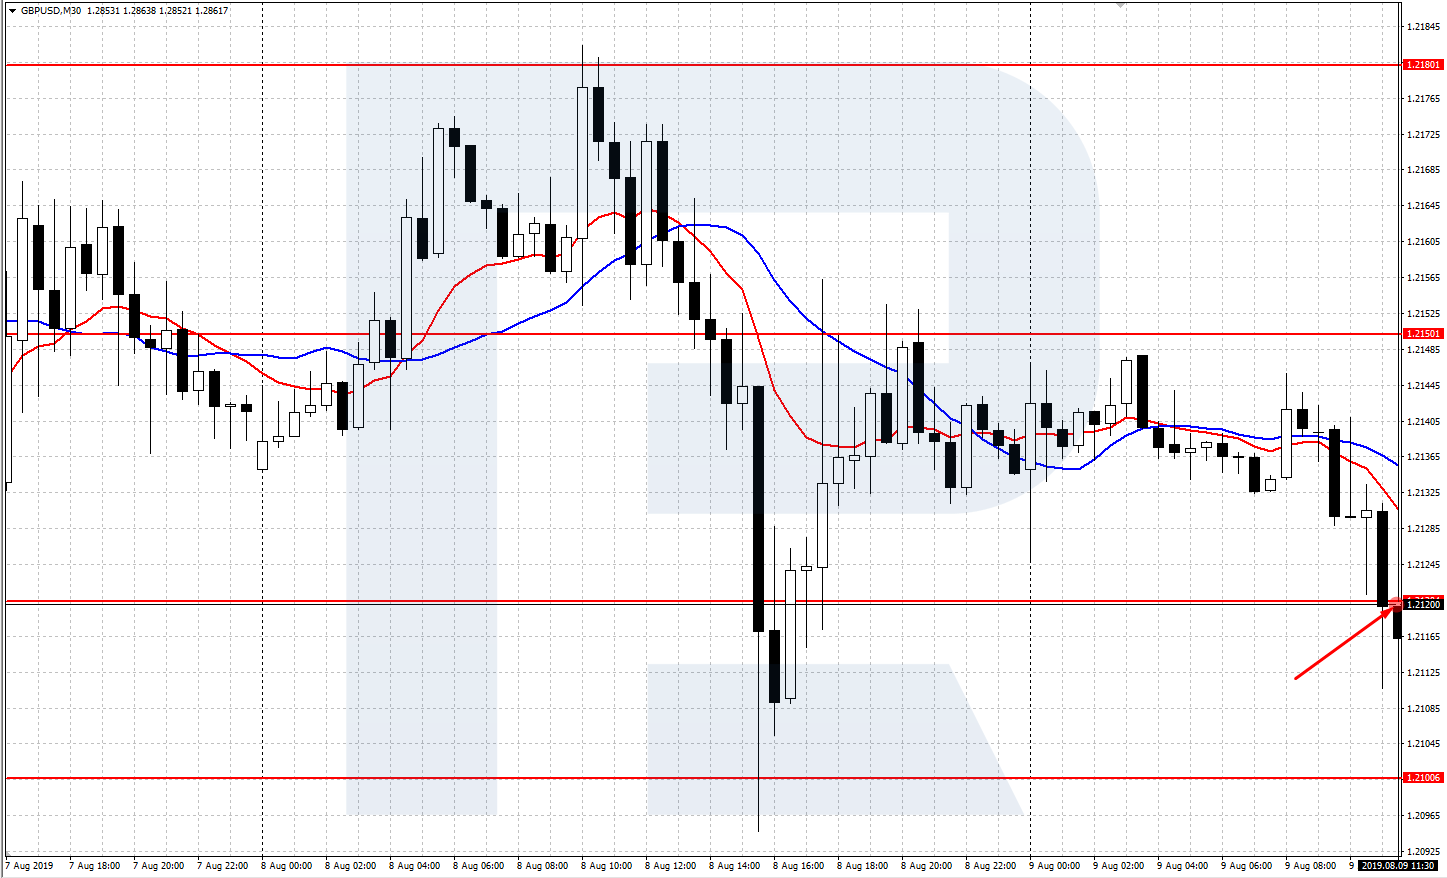
Before the publication of the news on the British GDP, the pound on H1 was trading inside a small flat limited by the supprt level 1.2120 and the resistance level 1.2150. The trading plan supposes trading tge borders of this plan with sells in priority. To trade a breakaway of the lower border, you can wait for a pullback to it after the breakthrough or use a pending sell order Sell Stop.
Trading the plan
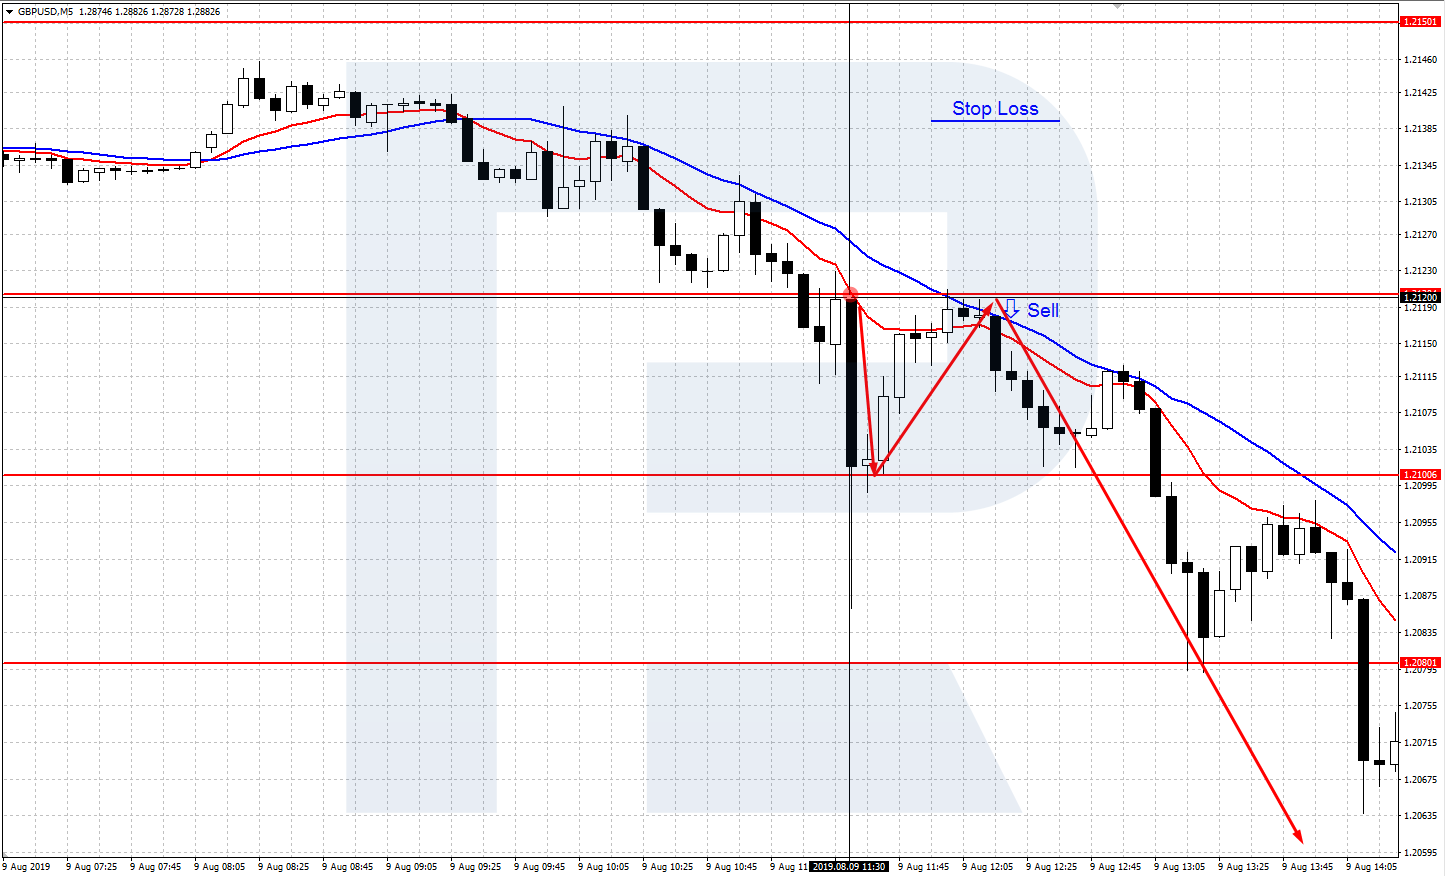
Before the publication of the news, switch to the smaller timeframes, M1 or M5, and watch the price movements closely, paying special attention to its behavior at the support/resistance levels. In our case, right after the publication of the news at 11:30 a.m. Moscow time the GBP/USD went down steeply, broke through the support level of 1.2120, and reached the next support level at 1.2100.
Then, it performed a temporary bounce off the support level at 1.2100 and corrected upwards, to the previously broken support line at 1.2120. At this correction, you could open a selling position if you had not entered on a pending Sell Stop. The Stop Loss could be put 20 points above the broken level of 1.2120 and decide upon the Take Profit on-the-go.
To evaluate further perspectives of the pound analyze the published data. In the 2nd quarter of 2019, the British GDB was worse than forecast, declining by -0.2%. The GDP in the negative zone was a bad signal for the national currency and the country's economy. A further decline below the support level of 1.2100 looked possible.
And so it happened. The pound went on falling due to three important fundamental factors: the downtrend, the GDP worse than forecast, and the GDP in the negative zone (-0.2%). As a result, the GBP/USD broke through a strong support level of 1.2100 and fell to the area of 1.2000; the profit could be locked in.

Summary
Publication of such an important macroeconomic indicator as the GDP data can influence the national currency rate significantly. The factual data seriously above or below the forecast entails strong market movements and provides additional trading opportunities.
It is for everyone to decide whether to use the GDP data for trading or not. It is important to remember, however, that trading news is risky and can bring equally a profit and a loss.


