Joe Ross Trading Strategy: Using Hooks
6 minutes for reading
In this article, we will discuss the trading strategy of a famous trader Joe Ross. Long-term experience of successful trading, personal strategies, and some books published made Ross popular, and he deserves it. The Ross Hooks are a simple but efficient instrument of tech analysis that allows entering the market at low risk in the direction of the new trend.
Trading patterns 1-2-3
Ross trading patterns 1-2-3 are a reversal formation that signals the end of the previous and the beginning of a new trend. These patterns work on various timeframes and instruments which means they are universal. Joe Ross uses the patterns for defining the current trend and trades his Hooks in their direction.
The bullish pattern 1-2-3
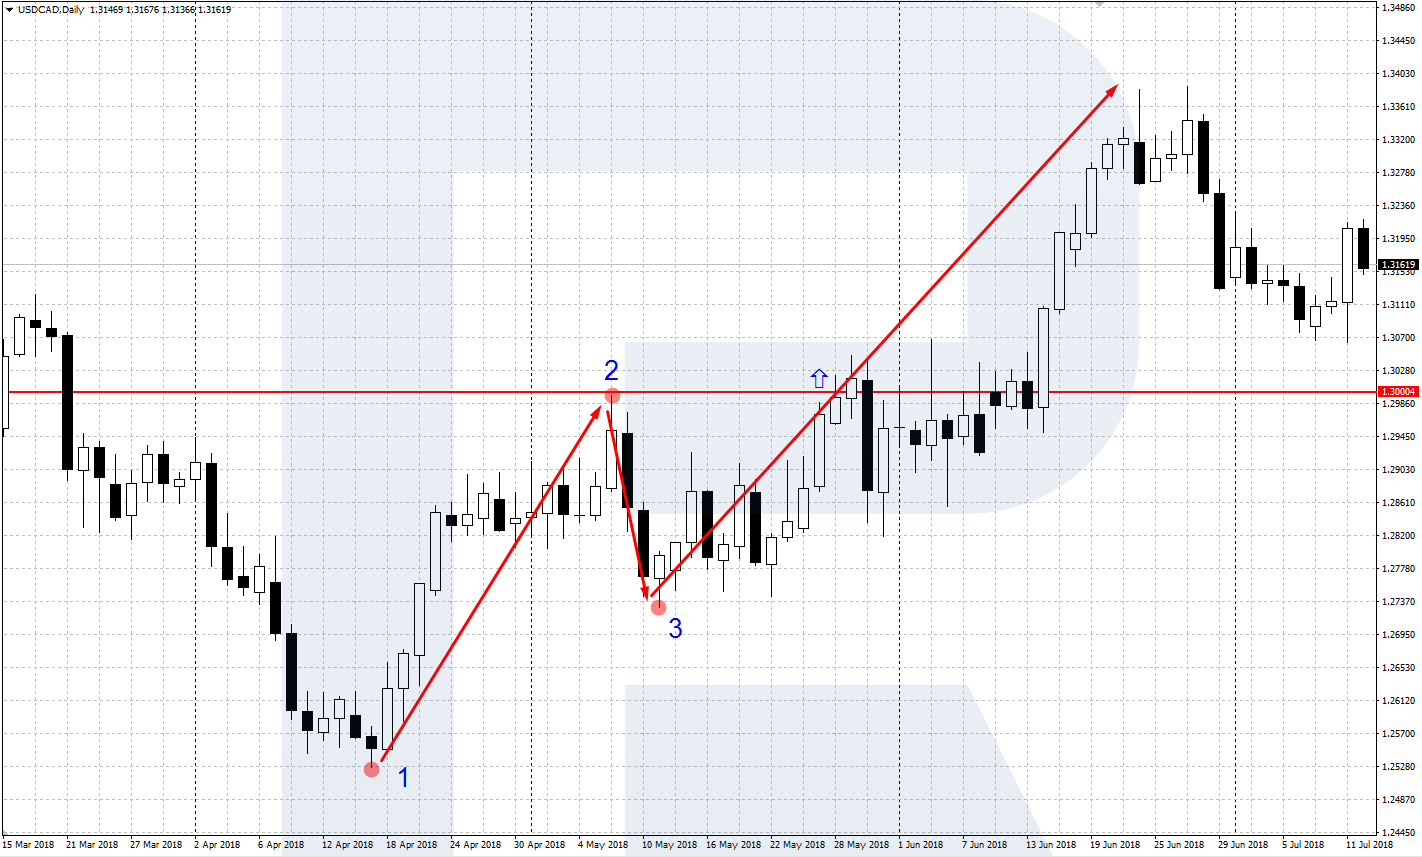
The bullish pattern 1-2-3 forms on the lows of the chart and signals the beginning of an uptrend. Point 1 is the low on the chart formed after the completion of the previous price movement, point 2 is the high in which the upward impulse from point 1 ends. After the completion of the growth in point 2, there follows a correction that ends in point 3.
The bullish pattern is considered irrelevant if point 3 is at the level of or below point 1. If point 3 is above point 1 and there follows growth, the pattern is considered complete. After the price is above point 2, the uptrend is thought to have started. Theoretically, you may buy, but Joe Ross recommends to wait for a Hook to form.
The bearish pattern 1-2-3
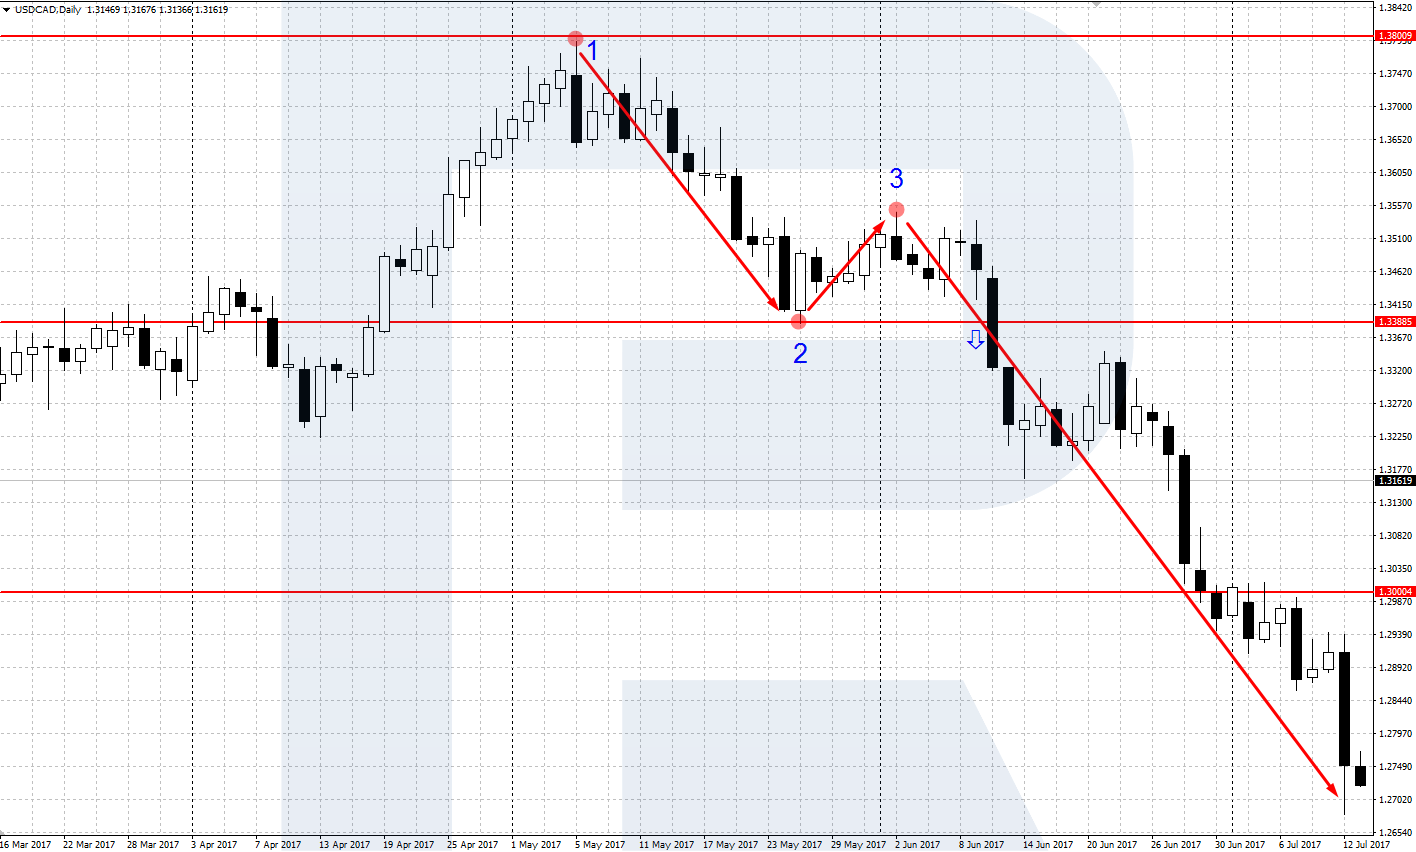
The bearish pattern 1-2-3 forms on the highs of the chart and signals the beginning of a downtrend. Point 1 is the high on the chart formed after the completion of the previous price movement, point 2 is the low in which the downward impulse from point 1 ends. After the completion of the decline in point 2, there follows a correction that ends in point 3.
The bullish pattern is considered irrelevant if point 3 is at the level of or above point 1. If point 3 is below point 1 and there follows a decline, the pattern is considered complete. After the price has renewed a low of point 2, the downtrend is thought to have started. Theoretically, you may sell, but Joe Ross recommends to wait for a Hook to form.


Ross Hooks
A Ross Hook (RH) forms after a complete pattern 1-2-3 with a new low\high on the market, followed by a small pullback. The result of the pullback is Hook – a hook-shaped pattern.
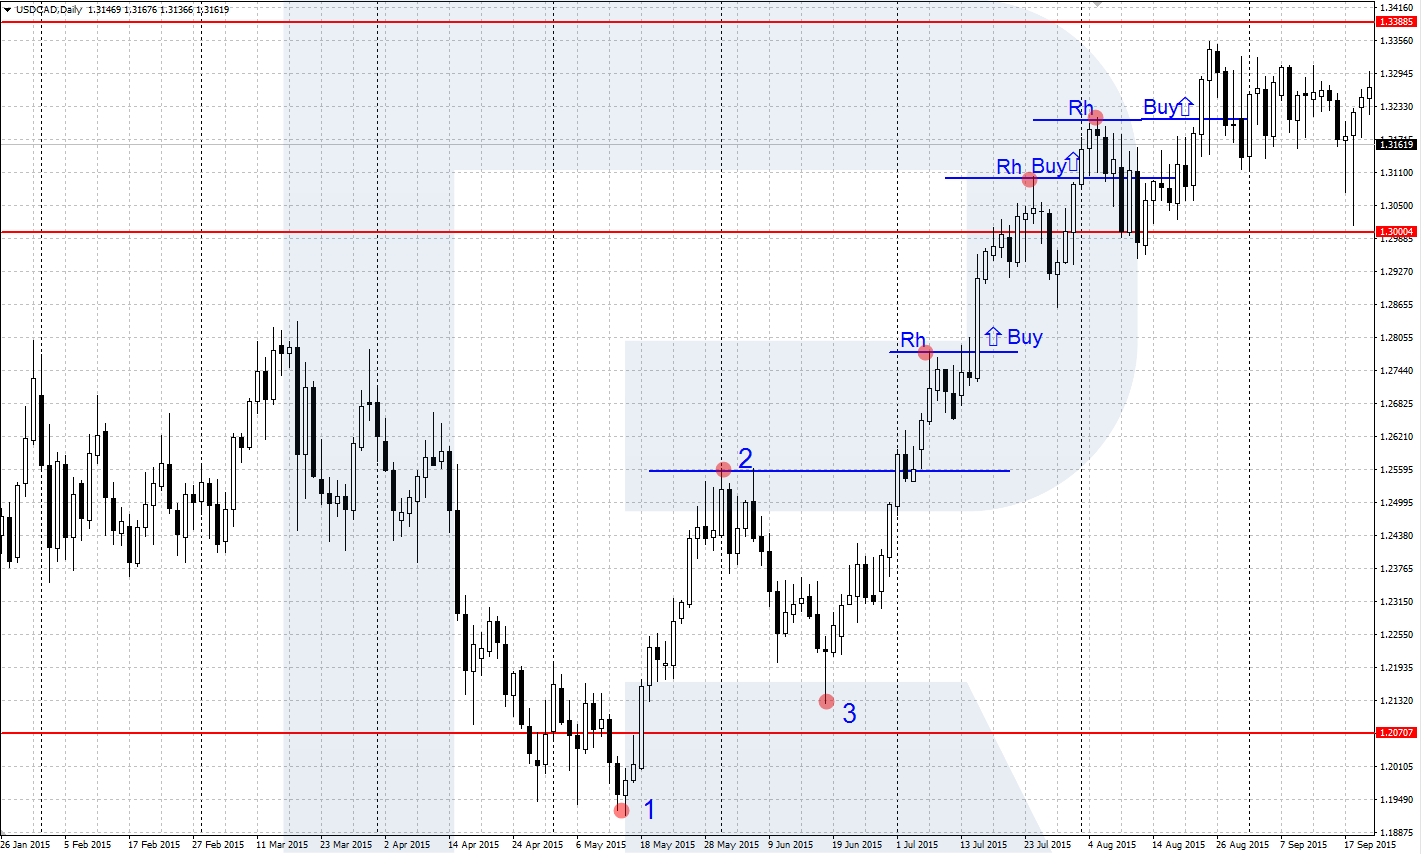
Hooks to buy
A Hook to buy is formed in an uptrend after a complete bullish 1-2-3 pattern. The price makes a new peak, which is the high of the RH, after which a small downward correction, no lower than point 3, follows. The movement from point 3 to the RH high is called the handle of the Hook, and the correction completes the pattern.
A pending or market order to buy is executed when the price becomes higher than the RH high. The SL is below the nearest low of the Hook, the minimal profit is the size of the handle. In an uptrend, there might form several Hooks one after another. Each one can be traded separately, or the position may be held and buys filled in until the trend reverses.
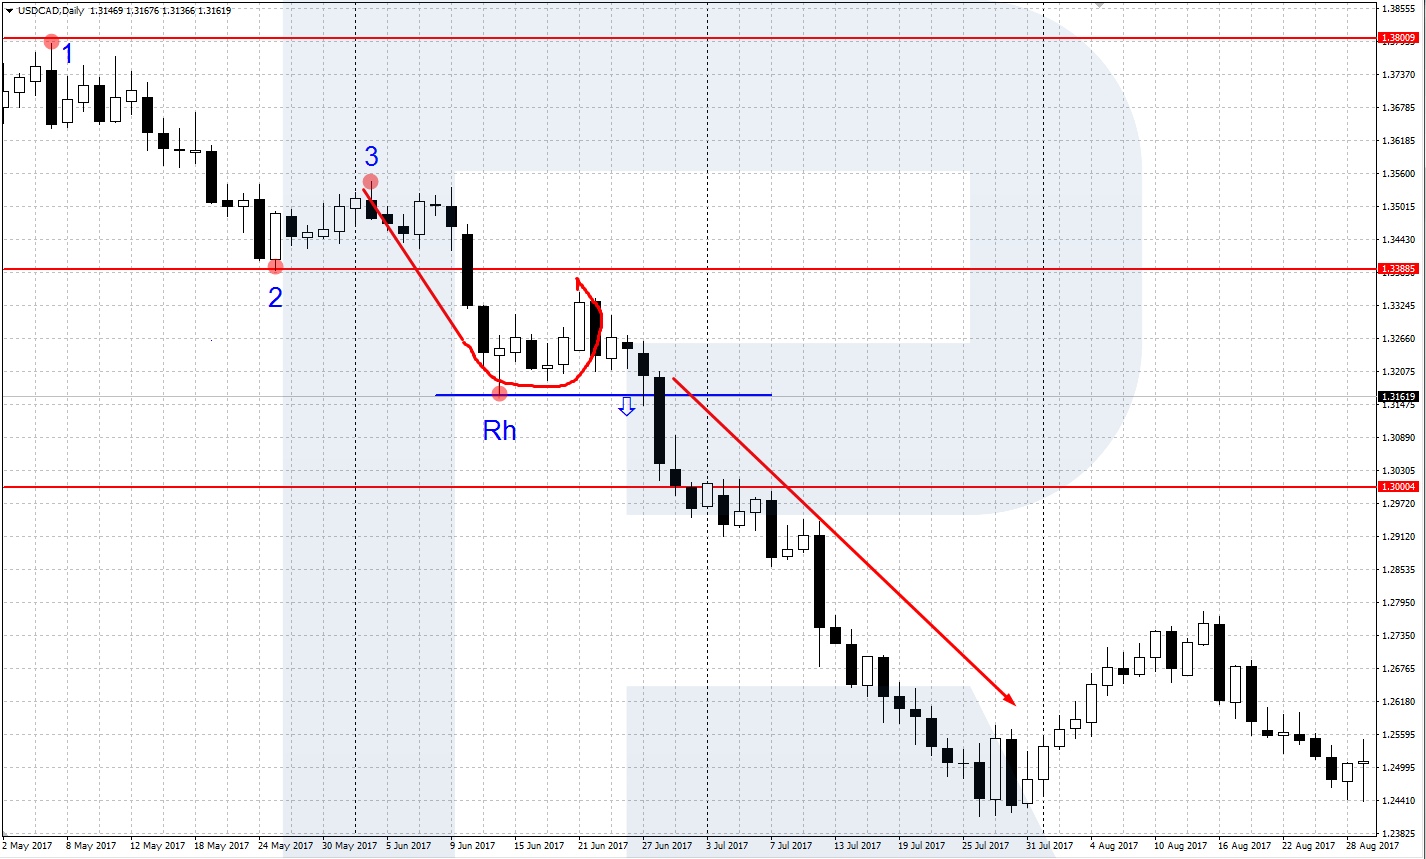
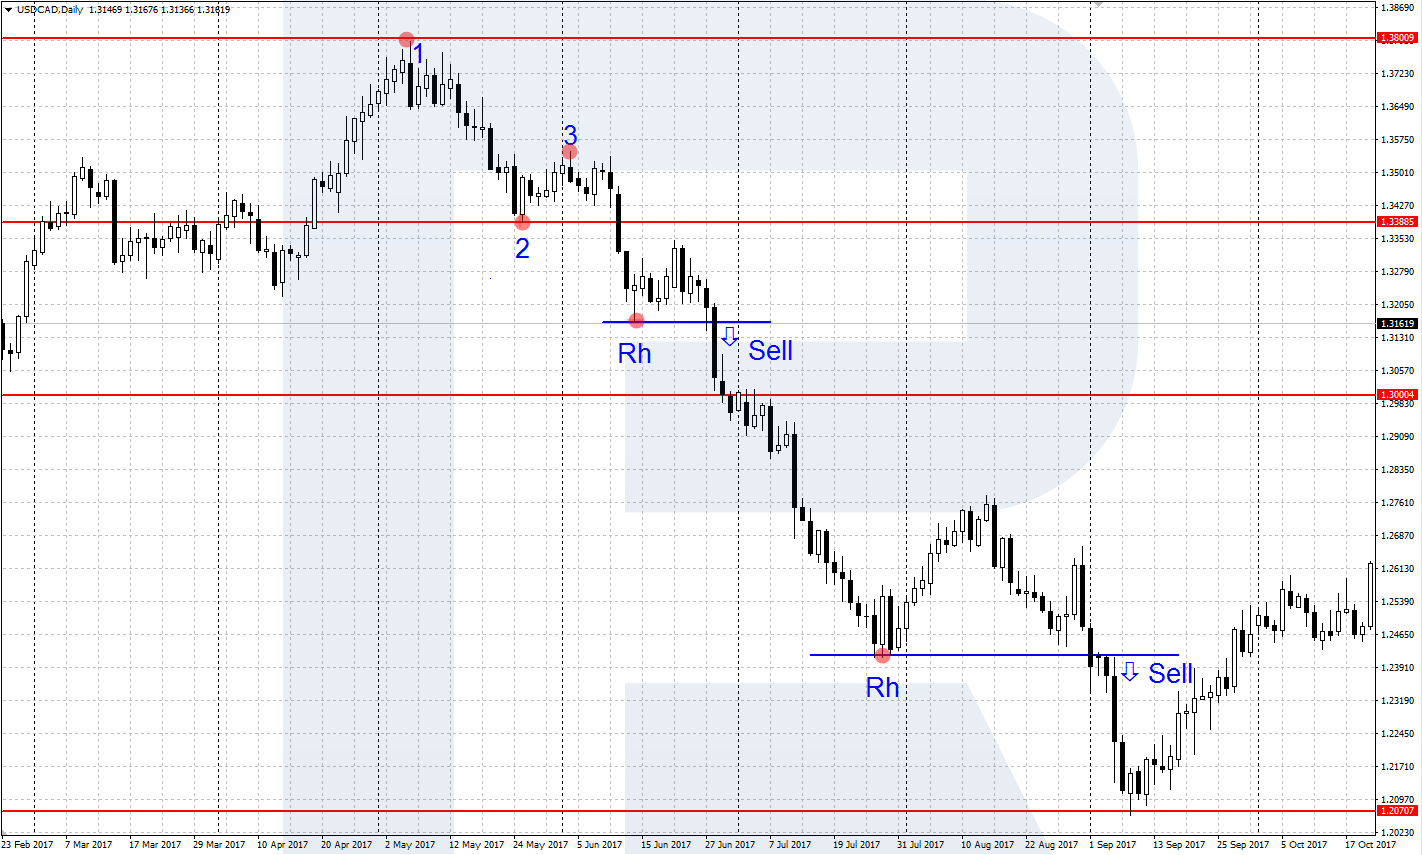
Hooks to sell
A Hook to sell is formed in a similar way to the previous Hook, only in a downtrend after a complete bearish 1-2-3 pattern. The price makes a new low, which is the point of the RH, after which a small upward correction, no higher than point 3, follows. The movement from point 3 to the RH high is called the handle of the Hook, and the correction completes the pattern.
A pending or market order to buy is executed when the price becomes lower than the RH low. The SL is behind the nearest high of the Hook, the minimal profit is the size of the handle. In a downtrend, there might form several Hooks one after another. Each one can be traded separately, or the position may be held and buys filled in until the trend reverses.
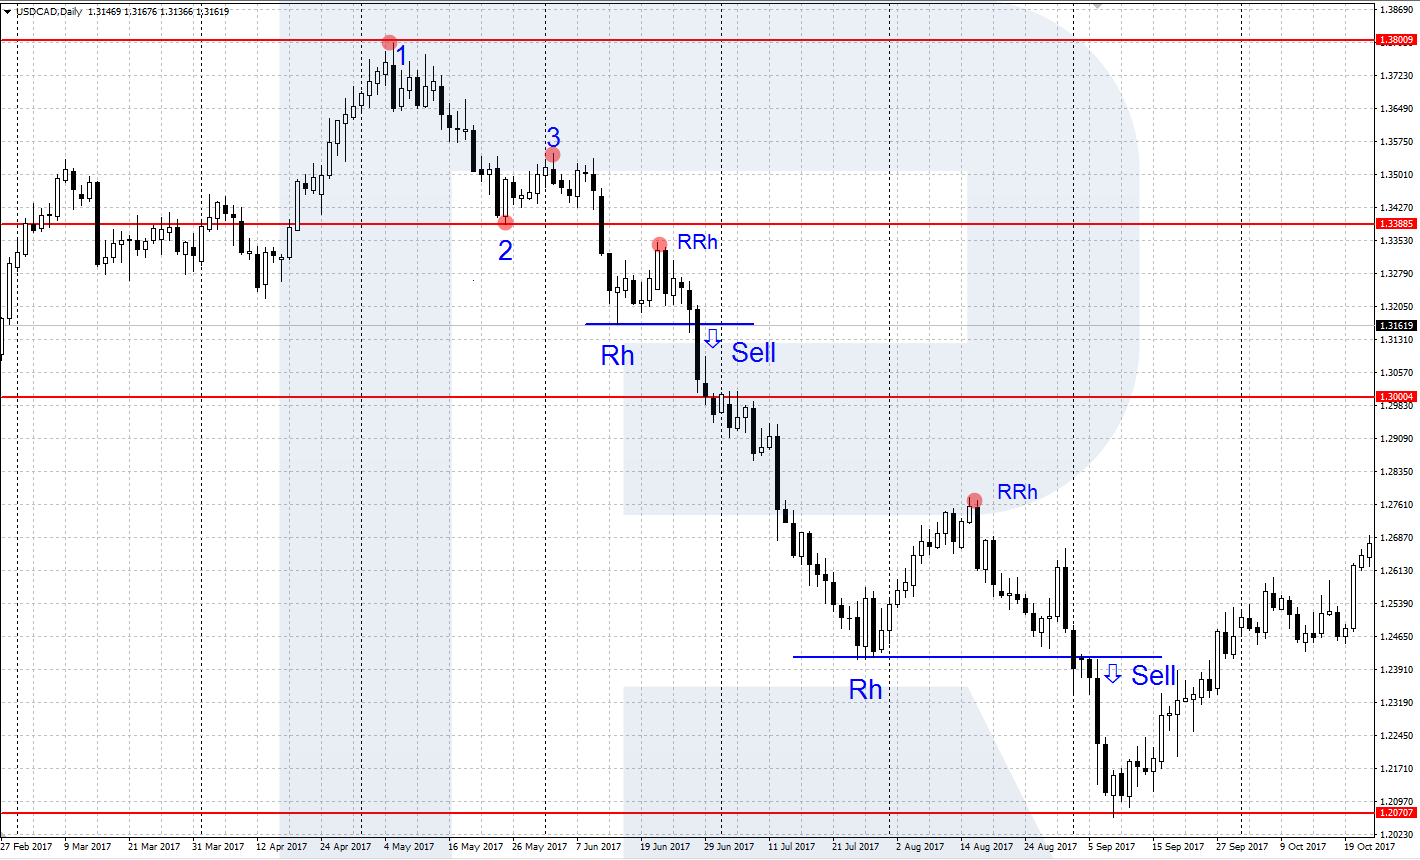
Reversal Hooks
A Ross Reversal Hook (RRH) is formed at the pullback from the point of the RH and forming a new local low/high in the current trend. This is the point where the correction of the main Hook ends, followed by a movement along with the trend.
Joe Ross uses the RRH as the landmark for SLs and a signal for a reversal of the trend.
In an uptrend, falling below the point of an RRH means the end of the uptrend and the approaching RHs for sell. In a downtrend, the growth higher than the point of the RRH means the completion and a possible reversal of the trend, we should wait for the RHs to buy to appear.


Placing SLs and TPs
Joe Ross uses several ways of placing SLs and TPs. In his book, the ways are described in detail, you can change sone that suits your trading style. Let us discuss two popular ways.
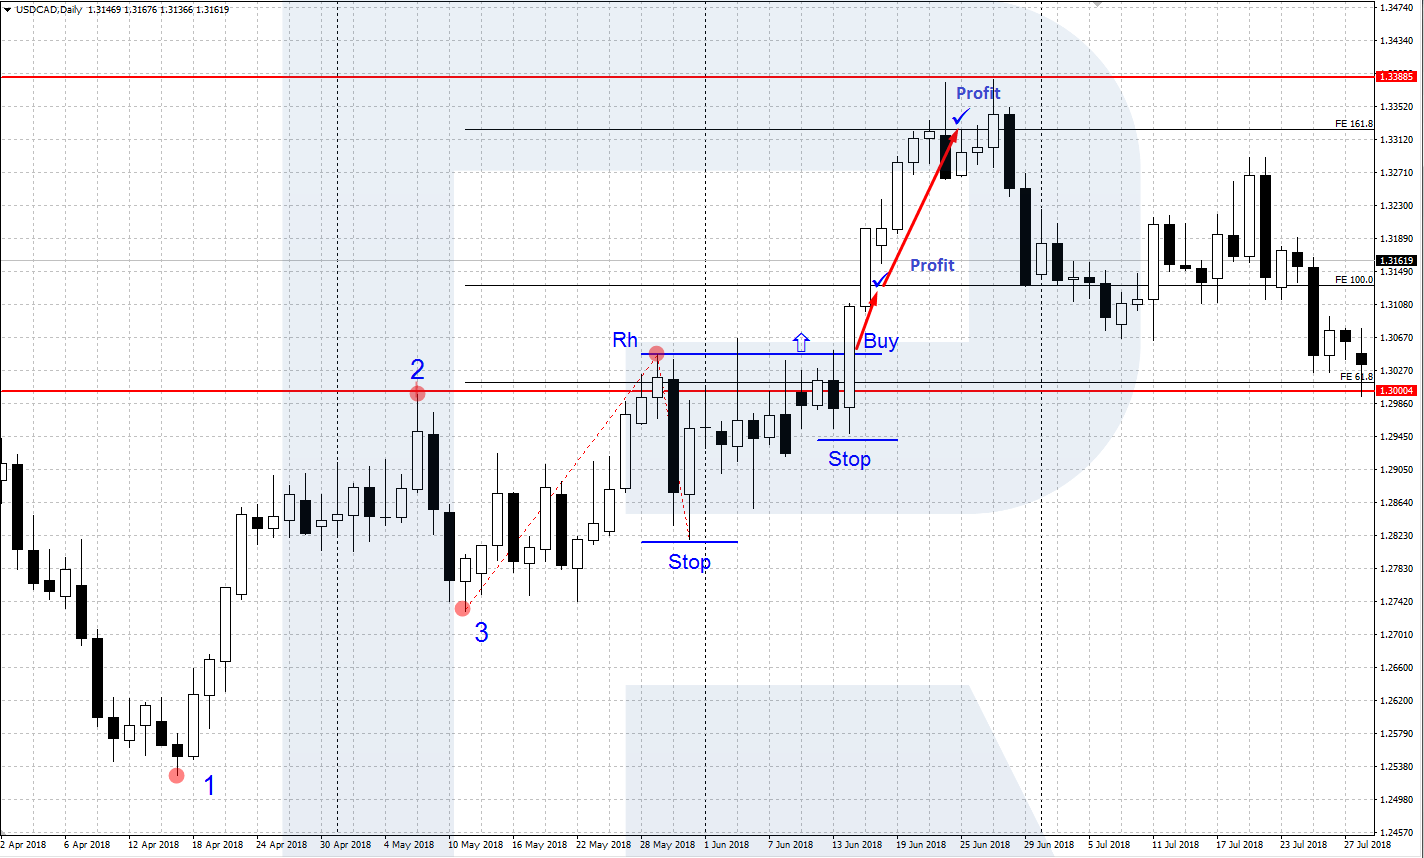
A Stop Loss at the natural support/resistance levels
By Joe Ross, the natural support and resistance points are the places on the chart where the price corrects and moves along with the trend then. For an uptrend, these are the new local lows emerging after a correction. For a downtrend, these are the new local highs after each correction. These levels almost coincide with the RRH points. An SL is put behind these levels.

A TP by the Fibonacci extension
As a landmark for taking profit, Fibo levels can be used. The instrument Fibo extensions are available almost in all popular trading terminals. We take it and apply it to the formed RH on the chart. Aims for the TP will emerge on the chart — the Fibo levels 61.8, 100.0, 161.8. You can close the position partially on each level.
Summary
In his example, Joe Ross has demonstrated that his strategy works well and can bring a stable profit. Using the RHs, one can build a whole series of profitable trades along with the trend. It should, however, be remembered that they work well in a trend. For success, you need a cycle: a trend movement - a correction - the continuation of a trend.
In the article, we have only discussed the main principles of trading with RHs. The author may supplement their strategy with filters, tricks and other fruit of their experience. I recommend Joe Ross's book on RHs.


