How Does the Fractals Indicator Work: Description, Settings
9 minutes for reading
The Fractals indicator was designed and popularized by Bill Williams, the author of one of the most popular trading systems and the book "Trading Chaos". This instrument is a technical indicator that allows to detect local extremums on the chart. A breakout of these levels may provoke a good future move in their direction. The author recommends using Fractals with the Alligator indicator; however, there are methods of trading with Fractals that are far from the classical author's ideas.
Description of Fractals
For the indicator, we use five candlesticks, the third candlestick in the combination should have the highest high or the lowest low. If there is such a formation on the chart, the indicator shows narrow either above the candlestick or below it.

For example, if we are speaking about an ascending fractal, to define it, we need to see on the chart a minimum of five candlesticks following one another, with a lower candlestick at each side of the highest one. Conversely, for a descending fractal, here it is important to see a minimum that will be among four other candlesticks with higher minimums.
The author notes that for a fractal, we do not need five candlesticks exactly, there might be less. However, the five-candlestick combination has become most popular in modern trading.
One of the important advantages of the indicator is the possibility to mark important support and resistance levels. Many traders just add Fractals to the chart and work with breakouts of the levels or try to combine it with graphic patterns.


How to install and configure the indicator Fractals?
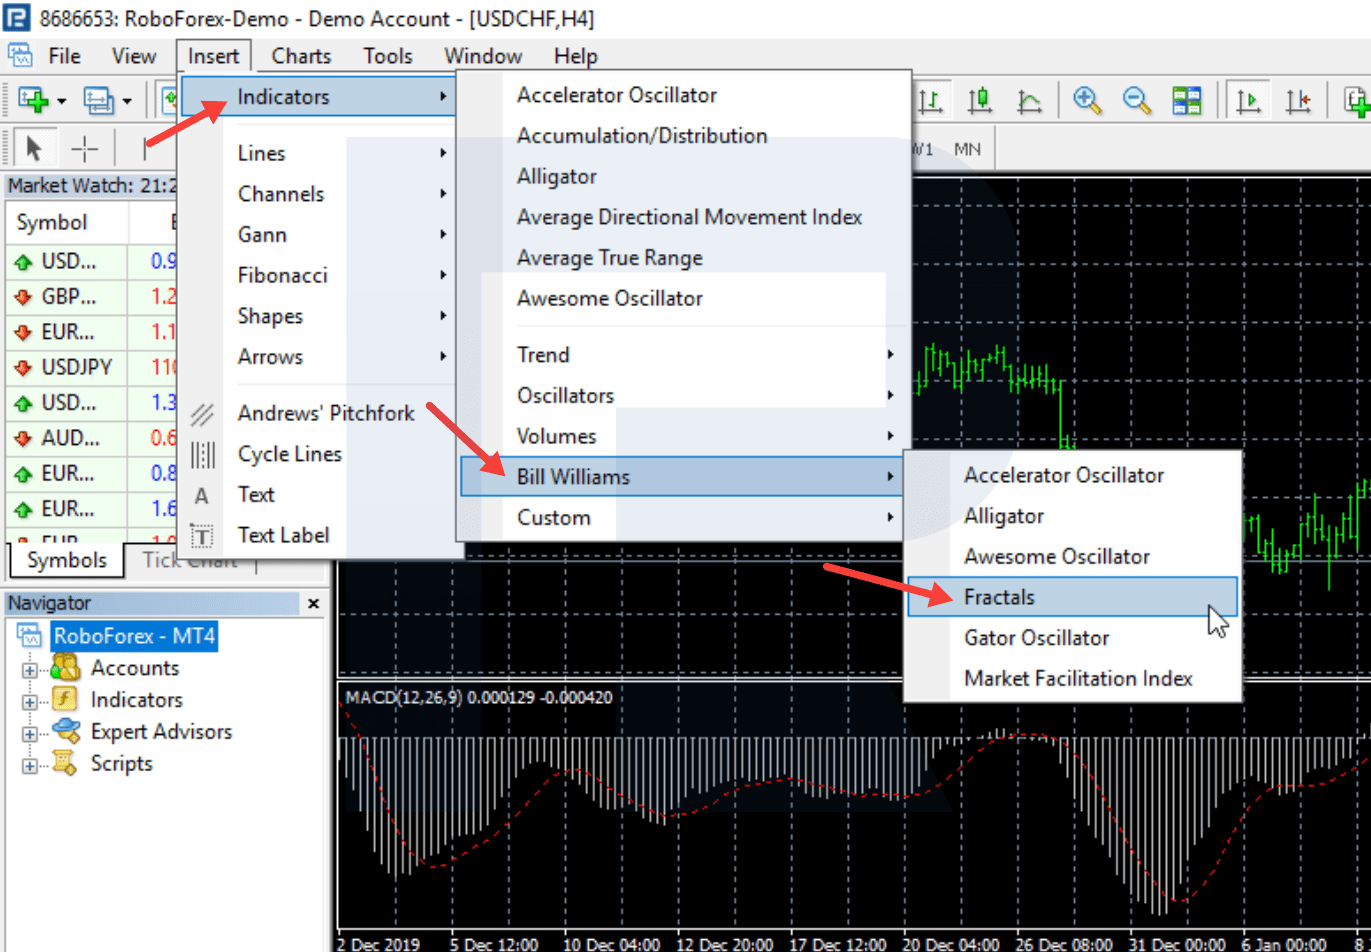
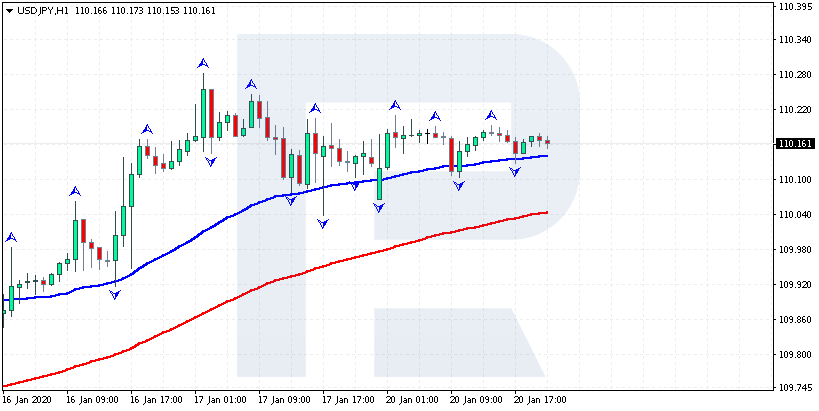
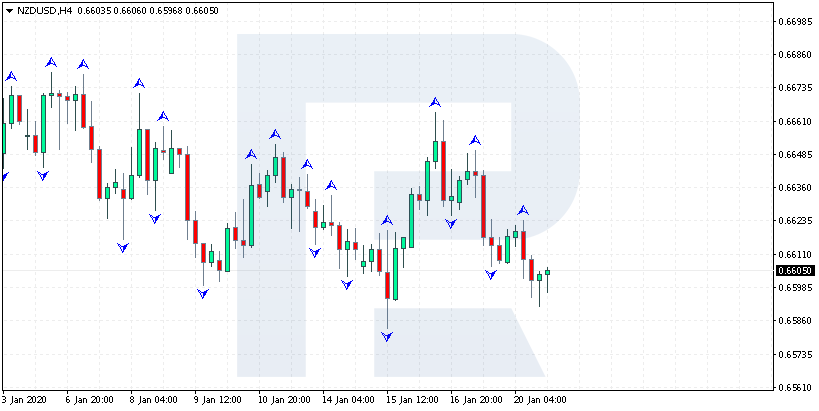
To add the indicator to the chart in the MT4 trading terminal, press Insert - Indicator - Bill Williams - Fractals. Then choose the color and the timeframe. Then we will see the indicator on the chart. Each arrow on the chart is a fractal.
How to use Fractals?
The indicator itself is considered to mark an important level on the chart. The author used it as a supplement to the trading strategy Alligator. A breakout of an ascending fractal is called "bullish breakout". A breakout of a descending fractal is called "bearish fractal". Such breakouts were regarded by the author as a signal to open a position in the direction of the breakout. However, it is worth remembering that Bill Williams works along with the trend and combines signals from Fractals with the Moving Average. And working along with the prevailing trend is always very promising in the long run.
However, the simple strategy when all the fractals are broken out and positions closed at the moment of forming of a contrary fractal is rarely used due to the large number of fractals on the chart and poor efficiency of such an approach. So, attempts to buy at the breakout of each and every fractal and trade in every direction should be put away and your own strategy should be constructed.
Another good way of using fractals is putting protective Stop Losses behind the fractal. For example, if we open a selling trade, a Stop Loss is put above the high of the two last fractals. And if we open a buying trend, we put a Stop Loss below the last two minimal fractals.


A simple strategy based on Fractals
The author uses the indicator to trade the prevailing trend on the market. So, as the simplest system based on Fractals, we can try working along with the trend by our own rules. For this, we take two MAs with different timeframes, such as EMA 45 and EMA 95, that will show the direction of the trend.
If the quick MA with the period 45 is above the slow MA with the timeframe 95, it is important to understand that the trend on the market is bullish. Here, we should look for signals to buy and look for a breakout of an ascending fractal.
As a rule for opening the position, we may use crossing of the EMA 45 and EMA 95. Then we wait for a new ascending fractal to form, and as soon as the price breaks it upwards, we open a position to buy. We put a Stop Loss behind the first descending fractal that appeared before the crossing of the two MAs. Then we move the SL after the price until the MAs cross back again which means forming of a trend in the opposite direction.
However, if the quick MA with the timeframe 45 is below the slow one with the timeframe 95, the trend on the market is bearish. Here, we should look for signals to sell the financial instrument and look at the breakout of a descending fractal.
To open a selling position, we may use crossing of the EMA 45 and EMA 95. Then we wait for a new descending fractal to form, and as soon as the price breaks it downwards, we open a position to sell. We put a Stop Loss behind the first ascending fractal that appeared before the crossing of the two MAs. Then we move the SL after the price until the MAs cross back again which means forming of an uptrend.
Thus, we get a simple trend strategy with clear rules. Of course, it will give good signals on the instruments with strong volatility and movements. It is not to be forgotten that an essential part of any system is following the rules of money management. Also, any trader can customize the system along with their own rules and their instrument. It is worth experimenting and search the best conditions for opening the position.


How to use Fractals in trading patterns?
The use of graphic patterns always includes interpretation of the chart, so it can be said that such patterns are searched for and drawn intuitively. To make the process simpler, many experienced traders use Fractals that helps evaluate the situation more objectively.
For example, if we use the Wolfe Waves, it is not always possible to define all the points necessary to draw the pattern. And if the trader adds a fractal to the indicator, important levels and foothold points will become more visible on the chart, which will make trading and making decisions much simpler.
Apart from making the search of important levels easier, we can put pending orders above or below the fractal depending on where the graphic pattern points: this will free us of staying at the screen all the time.
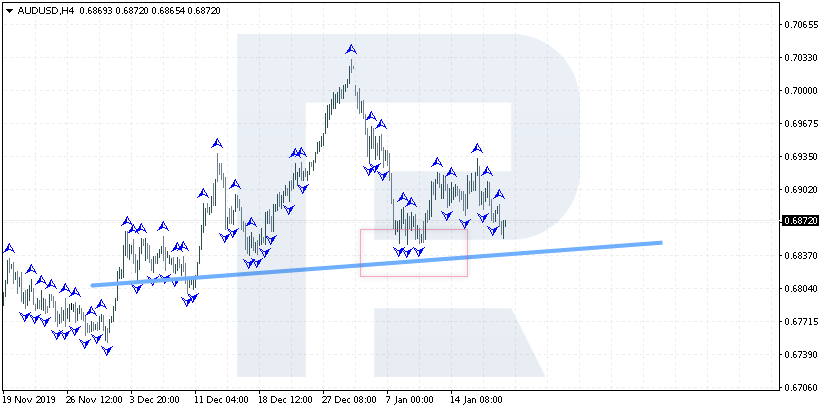
For example, right now there is a reversal pattern Head and Shoulders forming on the H4 of AUD/USD. When we add the indicator, we can see an important resistance level at once around 0.6960. At the moment of the left shoulder forming, the price project the level and pushed off. As we see, a fractal formed later that marked this level as an important one. Then, at the right shoulder forming, we can also see an ascending fractal appearing after testing 0.6960, which means the presence of a strong resistance level.
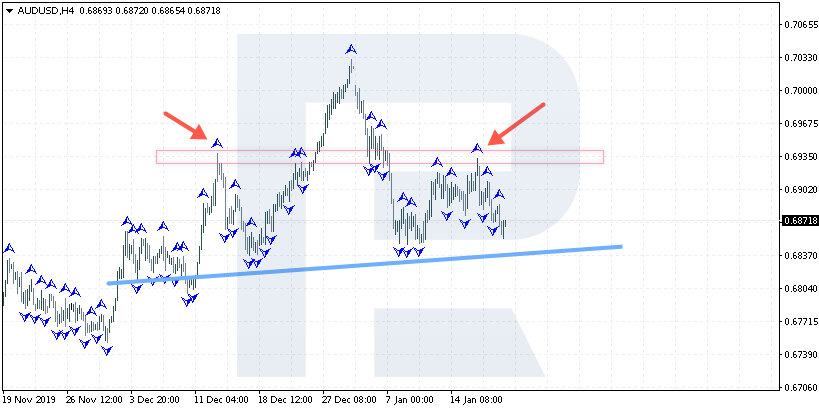
So, if we open a trade at the current market price, we should put a protective Stop Loss above this area. We can add a new selling trade after a breakout of 0.6830. As we can see, here as well, at the moment of testing this area, several descending fractals were formed, which confirms the importance of this level as a support area. Here, the neck of the reversal Head and Shoulders also lies; a breakout of this area will mean that forming of the pattern is complete and its execution is at full scale.
Bottom line
The Fractals indicator shows well important levels on price charts, which the trader may use for trading breakouts or placing SLs. However, Fractals are most efficient when used with other indicators, such as the MAs, where we will trade breakouts in the direction of the current trend only. A combination with graphic patterns will also be a good idea.
Using the indicator separately for trading will not be the right decision. On the whole, it should be remembered that any system is to be customized, and this can be done after using the indicator for a long time.


