How to Trade with Average True Range (ATR) Indicator: Setting and Signals

6 minutes for reading
In this review, we will discuss a useful technical indicator ATR. It helps to evaluate and use in trading such a price parameter as volatility.
How does ATR indicator work?
The Average True Range (ATR) indicator was created in 1978 by the creator of several other popular indicators J. Welles Wilder. The main task of ATR is to evaluate the current volatility of the financial instrument. In other words, the indicator shows the dynamics of the price change during a certain period.
The principle of market analysis with ATR can be expressed as follows:
- the higher the indicator values are, the higher the market volatility is; the probability of a correction or reversal increases;
- the lower the indicator values are, the lower the market volatility is; this means the market is quiet, and a strong trend may begin after the price escaped the consolidation area.
ATR belongs to the oscillator group. As long as it helps to evaluate volatility, it is often used as a part of more complicated indicators. Also, it is often included in various trading algorithms - expert advisors. ATR has proved to be a good trend filter and a provider of landmarks for Stop Losses.
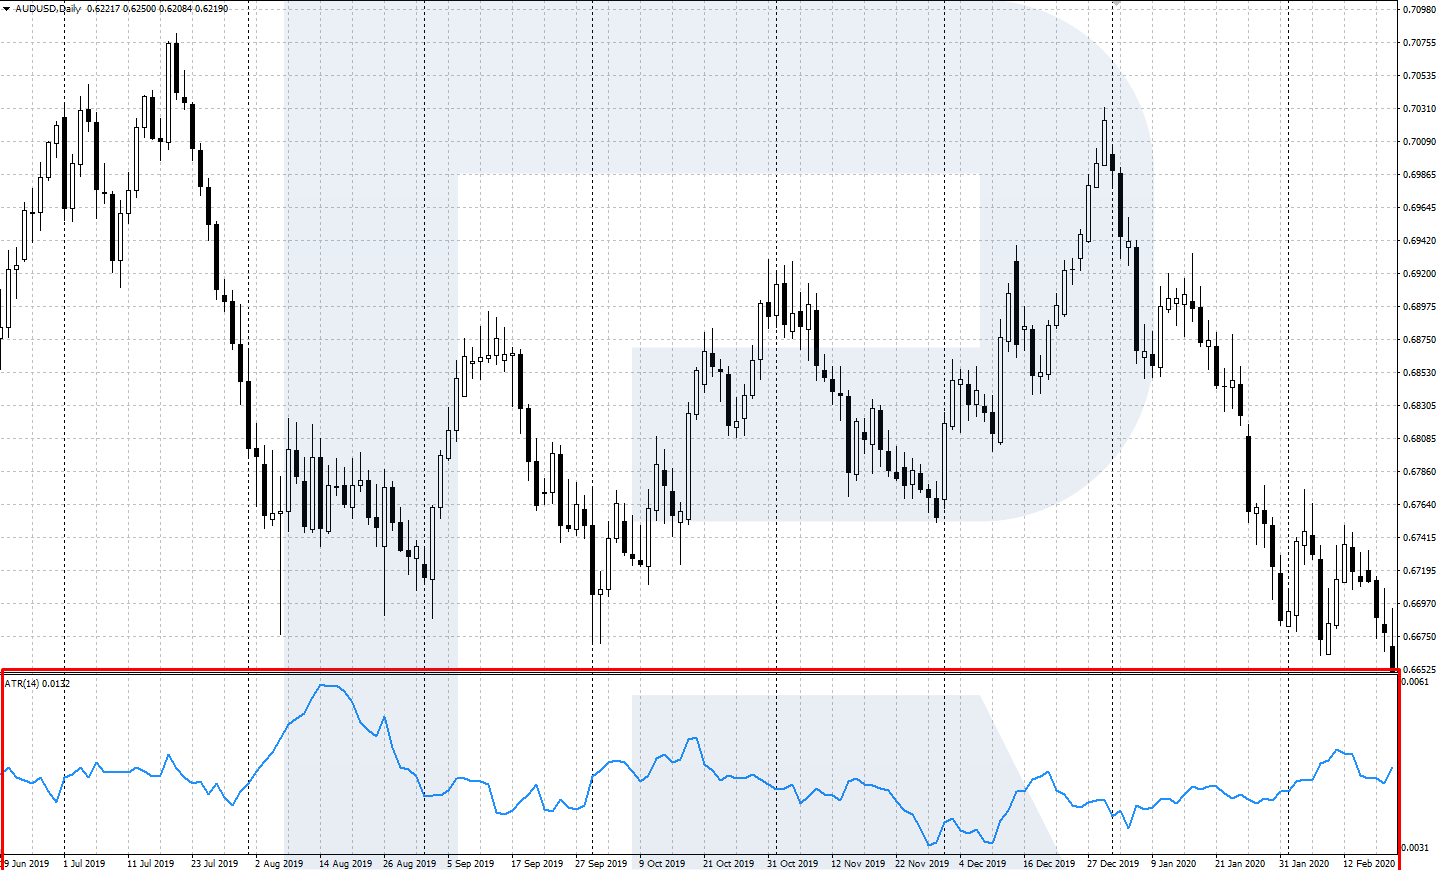
The indicator is reflected in a separate window under the price chart; it consists of just one line, showing only positive values (0 and above). ATR does not show trend direction: it will grow equally if volatility increases in an uptrend as well as in a downtrend. The higher the volatility on the market, the bigger the ATR values.
ATR indicator: calculation formula and settings
ATR is included in most trading terminals. In MetaTrader 4 and MetaTrader 5, it is added to the chart via the Main Menu: Insert - Indicators - Oscillators - Average True Range.
For the calculation of the indicator values, first, we define the True Range, which is the largest of three values:
- the difference between the current high and low: High (1) – Low (1)
- the difference between the current high and the preceding closing price: High (1) – Close (2)
- the difference between the preceding closing price and the current low: Close (2) – Low (1)
True Range = MAX (High (1) – Low (1); High (1) – Close (2); Close (2) – Low (1))
Then the ATR value is calculated as a Simple Moving Average from the True Range with a set averaging period:
Average True Range = SMA (True Range; n)
Where:
- SMA is a Simple Moving Average;
- n is the averaging period.
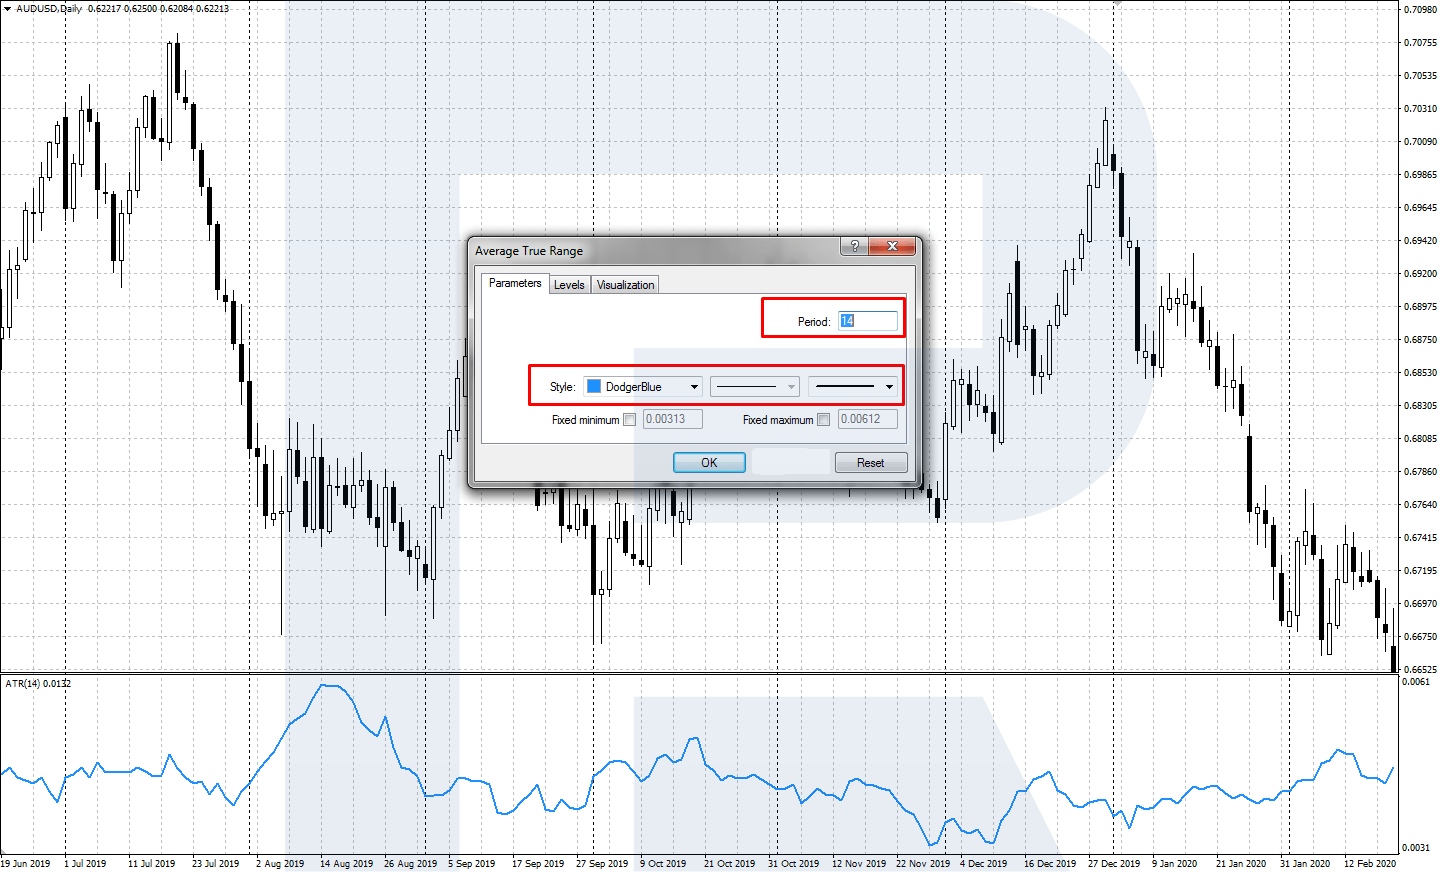
The ATR values are calculated on the trading platform automatically. When installing the indicator, set the following parameters:
- the ATR period is the calculation period of the main indicator line. By default, it is set as 14.
- Colors: you may choose the color, width, and type of the indicator line.
The indicator may be used with the default period 14. However, you may always change the period, evaluate the work of the indicator with the new setting and choose a range, optimal for your trading system.
How to use ATR in trading?
In trading, ATR is often used as an additional filter for defining the trend and as a landmark-provider for placing Stop Losses. Let us discuss the uses in more detail.
Using ATR in trading the trend
ATR helps to notice the beginning of a new movement and signals that the current trend is close to a correction or reversal.
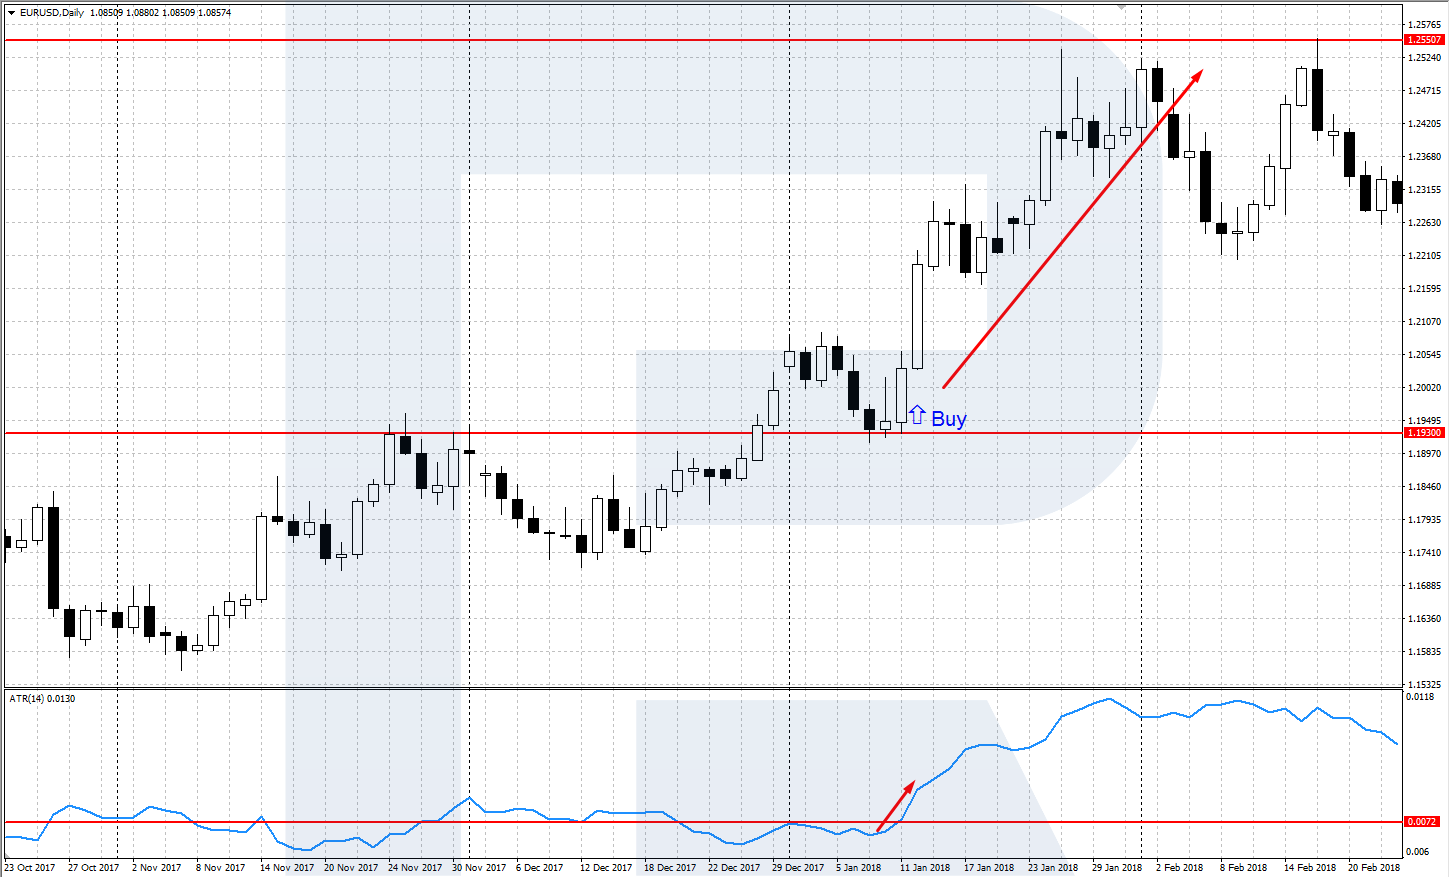
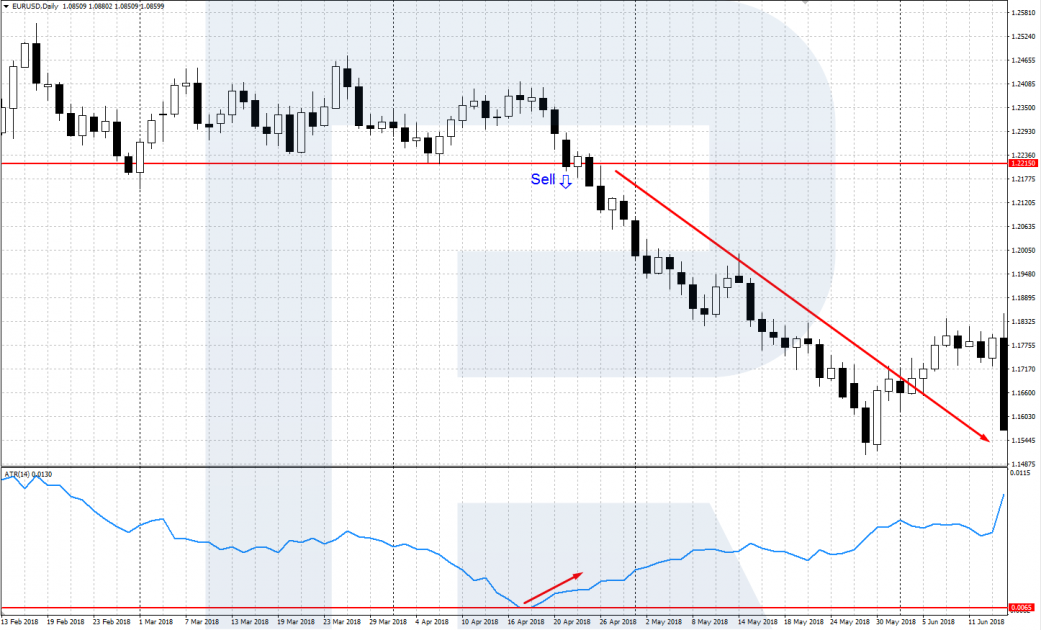
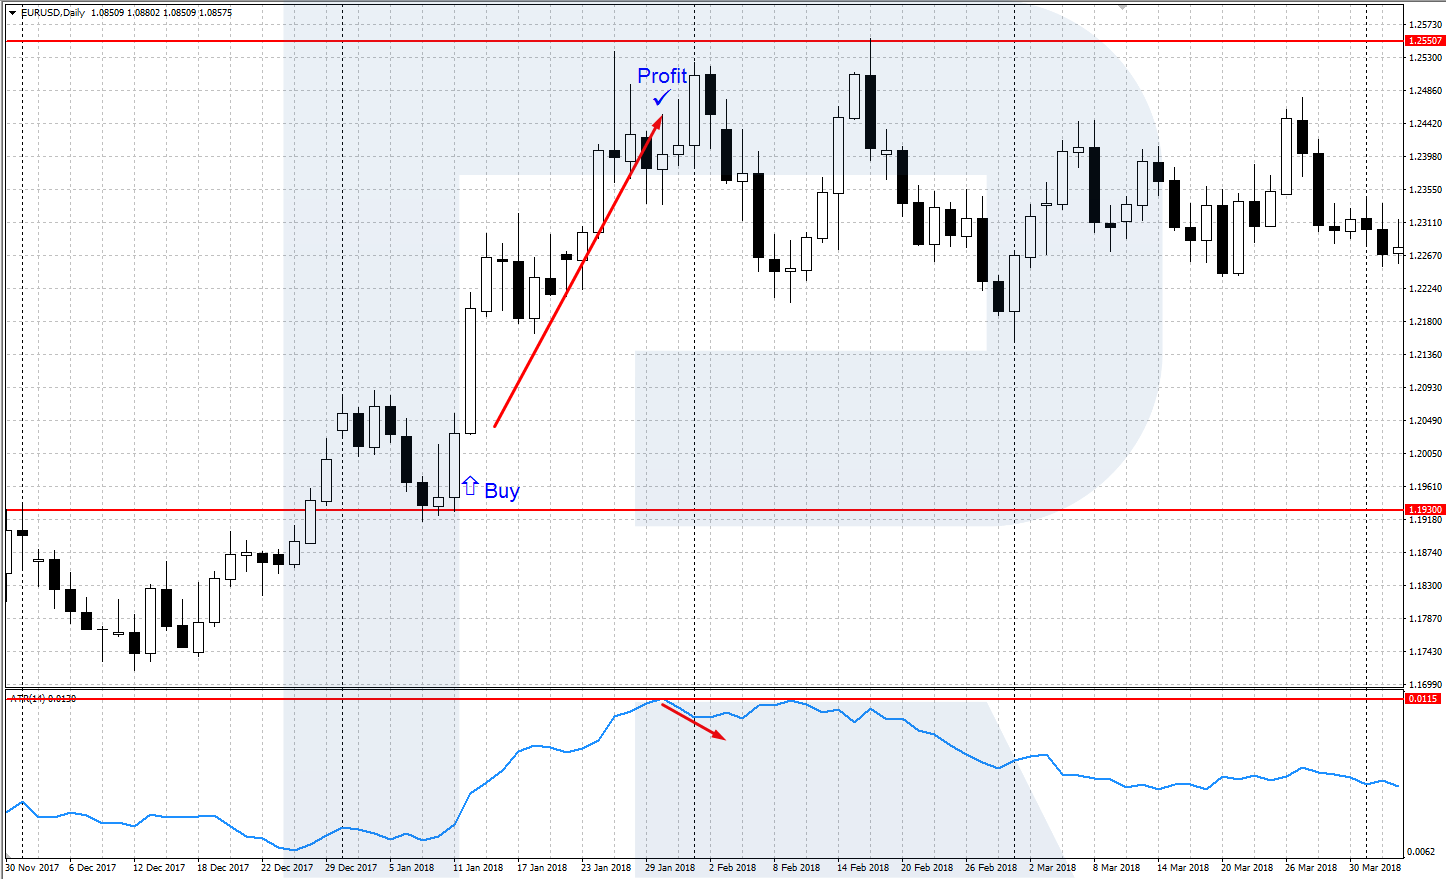
Confirming the entry in a trend
When there is no clear movement on the market, and the price is consolidating in a limited flat, the ATR values are minimal. When the price escapes the range, and a new movement begins, the indicator starts growing. To find an entry point, you may use classical signals of tech analysis, while the ATR growth will confirm the beginning of a trend.
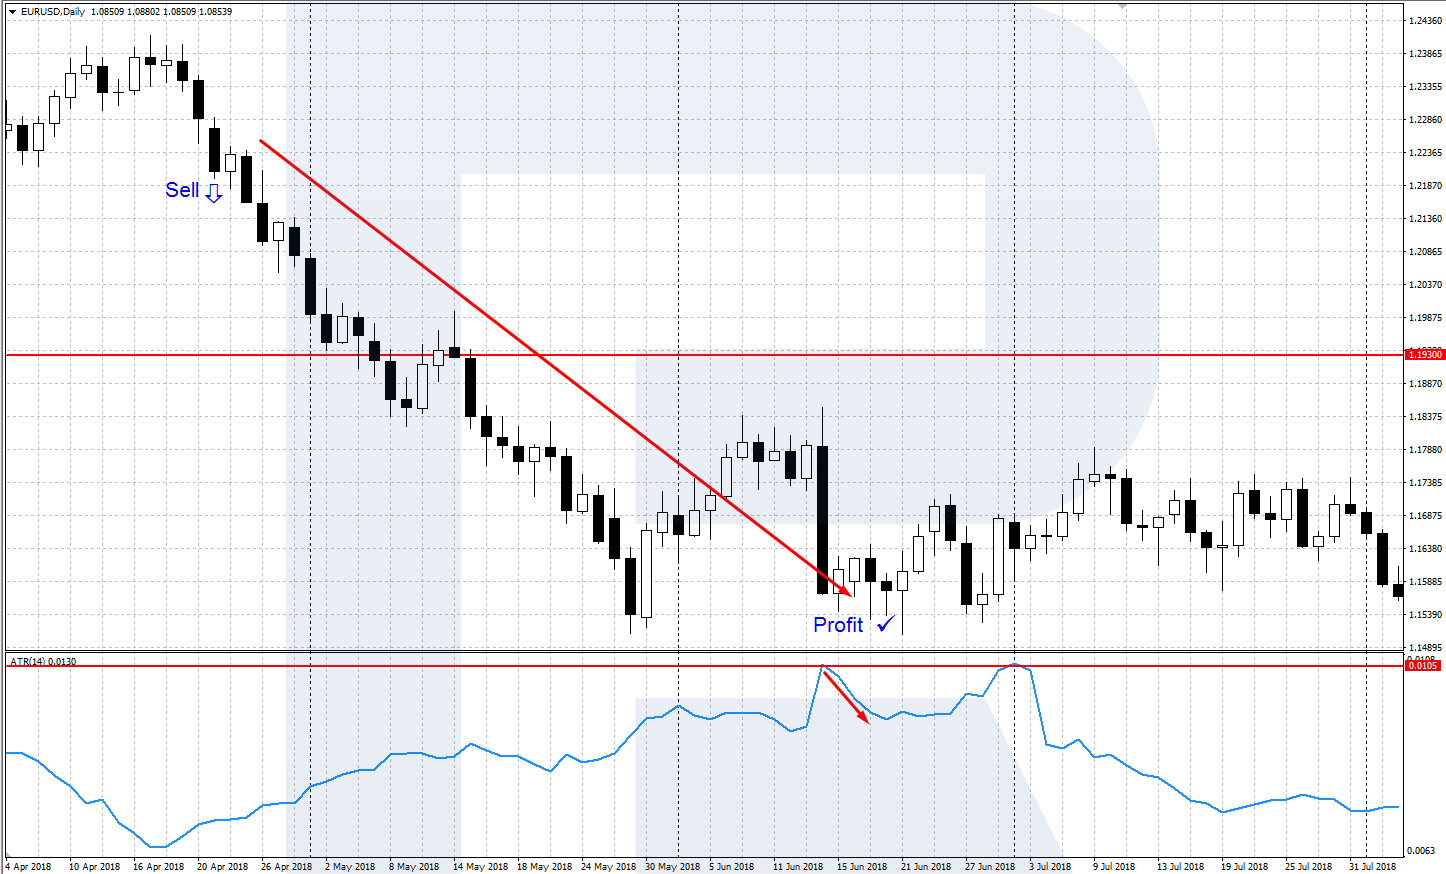
Signal to close a position along with the trend
If you managed to enter the market successfully at the beginning of a new trend, you will sooner or later have to decide when to close a profitable position. For this, you may also use ATR. If after a local high/low forms on the market, the indicator stops growing and starts to decline, this means you should lock in profit. Otherwise, you may lose your profit after a strong correction/reversal.
Placing Stop Losses with ATR
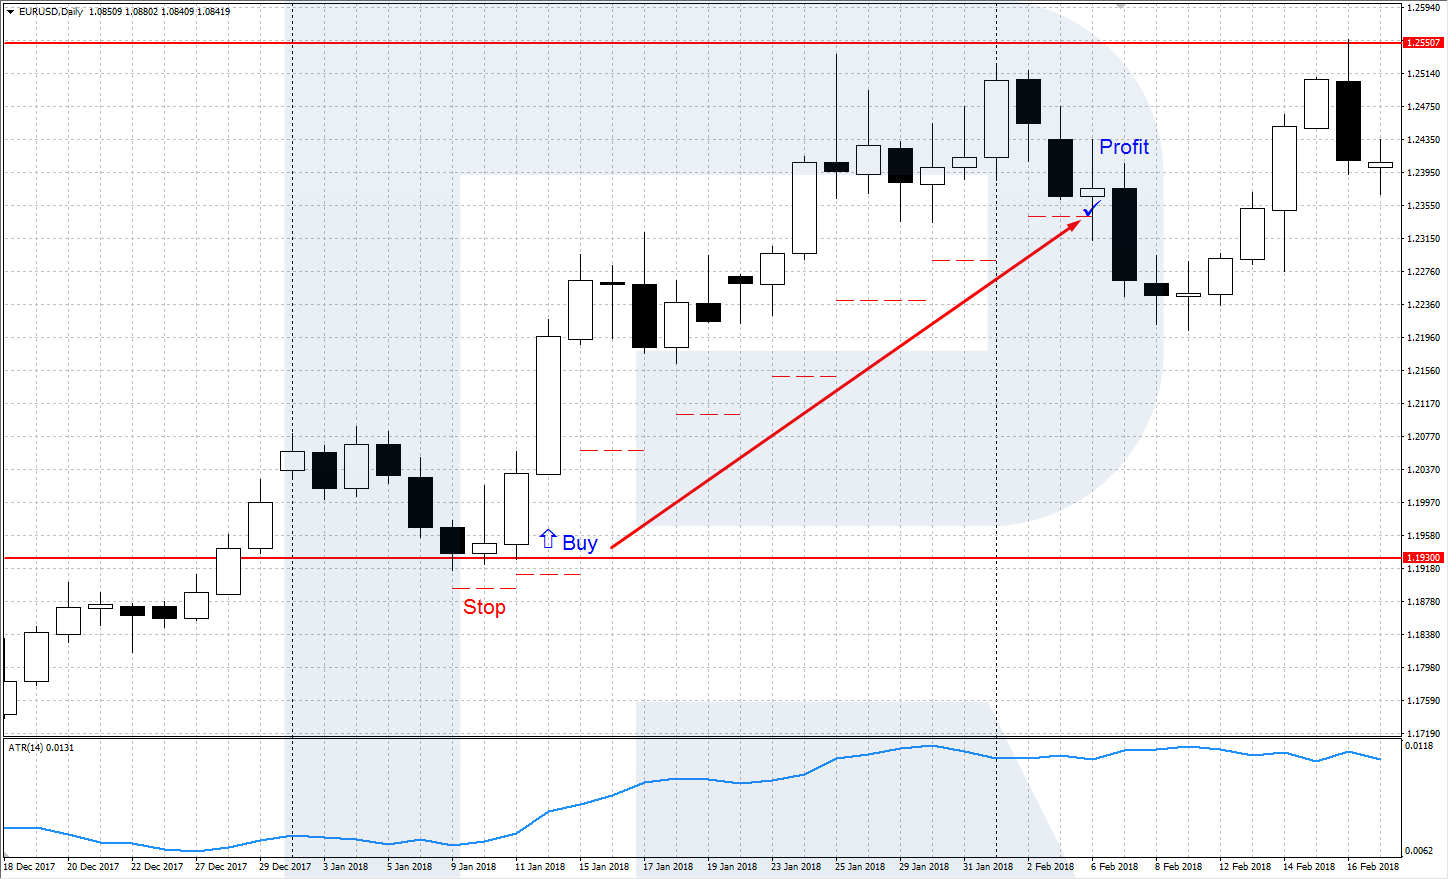
ATR shows the current average value of the price change, which may be used for placing a Stop Loss. Placing Stop Losses with ATR is logical and lets you adapt to the market conditions. In the case of strong volatility, the indicator values grow, along with the SL size, which makes it more stable. When volatility decreases, the SL also becomes smaller.
The SL size is usually a bit larger than the ATR values. For example, you may multiply it by 1.5. Depending on the statistics of the volatility of the financial instrument and the timeframe, the multiplying coefficient may also change. After the SL is initially placed and the trend movement begins, the SL is moved after the price.
After a new candlestick is opened on the chart, we take the current ATR value and multiply it by the chosen coefficient. Thus, we get the SL value in points and place it at a due distance from the current candlestick price. This way, you may move the SL along the trend until it triggers and the position closes, locking in the profit.
Bottom line
The Average True Range indicator is a big help in defining the current market volatility; it is often used for creating automatic trading systems. ATR does not give separate trading signals but serves as a good filter for defining the trend and helps to calculate the size of the SL based on the average volatility of the financial instrument.


