Defining the Market State and Possible Reversals with DeMarker Indicator
5 minutes for reading
In this review, we will get acquainted with the DeMarker indicator. It was created for exchange trading by a famous trader and the guru of tech analysis Thomas DeMark.
DeMarker description and peculiarities
The DeMarker indicator was named after its creator, an outstanding exchange player and the author of many technical indicators Thomas DeMark. The indicator assesses the current state of the prices compared to the previous period, helps to define the market state, and find the place of a possible reversal.
DeMarker belongs to the group of normalized oscillators; its values lie between 0% and 100%; 100% is marked as 1. Unlike many other oscillators, DeMarker pays more attention to intermediate highs and lows rather than closing prices. The algorithm of the indicator compares the current highs and lows on the price chart with the extremes of the preceding period.
Like any other oscillator, DeMarker demonstrates the current state of the market:
- If the indicator line is growing and demonstrates another high, it indicates an active uptrend and an overbought state of the market.
- If the indicator line is declining, forming local lows on the chart, there is a downtrend and an oversold state of the market.
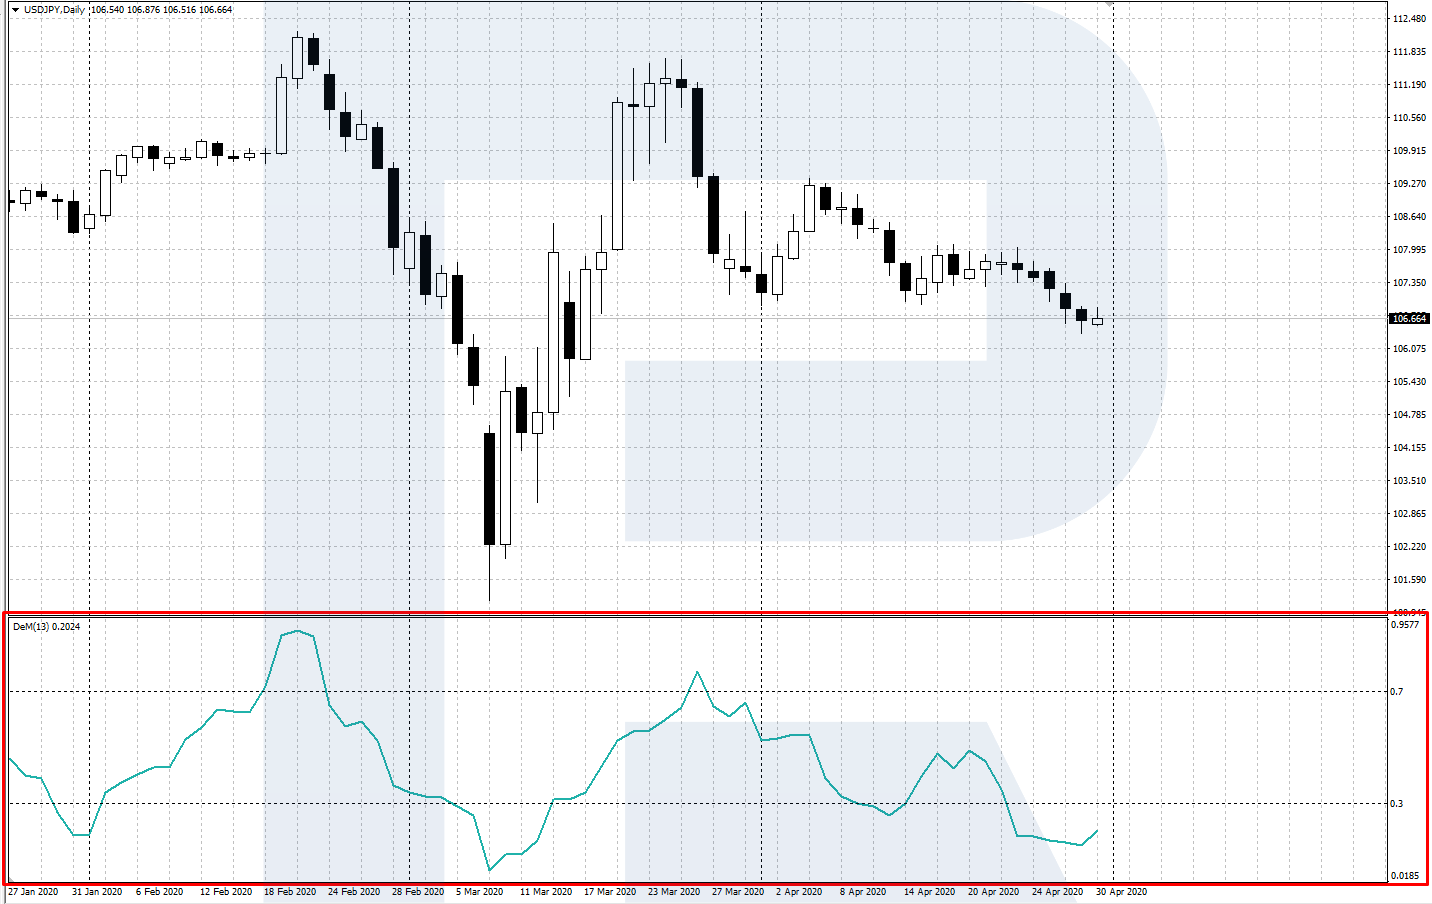
The indicator is displayed in a separate window under the price chart; it looks like a line moving between 0 and 1. The area above 0.7 is called the overbought area where a reversal downwards may form. The area below 0.3 is called the oversold area, where we may consider buying. The DeMarker indicator is included in most of the popular trading platforms.
Calculation formula and settings
To add the indicator to the chart of the chosen instrument in MetaTrader 4 or MetaTrader 5, open it vie the Main Menu: Insert – Indicators – Oscillators – DeMarker.
The algorithm for calculating highs and lows (DeMax and DeMin) is based on comparing the highs/lows of the current period to the highs/lows of the preceding period.
If the high of the current candlestick is higher than the preceding one, the corresponding difference is calculated. If the current high is lower than the previous one or equal to it, the value is zero:
If HIGH ( i ) > HIGH (i – 1), then DeMax ( i ) = HIGH ( i ) - HIGH (i – 1) or DeMax ( i ) = 0.
If the low of the current candlestick is lower than the previous one, the corresponding difference is calculated. If the current low is higher than the previous one or equal to it, the value is zero:
If LOW ( i ) < LOW (i – 1), then DeMin ( i ) = LOW (i - 1) - LOW ( i ) or DeMin ( i ) = 0.
Then the highs and lows are averaged, adjusted for the chosen period, and the DeMarker value is calculated:
DeMarker ( i ) = SMA (DeMax, N) / (SMA (DeMax, N) + SMA (DeMin, N)).
In the formulae:
DeMax is the calculating high
DeMin is the calculating low
HIGH ( i ) is the high of the current period
LOW ( i ) is the low of the current period
HIGH (i - 1) is the high of the previous period
LOW (i - 1) is the low of the previous period
SMA is the Simple Moving Average
N is the number of periods used for calculation.
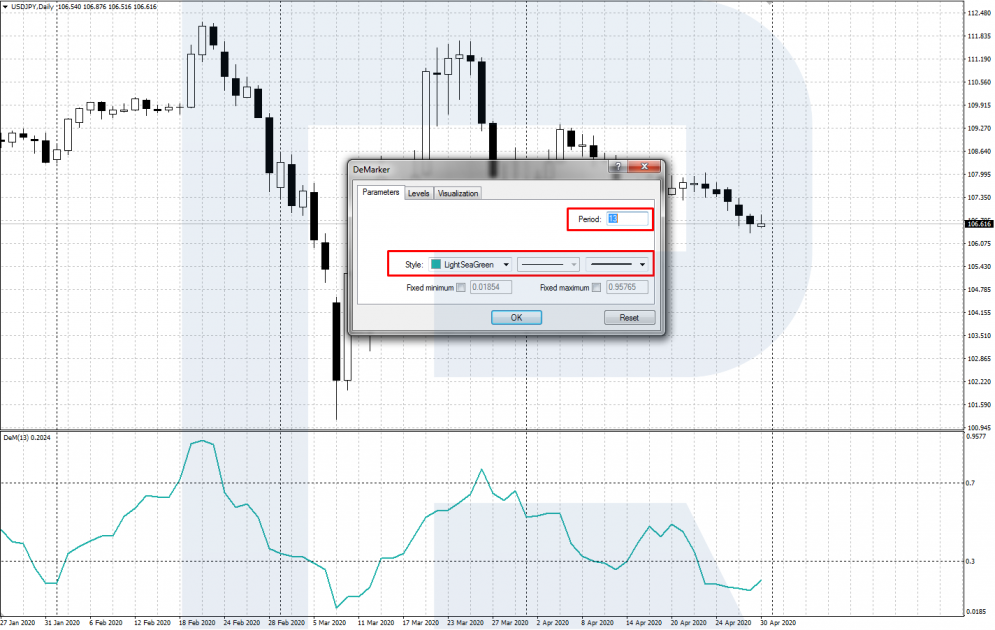
The indicator values are calculated automatically. When installing to the price chart, specify the following parameters in the setting window:
- Period for the calculation. The author recommends 13.
- Style: change the color, width, and style of the main line.
- Levels: the default settings are 0.7 for the overbought and 0.3 for the oversold state.
Trading signals of DeMarker
Let us have a look at the two main signals of the indicator: exiting the overbought/oversold area and a divergence.
Exiting the overbought/oversold zones
This signal forms after DeMarker reaches its extremes in the overbought or oversold area.
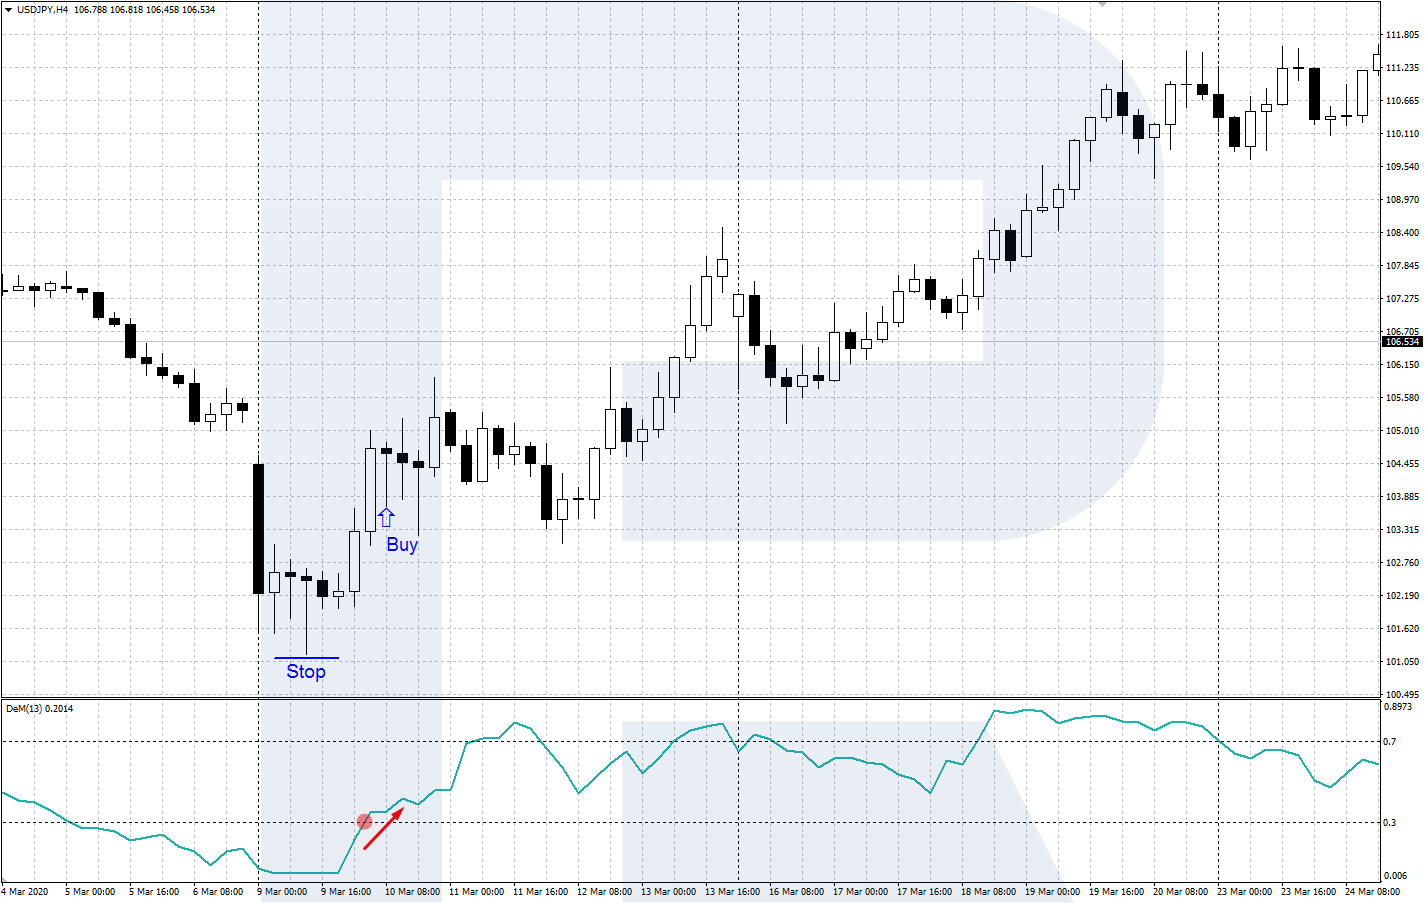
Signal to buy
The signal appears when the indicator reaches the low in the oversold area (under 0.3). When the indicator line, having shown an extreme, reverses upwards and exits the oversold zone, a signal to buy emerges. Wait for the reversal to be confirmed by the price chart and open a buying position with a Stop Loss below the local low.
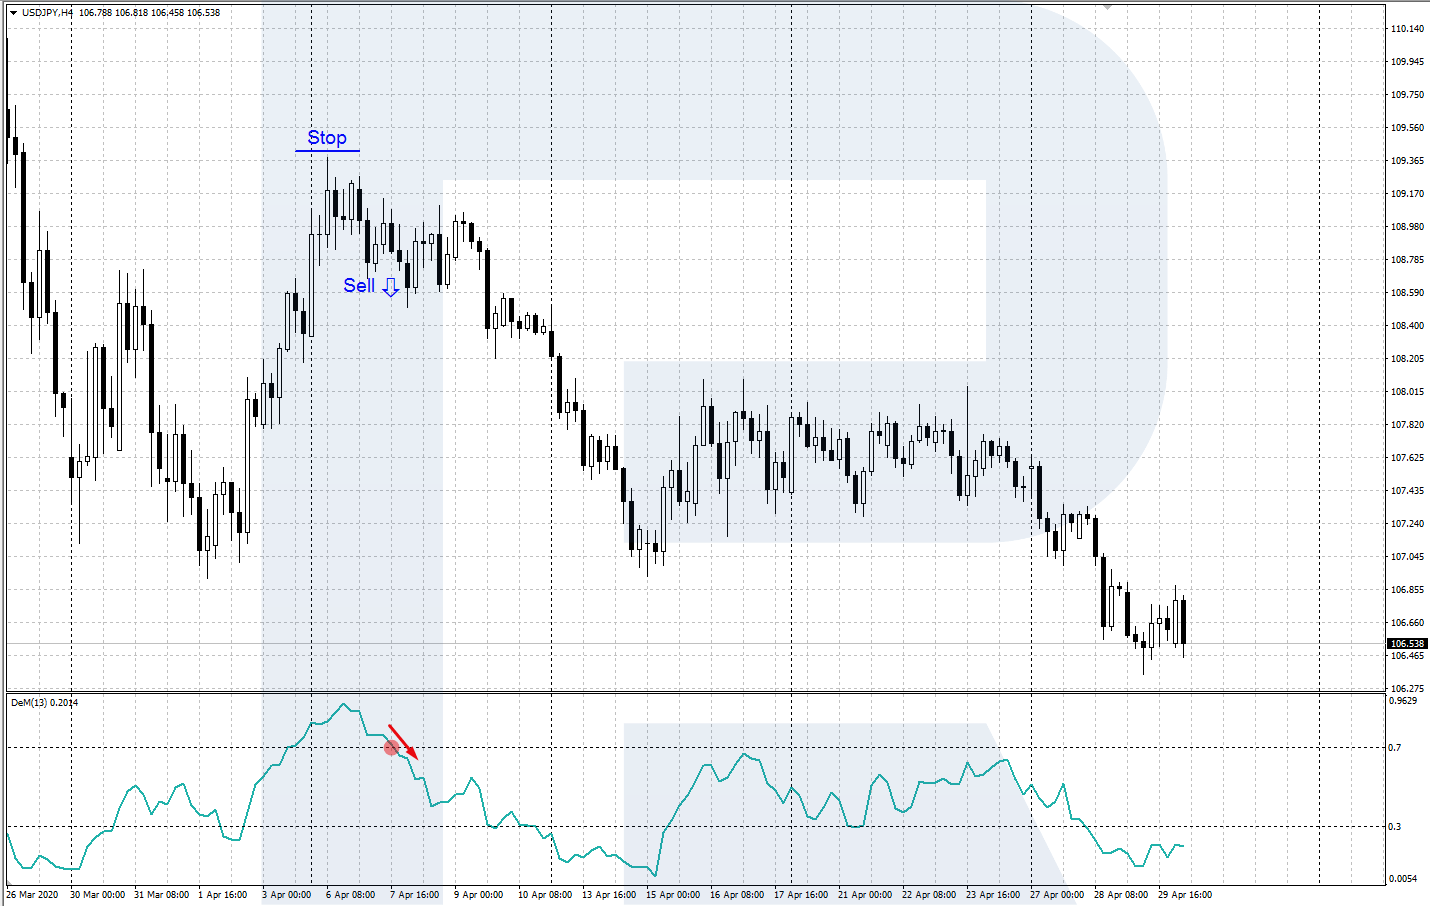
Signal to sell
The signal appears when the indicator reaches the high in the overbought area (above 0.7). When the indicator line, having shown an extreme, reverses downwards and exits the overbought area, be prepared to sell. If the price chart confirms the reversal, open a selling trade with an SL above the local high.
The divergence of DeMarker and the price chart
The signal forms when the local highs/lows of the price chart diverge with the corresponding highs/lows of the indicator.
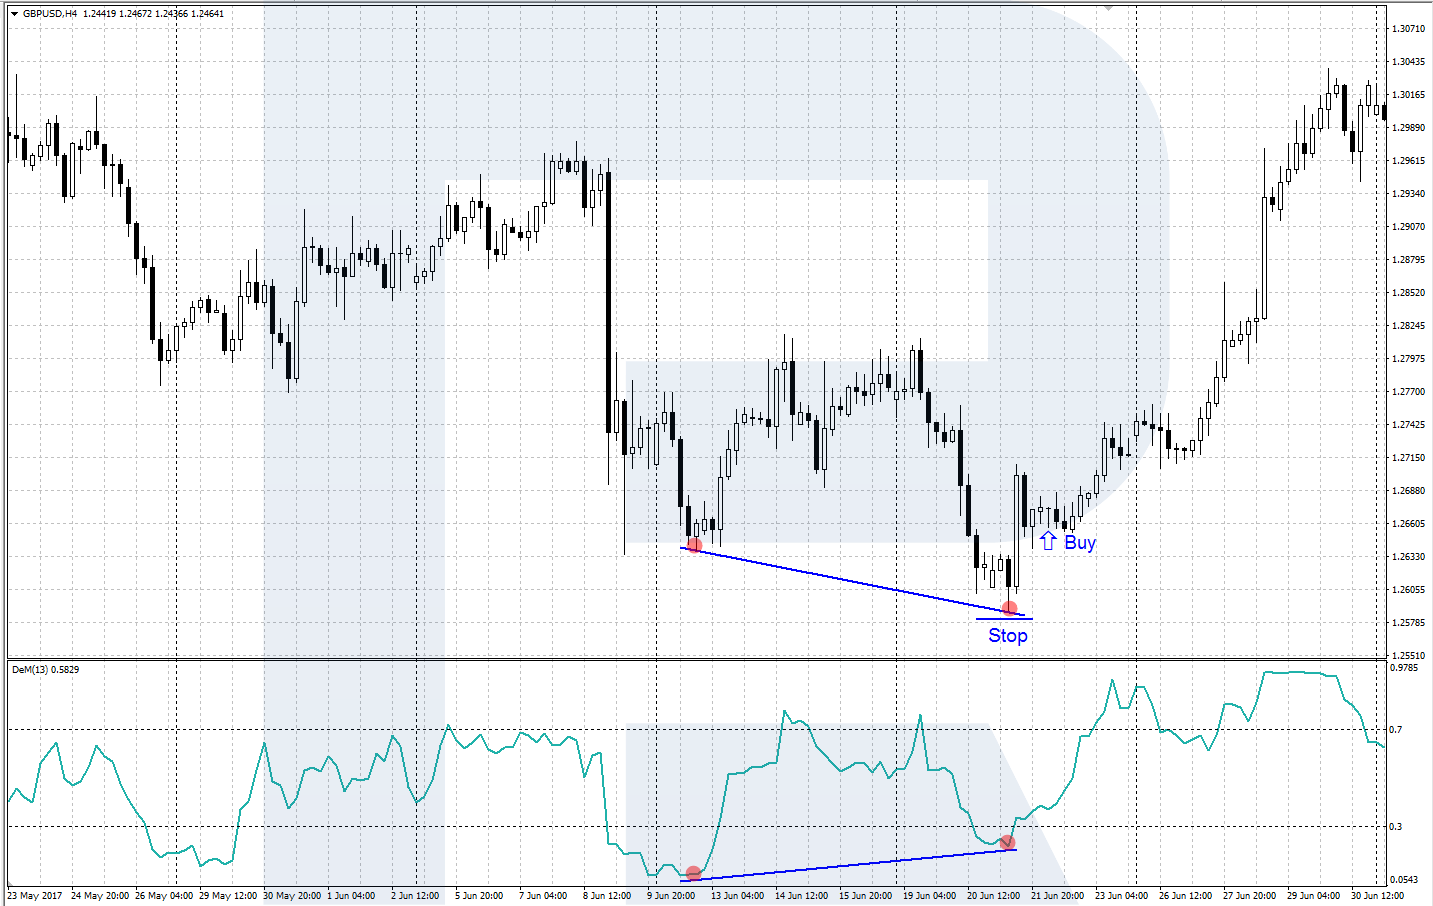
Signal to buy
A signal to buy (bullish divergence) appears when the price chart shows another low below the previous one, while the DeMarker line demonstrates a low higher than the previous one. This means the bulls are seizing the initiative, and we better join them. After the price chart reverses upwards, open a buying trade with an SL behind the last low.
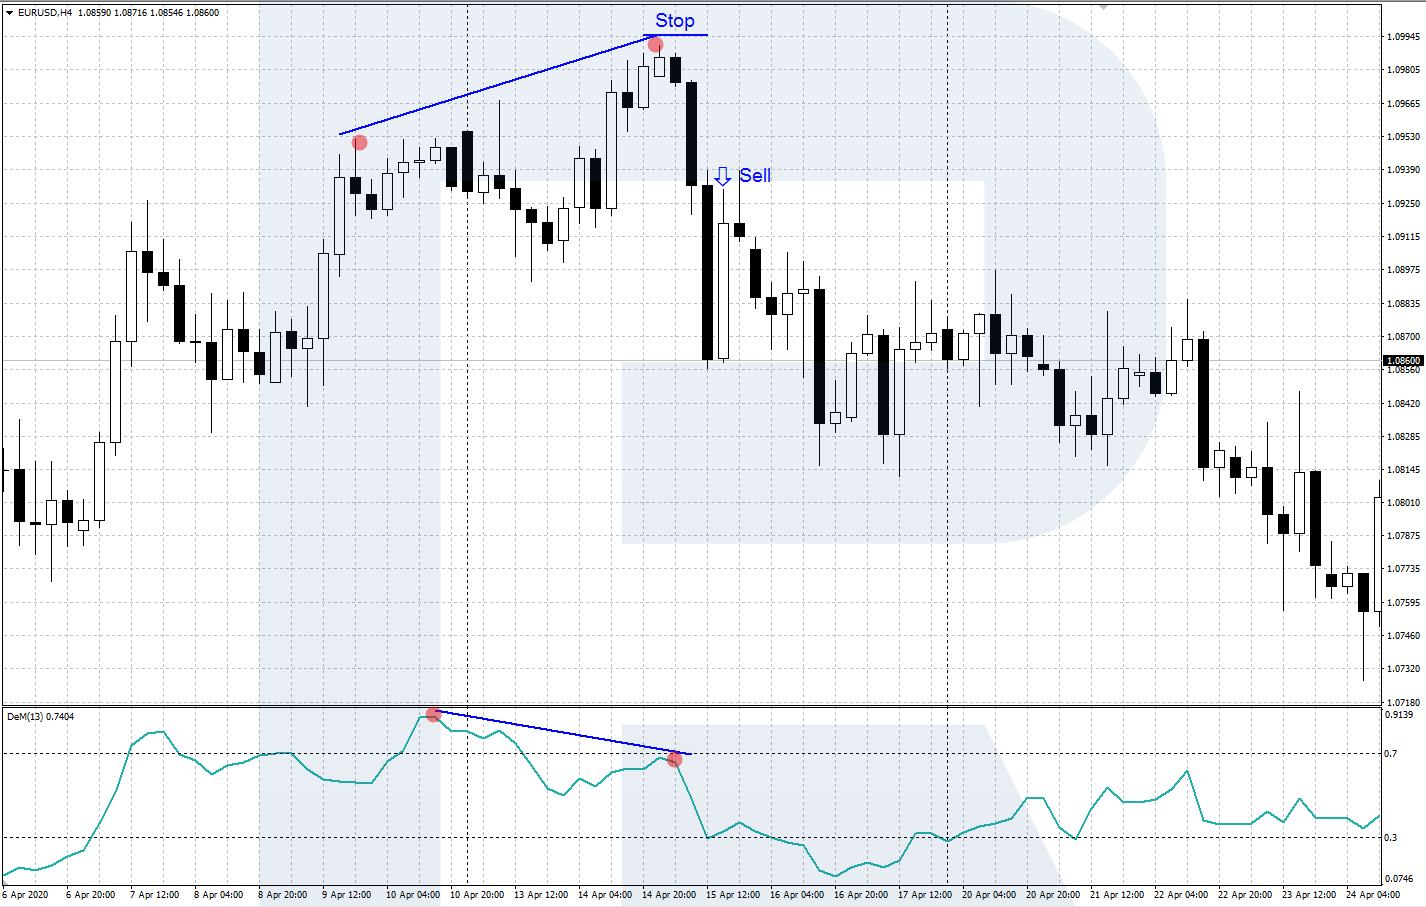
Signal to sell
A signal to sell (bearish divergence) appears when the price chart shows another high above the previous one, while the DeMarker line demonstrates a high lower than the previous one. This means the bears are accumulating strength, and a reversal downwards may follow. When the price chart reverses downwards, open a selling position with an SL behind the nearest high.
Closing thoughts
The DeMarker indicator is quite a good oscillator created by a famous trader Thomas DeMark. It helps to assess the current market situation and find an upcoming correction or a reversal on the price chart. In more detail, the indicators and trading methods by DeMark are described in his book “The New Science of Technical Analysis”.


