Trading the Alligator+Fractals Strategy

6 minutes for reading
Today, we will speak about one of the most popular Forex strategies called Alligator+Fractals. It was designed by a famous market psychologist and successful trader Bill Williams in the 20th century, however, it remains topical nowadays.
Alligator+Fractals belongs to trend strategies, which means it does not work in the times of a flat.
This strategy is multicurrency, however, observations show that it works better on instruments with a small spread, such as most basic currency pairs and metals. With high-volatile instruments, it may give false signals.
You may use any timeframe; however, on smaller ones, signals will be multiple but their quality may worsen. On H4 and longer timeframes, signals will demonstrate better quality but appear more rarely. A trade will be working off for several days if not weeks. The size of Stop Losses on large timeframes may exceed the size allowed by your risk management. However, the profit may be huge compared to the Stop Loss.
The Fractals and Alligator indicators: the base of the strategy
This strategy is based on two indicators designed by Bill Williams and included in most trading terminals by default:
- Fractals
- Alligator
Fractals indicator settings
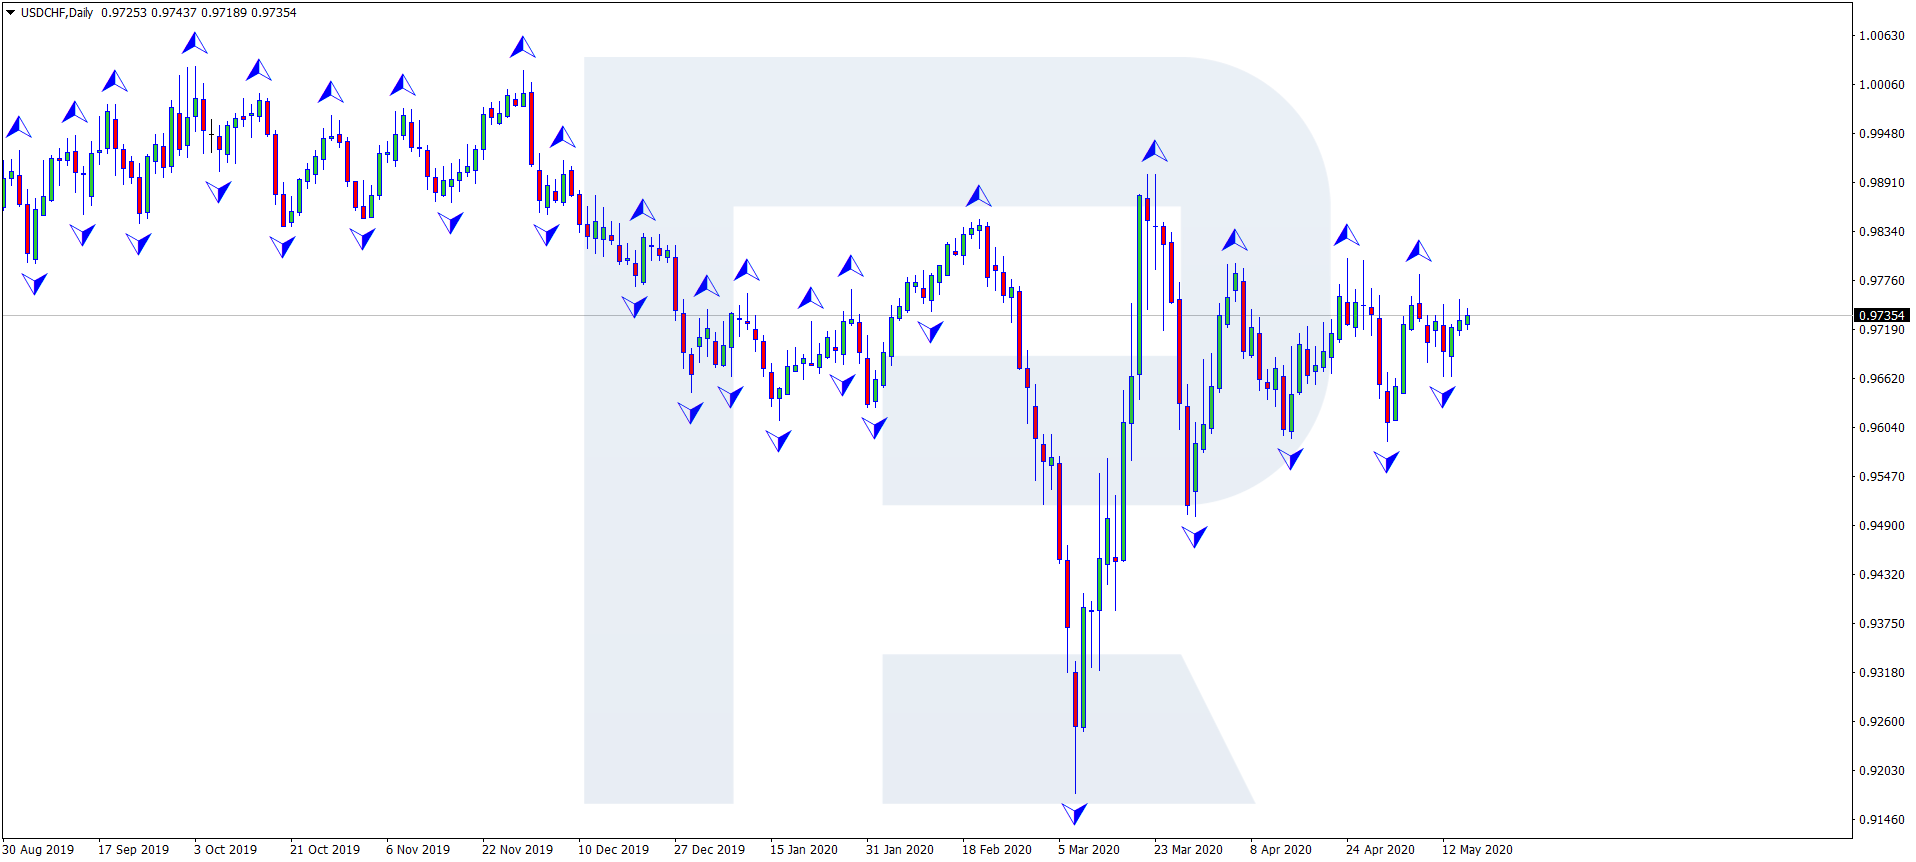
The Fractals indicator looks like an arrow above a Japanese candlestick or a bar and points at the price extreme. For a Fractal to appear, the following conditions are necessary:
- The highs of the two first candlesticks are increasing.
- The high of the third candlestick is higher than those of the preceding two candlesticks.
- The highs of the fourth and fifth candlesticks are decreasing gradually.
- If all the requirements are met, a fractal forms on the extreme.
In the settings, you may only change the color and the width of the line. Other parameters are set.


Alligator indicator settings
The Alligator indicator is the unity of Moving Averages with certain settings. Below, you may see what it looks like.
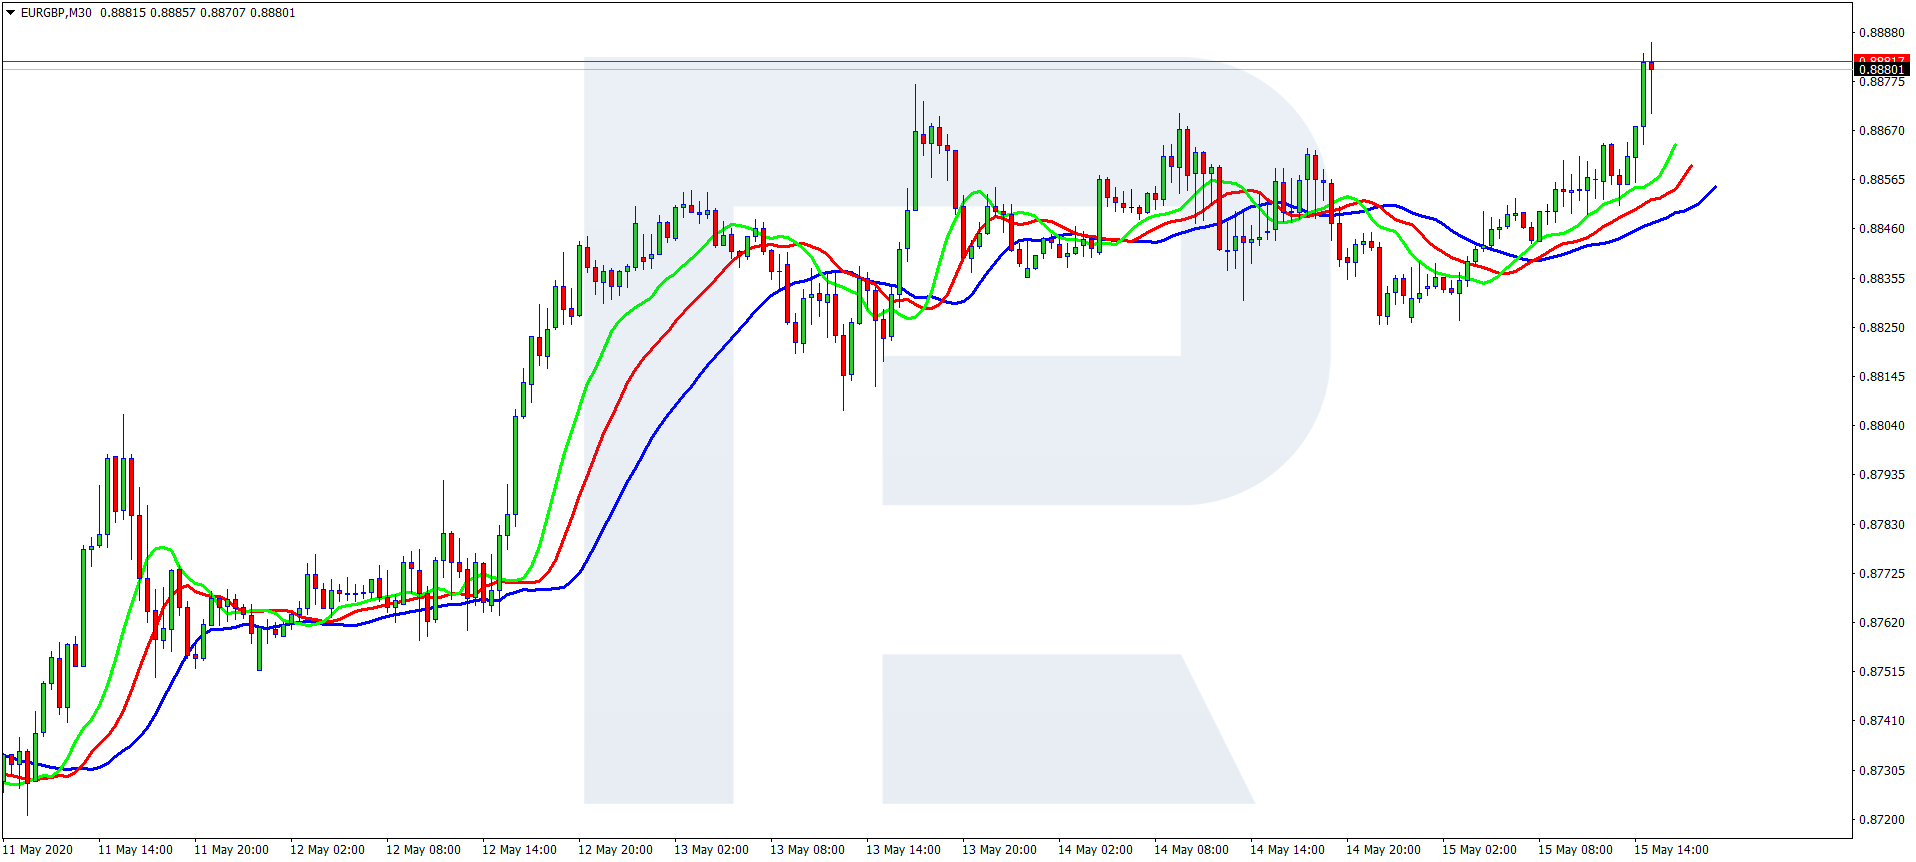
In the basic settings recommended by the author, three Moving Averages are marked different colors and have different settings and names:
- Fast Moving Average is colored green, called "Lips", and have the settings: period 5, shift 3.
- The Middle Moving Average is colored, called "Teeth", and have settings: period 8, shift 5.
- Slow Moving Averages colored blue, called "Jaw", and have settings: period 13, shift 8.
By default, the settings of the MAs are as follows:
- Calculation method: Smoothed
- Applied to: Median Priсe (HL/2)
The color, width, and the periods of the MAs are set by default but can always be customized.
Alligator+Fractals trading rules
Now, let us figure out how to use this strategy and when to open positions. As long as this is a trend strategy, it does not give any signals in flats. However, this is going to be even helpful.
Opening a buying trade
Our task is to catch the moment when the Alligator is in a flat (sleeping) and the three MAs are intertwining. Meanwhile, Fractals will form both above and below the Alligator.
The strategy initially includes the principle that some time after a flat or consolidation of the price a mighty trend movement happens, and the price starts growing or declining. This is the purpose of the strategy - catching a large directed movement, or a trend.
Then wait for the price to start moving in either direction so that the Alligator begins to wake up (the MAs start moving in the direction of the trend).
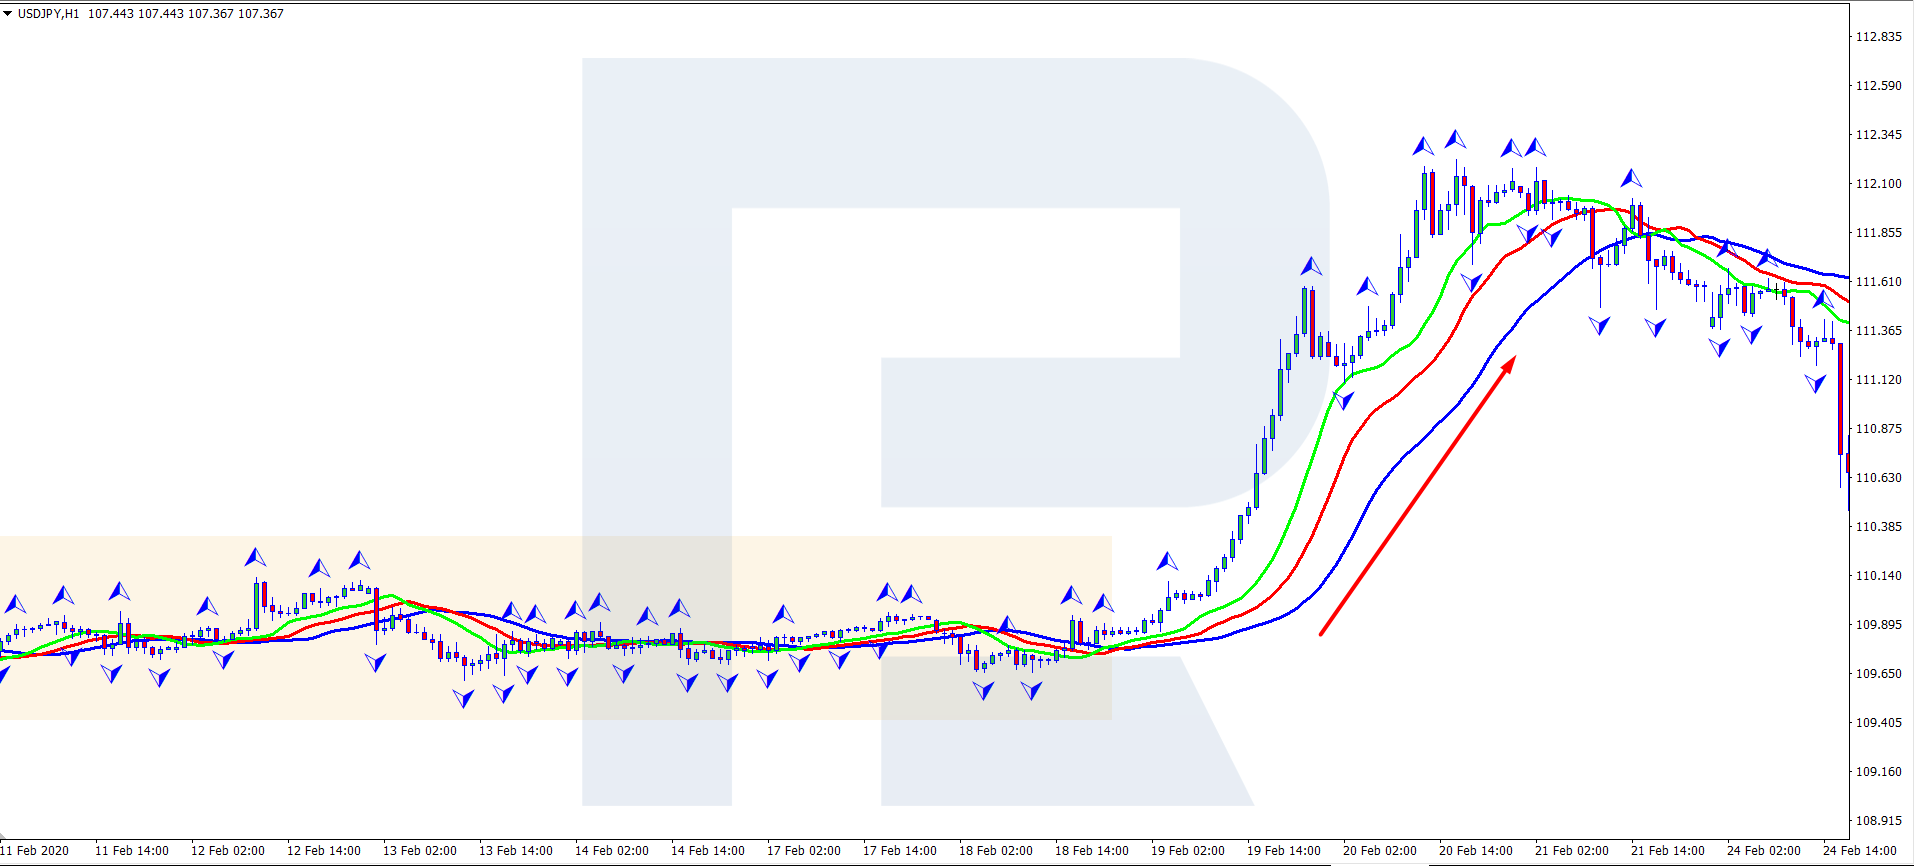
Keep a close eye on the last two Fractals: they will show us the entry point to the trade. In the picture below, we may see that the Alligator is waking up and starting to move upwards.
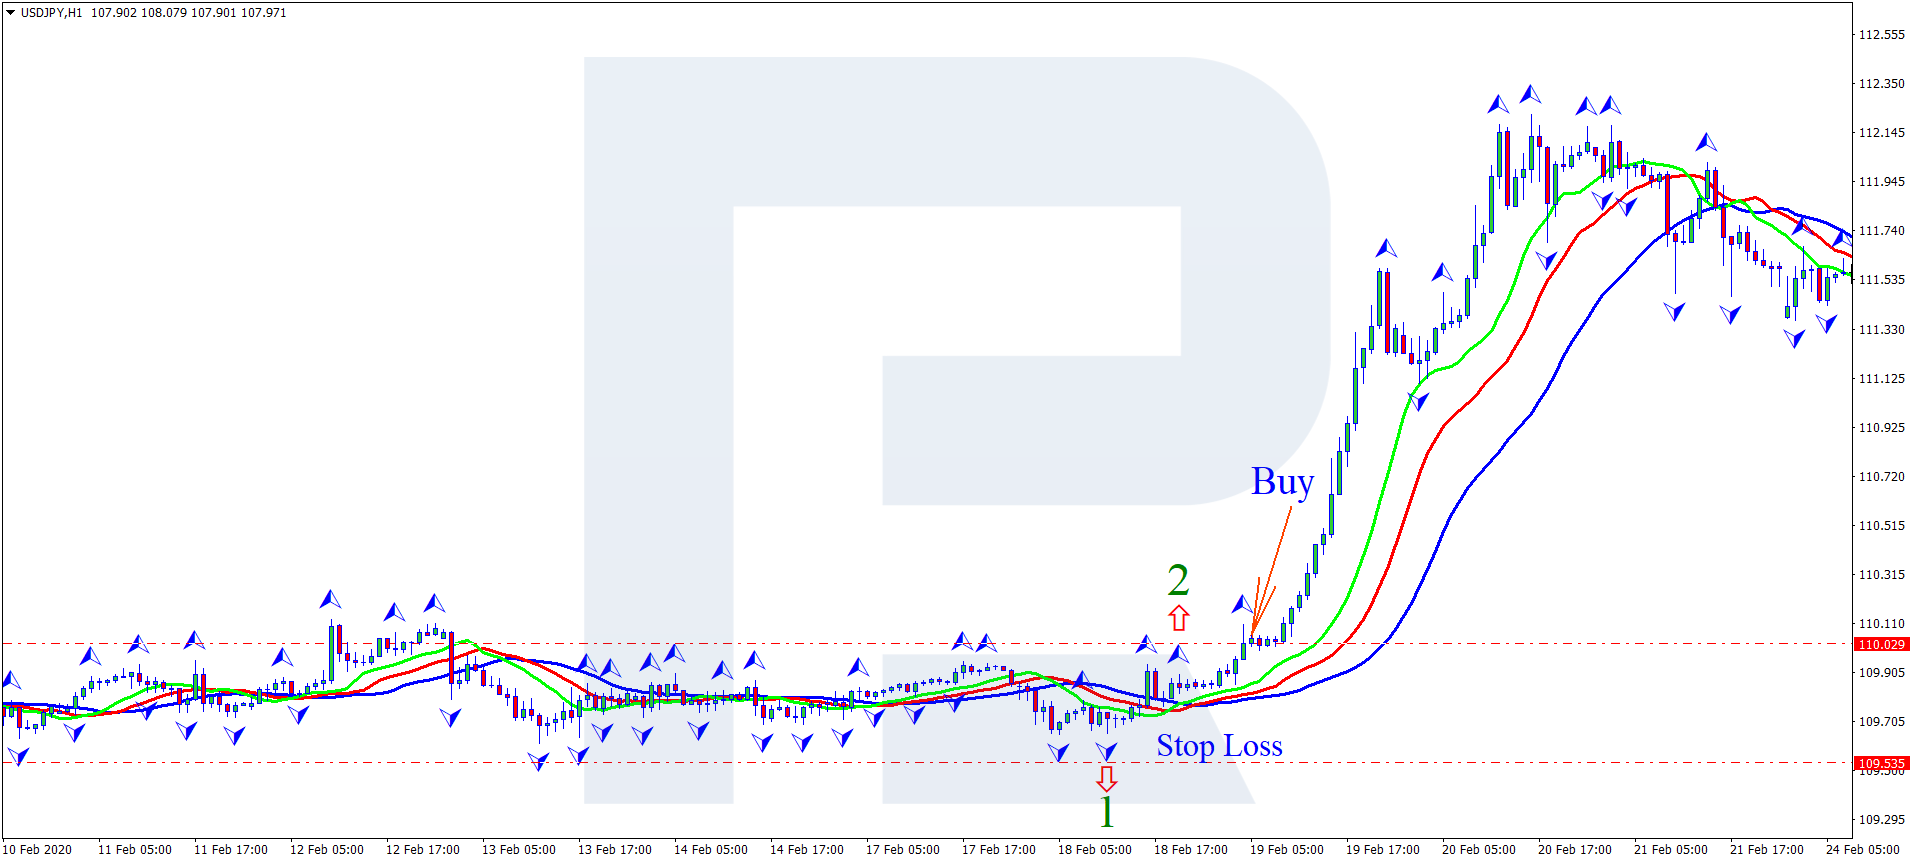
The line called Lips crosses the Teeth and Jaws from below. The last fractal (let us call it "valid") formed at the top (marked as 2) shows the entry point to the trade. A breakaway of the high of the valid fractal will signal to enter the market. The perfect moment is when the current price broke away the high and the candlestick closed above the fractal. Then place a Stop Loss: for this, use the last downward fractal (marked 1 in the picture). As we see, the level for the SL is the nearest low.
Then - to the potential profit.
How to place a Take Profit
- The potential loss-to-profit ratio should be 1:3 (3 points of profit per 1 point of loss).
- Use the nearest resistance level as the potential aim for the growth of the price.
- Do not place a Take Profit, instead, monitor your open position using Trailing Stop.
- Wait for the signal to sell from the Alligator: the green Lips line must cross the two remaining ones.
Opening a selling trade
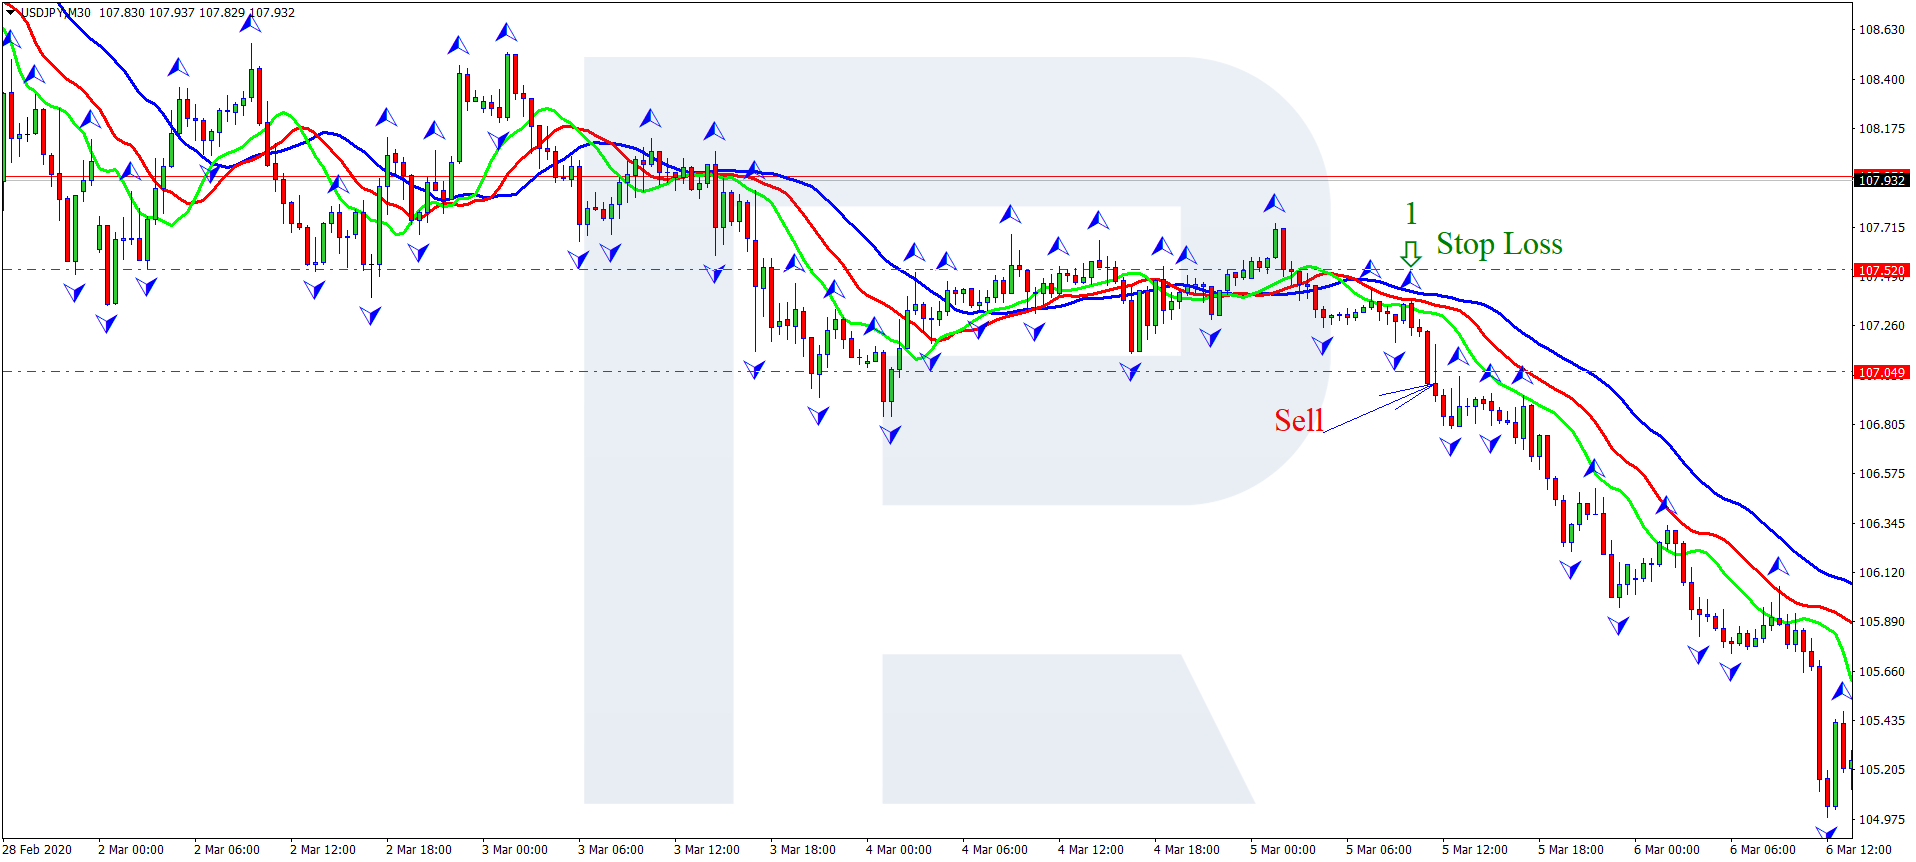
There is a flat in the market. The Alligator lines intertwine, and Fractals form above and below the MAs. After the flat, the market starts moving downwards, the Alligator wakes up and opens its mouth. The green Lips line crosses the Teeth and Jaw from above. Wait for the price to break away the low of the last valid Fractal looking down and the price to close. Then open a selling position with an SL behind the last upward Fractal (marked 1 in the picture). Then wait for the trading situation to develop.
Take Profit options will be the same as for a buying trade.
Important notes for finding an entry point
- The candlestick carrying the valid Fractal must not touch the Alligator lines. If it does touch them, the Fractal is considered invalid and the signal is skipped.
- For a buying trade, the price chart must be above the Alligator.
- For a selling trade, the price chart must be below the Alligator.
Closing thoughts
Regardless of being simple, the strategy has certain peculiarities that must not be ignored. The use on short timeframes (M1, M5) gives a lot of false signals. Optimal charts for trading are M30, H1, and sometimes H4. If you comply with all the rules of entering a trade by this strategy, you can enter the trade at the very birth of a trend and gather almost all the momentum as your profit.


