How to Trade Overbought and Oversold Areas?

7 minutes for reading
In this review, we will discuss trading overbought and oversold areas. A trader may use special indicators that analyze the dynamics of price changes and show the overbought and oversold areas.
What are overbought and oversold areas?
The notions "overbought" and "oversold areas" in financial markets indicate short-term fluctuations of the instrument values from the average. These terms say that the price has gone quite far in a certain direction. An overbought state of the market means that the price of a financial instrument has gone too high, while the oversold state means it is too low.
An overbought state is a significant increase in the price (in percent) in a short time or a lengthy series of several days in an uptrend. For example, oil price may become overbought if it leaps by 10-15% during two or three days or demonstrates pullback-free growth for several days.
As a result of being overbought, the price forms new local highs on the chart. After the bulls have pushed the price rather high, making the asset overbought, a correction downwards may follow at any moment.
When an instrument is oversold, local lows form on the chart. This means the bears have pushed the rate rather low, and an upward correction may start at any moment.
Specially designed trading indicators may help the trader catch the overbought or oversold state of some asset. For this, an indicator has its window split in two areas: the overbought and oversold areas. Getting into those zones, indicators characterize the current financial situation of the instrument (whether it is overbought or oversold) and give certain trading signals.
Popular indicators for trading in the overbought and oversold areas
Presently, there exist plenty of indicators that help define the overbought and oversold areas. Let us discuss briefly three of the most popular indicators (built in many trading platforms):
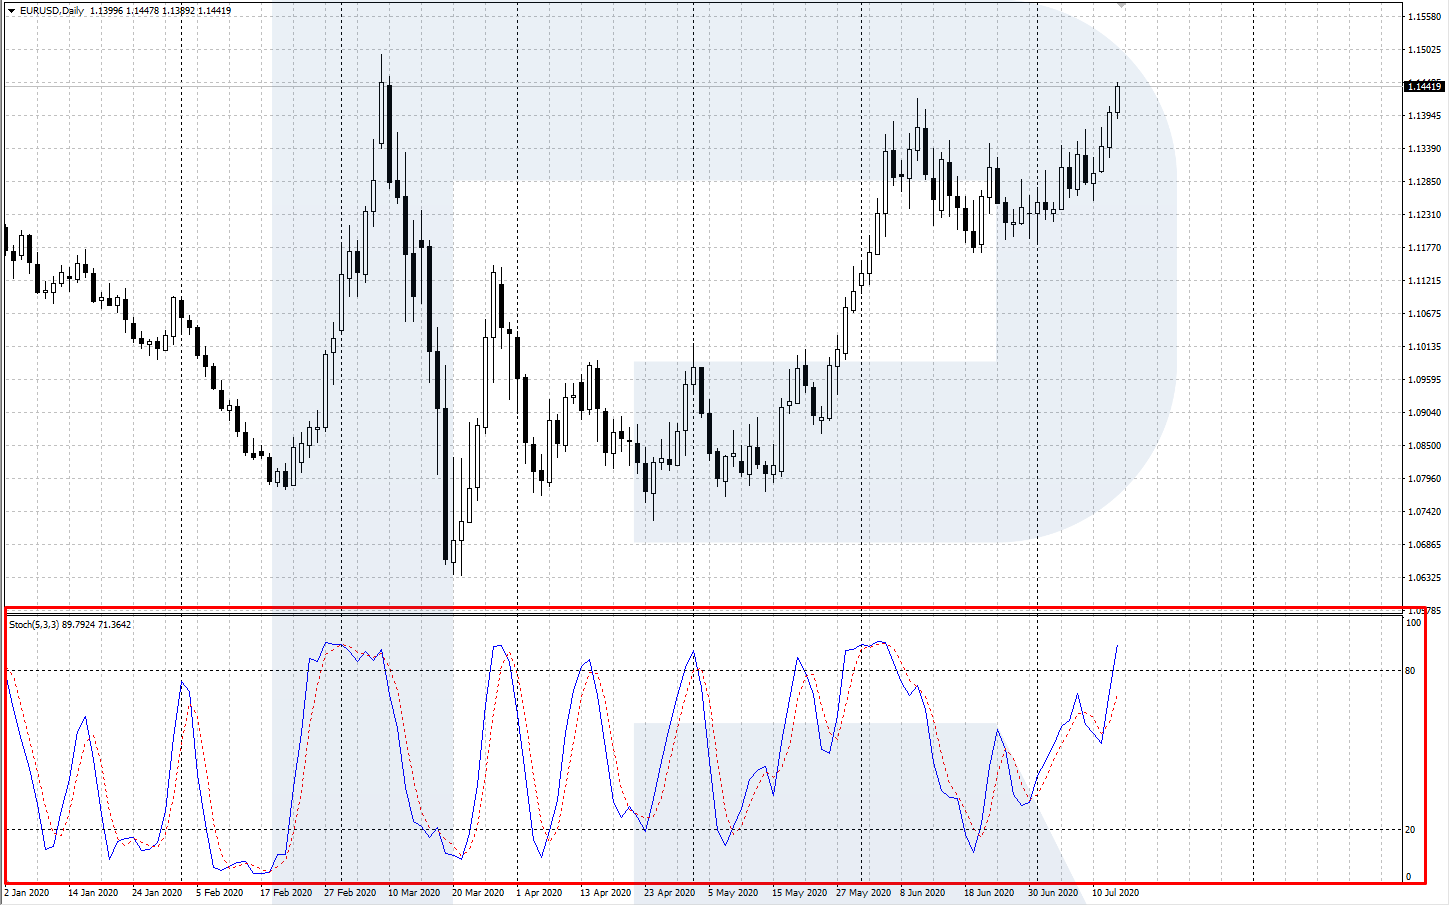
Stochastic Oscillator
The creator and greatest fan of this indicator is a popular stock trader George Lane. The Stochastic is an oscillator that demonstrates the current position of the price in % of the previous price range. The Stochastic evaluates the ability of the bulls and bears to close the price at the achieved extremes.
The Stochastic Oscillator is drawn in a separate window under the price chart and consists of two main lines: %K, the fast line, and %D, the slow line. The indicator values vary from 0 to 100%; through the levels of 20 and 80%, signal lines are drawn, singling out the oversold (0-20%) and overbought (80-100%) areas.
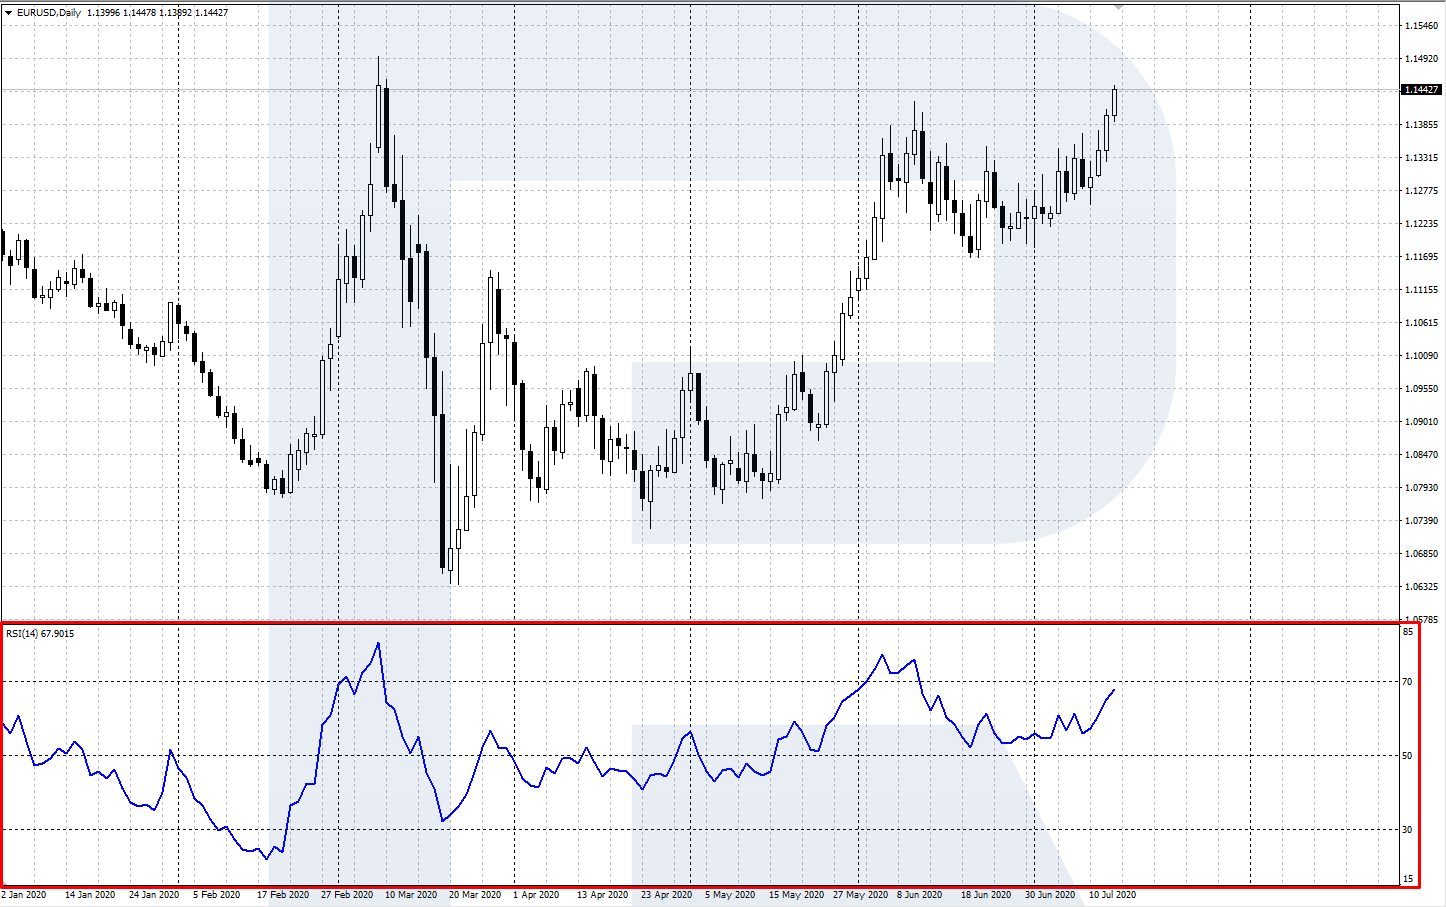
Relative Strength Index (RSI)
This index pertains to the group of oscillators. It was created and propelled by J. Welles Wilder. The RSI assesses the position and dynamics of the current price related to the preceding period. The RSI is calculated in a separate window under the price chart.
The RSI has three signal levels: 30, 50, and 70. The area above 70 is called the overbought area, where you should sell. The area below 30 is the oversold area, where you should buy. If there is a prominent directed trend in the market, use signals along with the trend only.
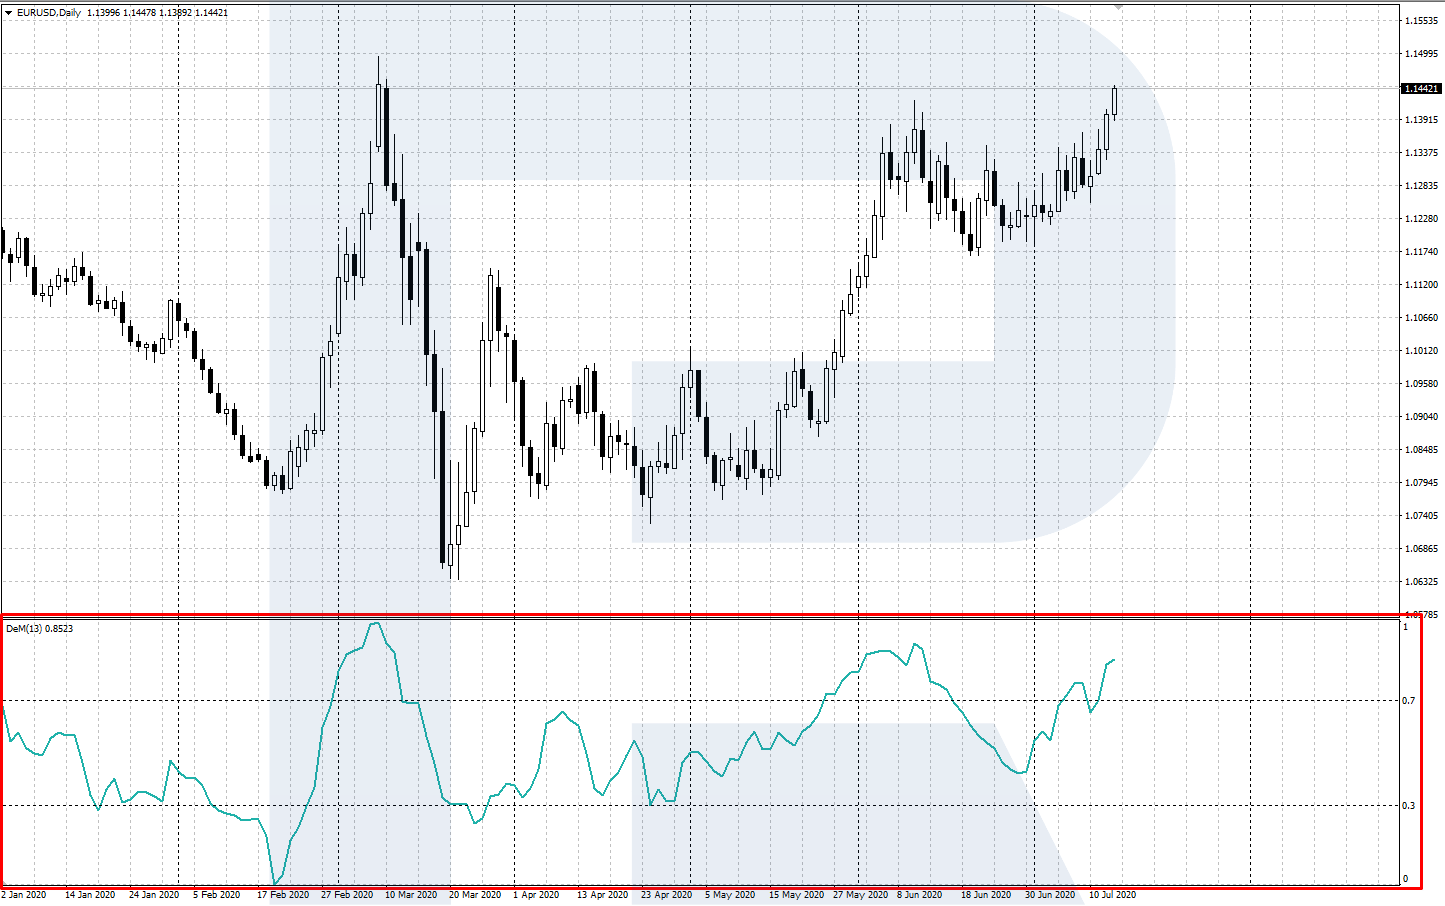
DeMarker
The DeMarker indicator was created by an expert in stock trading (and a creator of many other indicators) Thomas DeMark. The peculiarity of the indicator is its paying attention not to closing prices (as many other oscillators) but midterm highs and lows. The calculation method consists of comparing the current highs and lows to the extremes of the preceding period.
DeMarker is calculated in a separate window under the price chart and consists of one main line which fluctuates within the range of 0 and 1. The area above 0.7 is called overbought where the price may form a reversal downwards. The area below 0.3 is called oversold where you might buy.
The strategy of trading the overbought and oversold areas
The strategy of trading the overbought and oversold areas seems simple at first glance: sell in the overbought area and buy in the oversold one. However, there is one thing to account for: the current trend. Indeed, the general rule of tech analysis is: trade the trend.
If the market is in a range, you may trade overbought and oversold areas in either direction. However, if an up- or downtrend is pronounced, better trade the trend.
Nonetheless, most often, signals in the areas appear to counter the trend, and it is up to you completely whether to trade them or not. As for me, I prefer to wait for a correction and trade the trend.
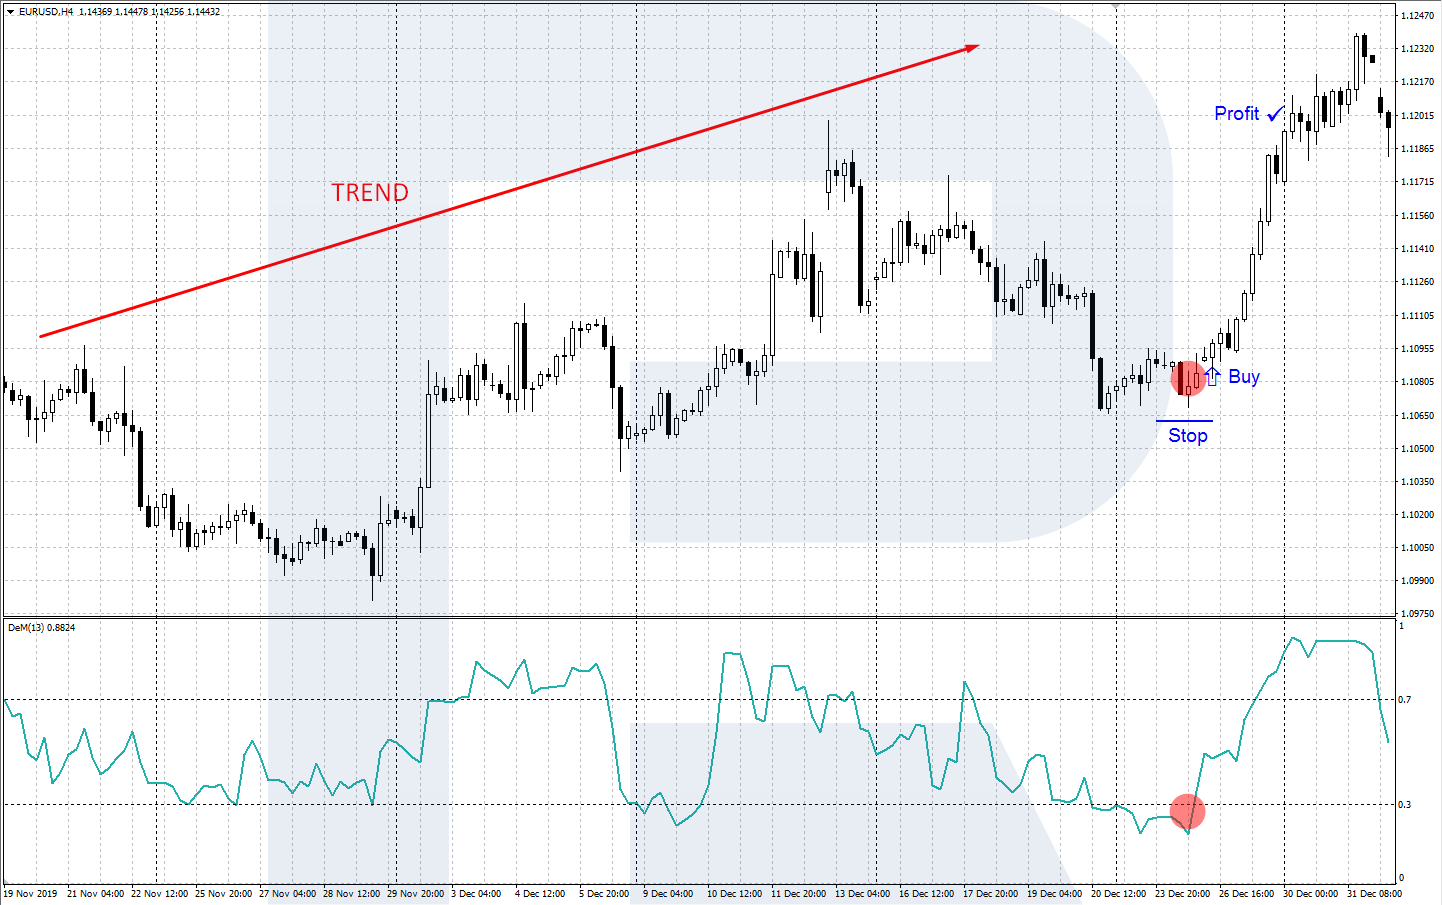
Buying in the oversold area
Look for signals to buy in an uptrend or a flat. If there is a clear uptrend, wait for the beginning of a downwards correction. Wait for the indicator (Stochastic, RSI, DeMarker, or any other) to enter the oversold area and start reversing upwards; on the chart, a local low will form.
Open a buying position. Place a Stop Loss behind the formed local low. The first goal for the Take Profit will be the previous high on the chart; if it is broken away, the quotations may grow further.
Selling in the overbought area
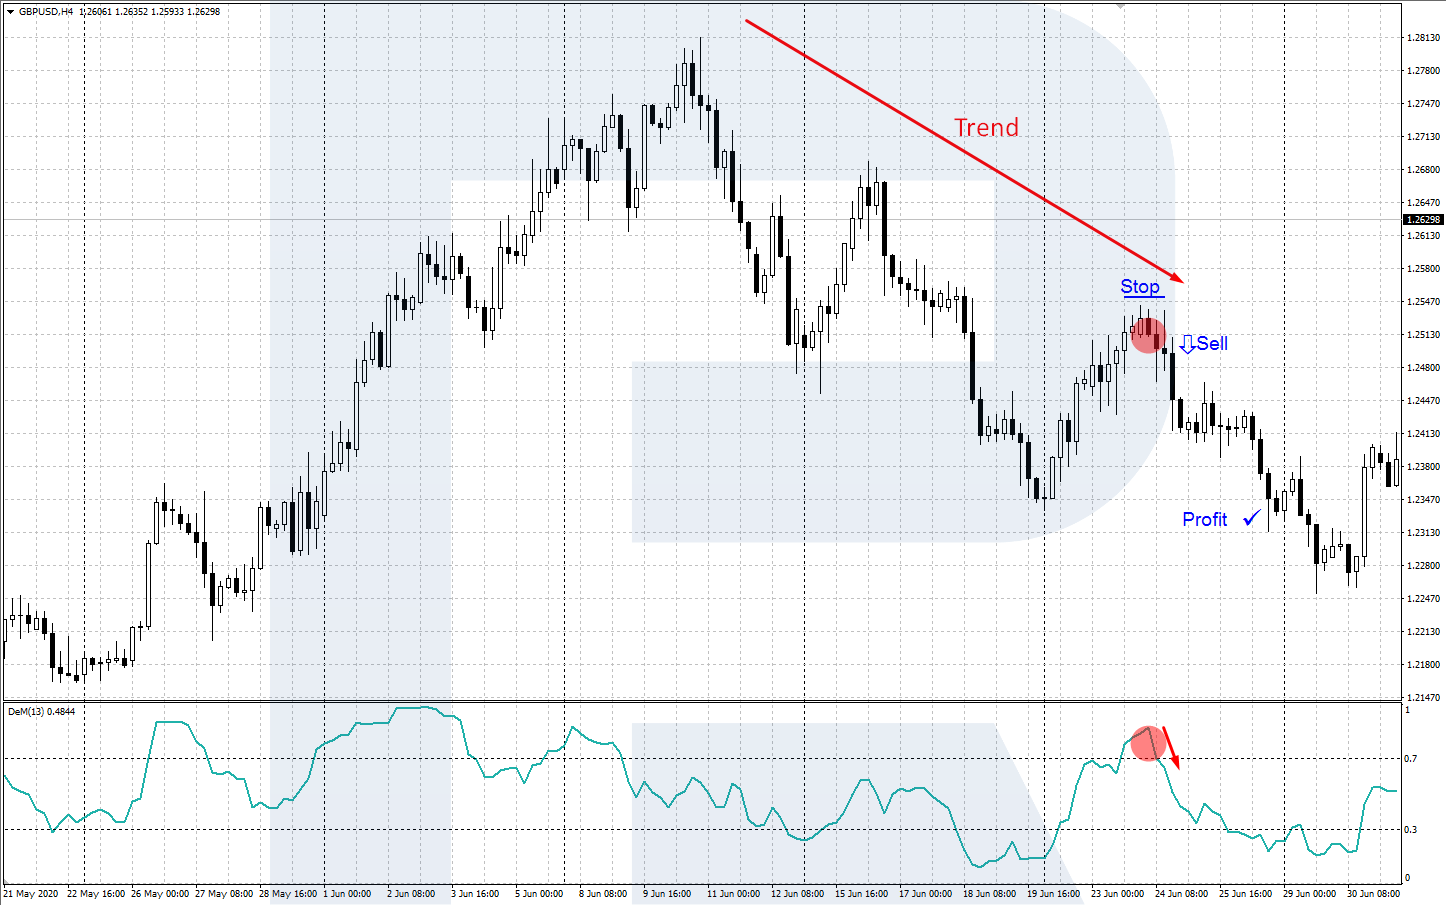
Trade signals to sell in a downtrend or a flat. The course of action is as above:
- Wait for the price to correct upwards in the current downtrend.
- Get the signal of the indicator (Stochastic, RSI, DeMarker, etc.) in the overbought area. On the price chart, a local high will form.
- Open a selling trade with an SL behind the formed local high and the TP - at the previous low on the price chart.
Bottom line
Trading the overbought and oversold areas is quite popular among traders. There are plenty of indicators and original trading strategies by famous traders meant for detecting those areas.
To my mind, such trading is most efficient combined with tech analysis when you choose trades thoroughly, mostly along with the current trend.


