Double & Triple Top, Double & Triple Bottom Patterns: How to Use in Forex?

6 minutes for reading
Today, we will discuss popular and rather widespread patterns of graphic analysis Double Top, Triple Top and its opposite – Double Bottom, Triple Bottom.
As we can deduct from the name, these patterns form either at the top or bottom of a trend. Meanwhile, data shows that they can be encountered on all timeframes and chart types (Japanese candlesticks, bars, linear charts). The only difference timeframe-wise is the time that it takes the pattern to form and the time it takes the signal to work off.
These patterns belong to the reversal category – this means that the work-off of the signal normally leads to the reversal of the current trend or, at least, to a deep correction of the price.
Now let us discuss these technical analysis patterns more scrupulously and learn to use them in trading.


Formation rules of the Double & Triple Tops, Double & Triple Bottom patterns
Let us get started with the formation principles of the patterns.
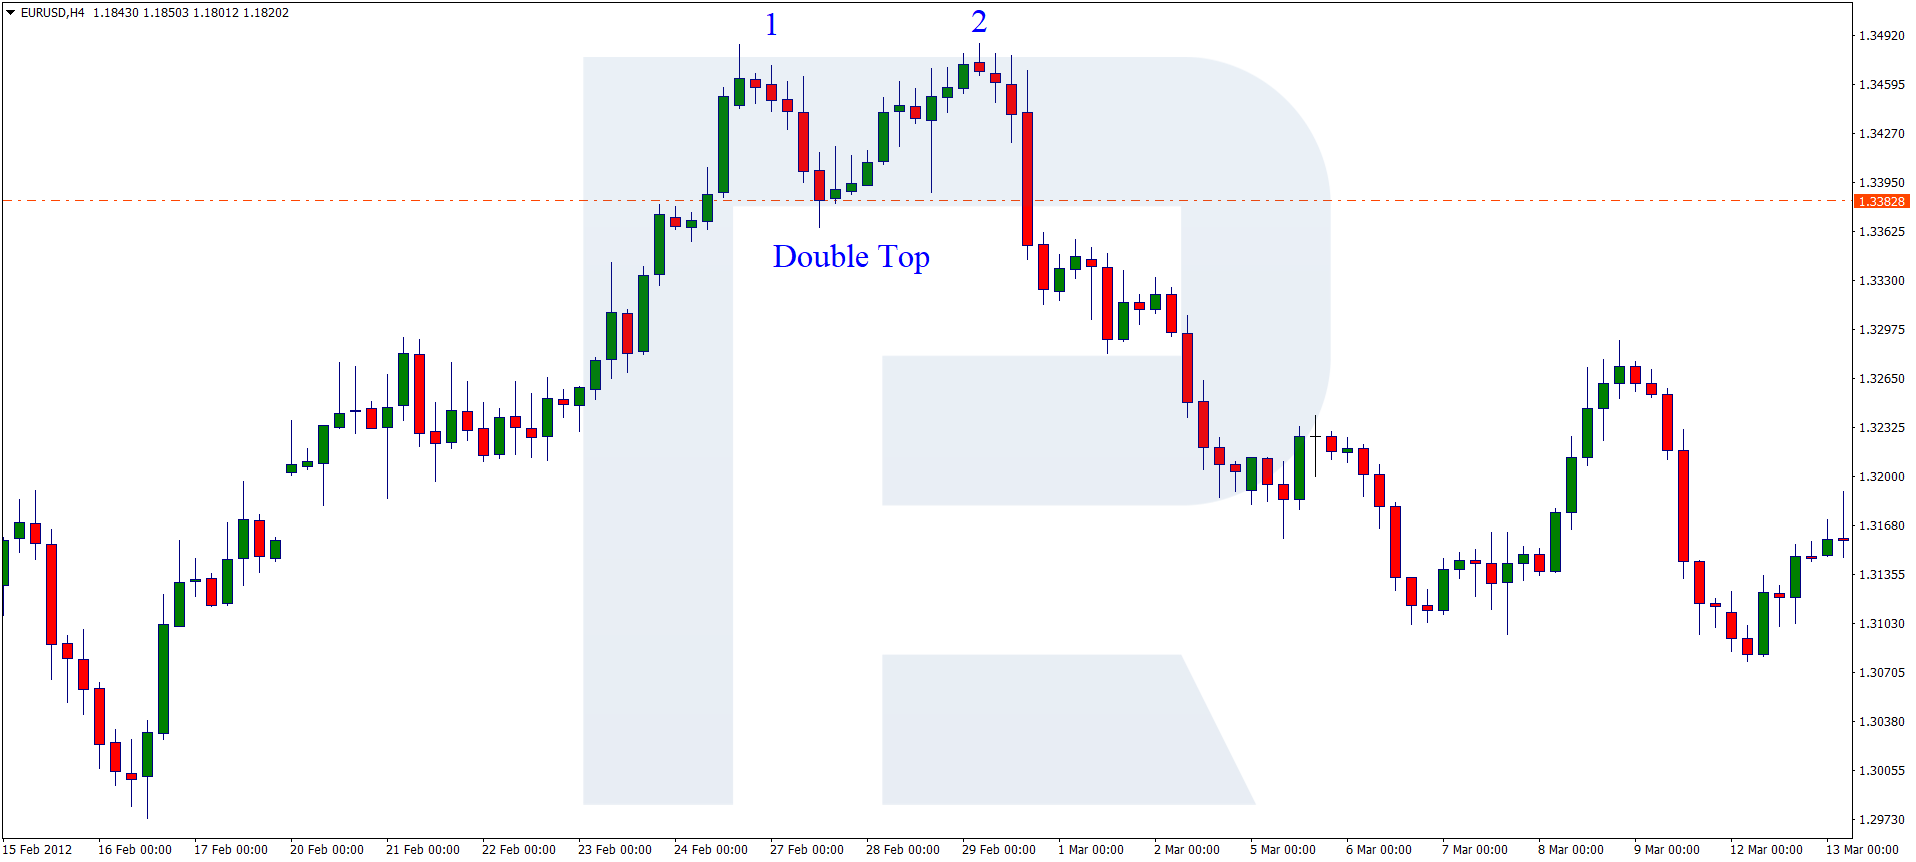
Double Top
A Double Top usually forms at the peak of an uptrend. The larger the timeframe, the more reliable the pattern (this is relevant for all patterns discussed in this article). At the same time, the signal can work off on any timeframe, including M1, M5, etc.
A Double Top pattern looks like two highs formed one after the other. Theoretically, buyers drive the price to the high, and then a part of them starts to lock their positions, thus decreasing the quotations. At this moment, some latecomers cut in, lifting the price to the same high.
The two peaks do not need to be equal, point to point, but they need to look like two mountain tops. Then the first buyers start taking profits, the price starts declining, and the second wave has nothing to do but to close positions with a loss or a minimal profit.
As a result, the quotations drop, and the actual trend changes direction. The support level in this case is the low formed between the two bottoms. This is the starting point for trading and calculating the potential of the trade. We will talk about entry points a bit later.
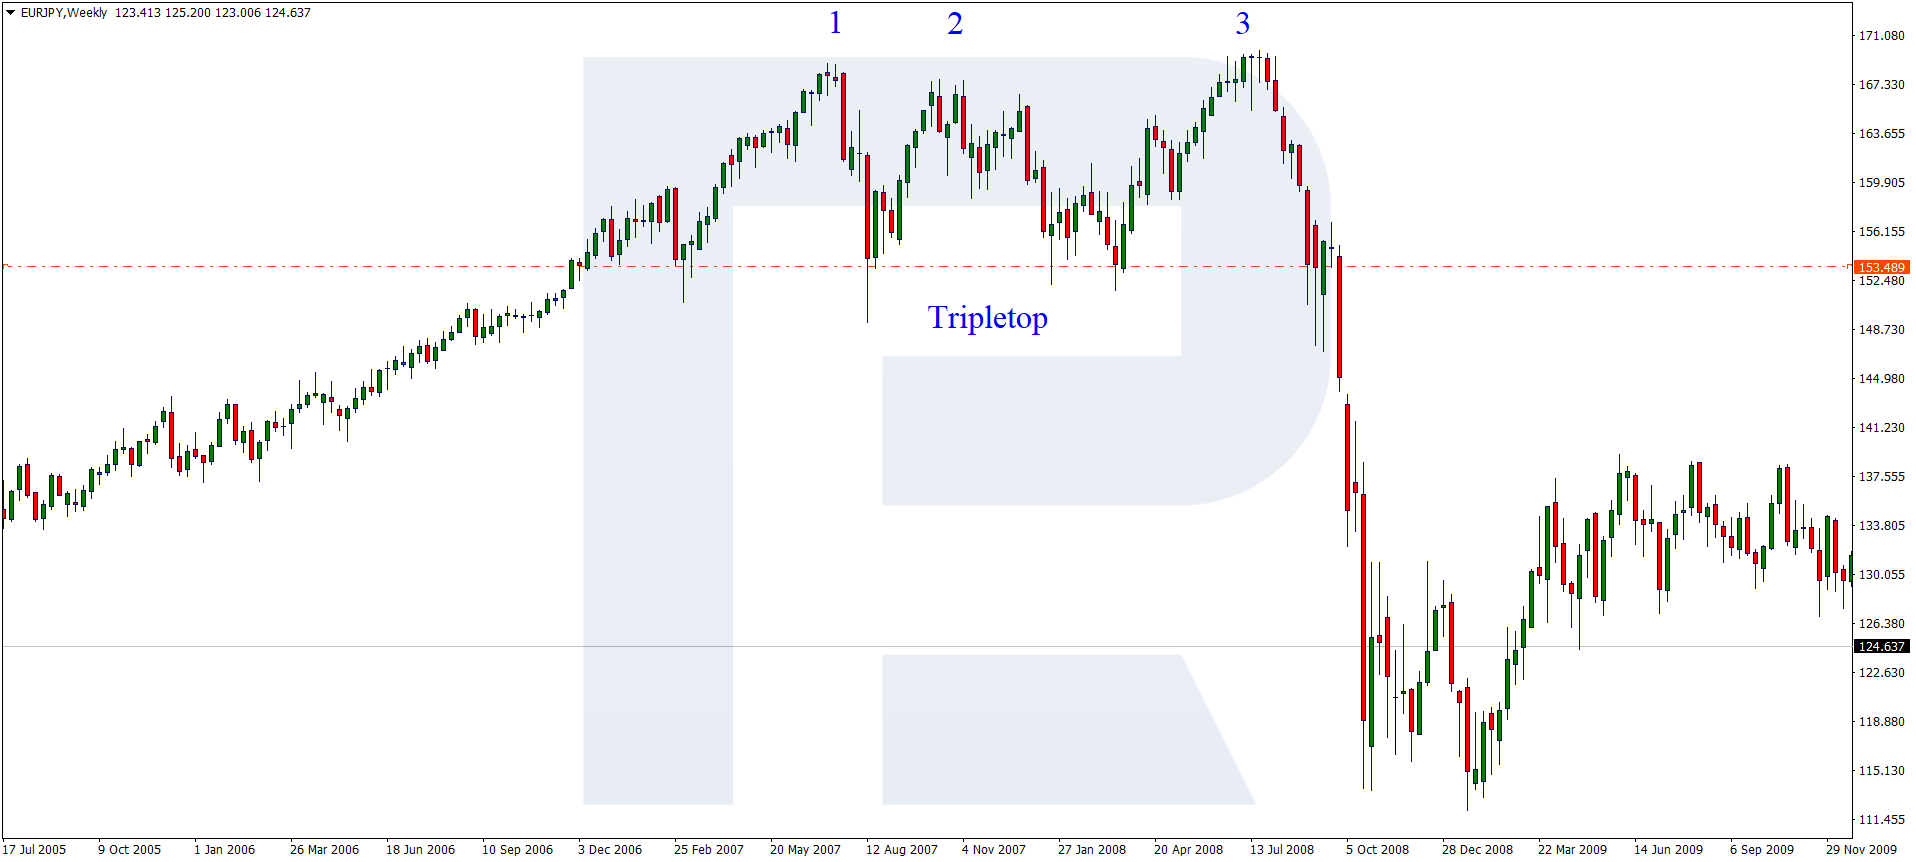
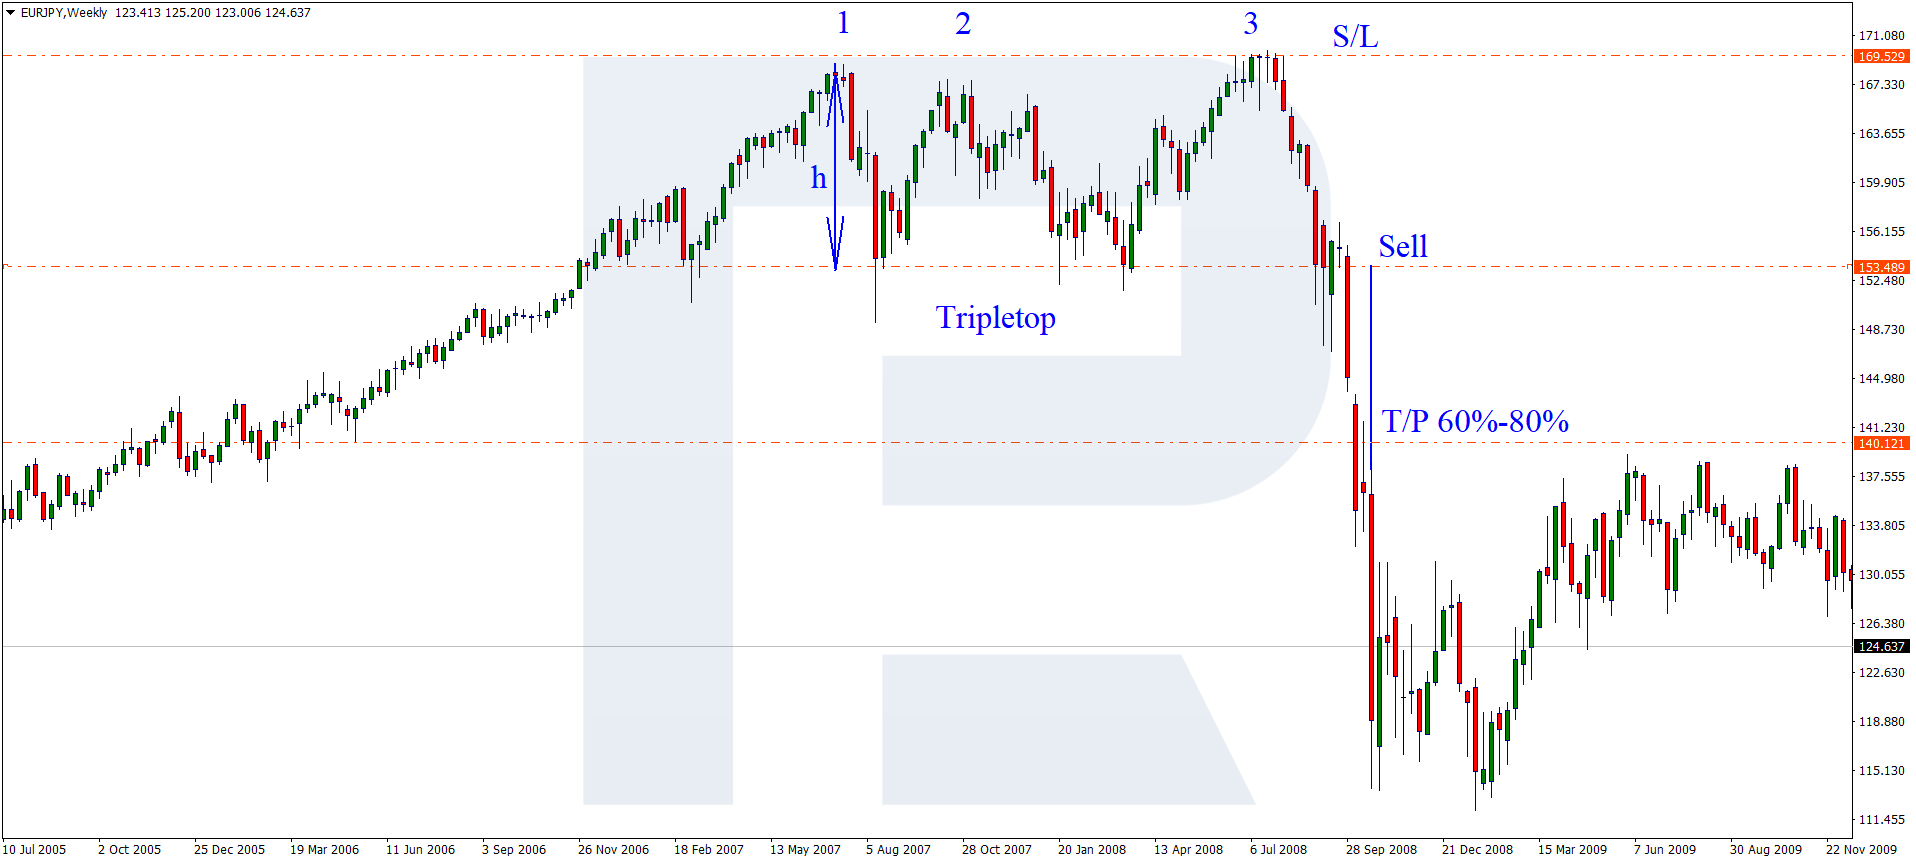
Triple Top
A Triple Top is a slightly modified Double Top. In practice, it forms the following way: after the first two tops form, another group of buyers enters the market hoping for further growth of the price. Indeed, at that moment the quotations do rise to a high and even may renew the previous highs, but this is it.
The first wave of buyers has a larger critical mass (has more buying positions open), due to which the quotations start to decline at the closing of the positions, test the support level and then, breaking the uptrend, form a downtrend. Looking at the charts on history, we may note that this does not necessarily happen, and the trend may reverse without special patterns.
Double Bottom
A Double Bottom reflects the Double Top mirror-like. It looks like two subsequent lows with a small gap in-between.
It forms as follows: sellers rule the market and push the price downwards, but when it reaches the bottom some sellers of the first wave close their remaining positions, and the quotations start to grow.
The resistance level, in this case, is the high between the two lows. Reaching the resistance level, the price breaks it away, and the trend changes direction. The first wave of sellers takes the profit, and the second wave, realizing that they have just been somewhat used, closes positions with a loss. Thus the quotations start to grow almost at once.

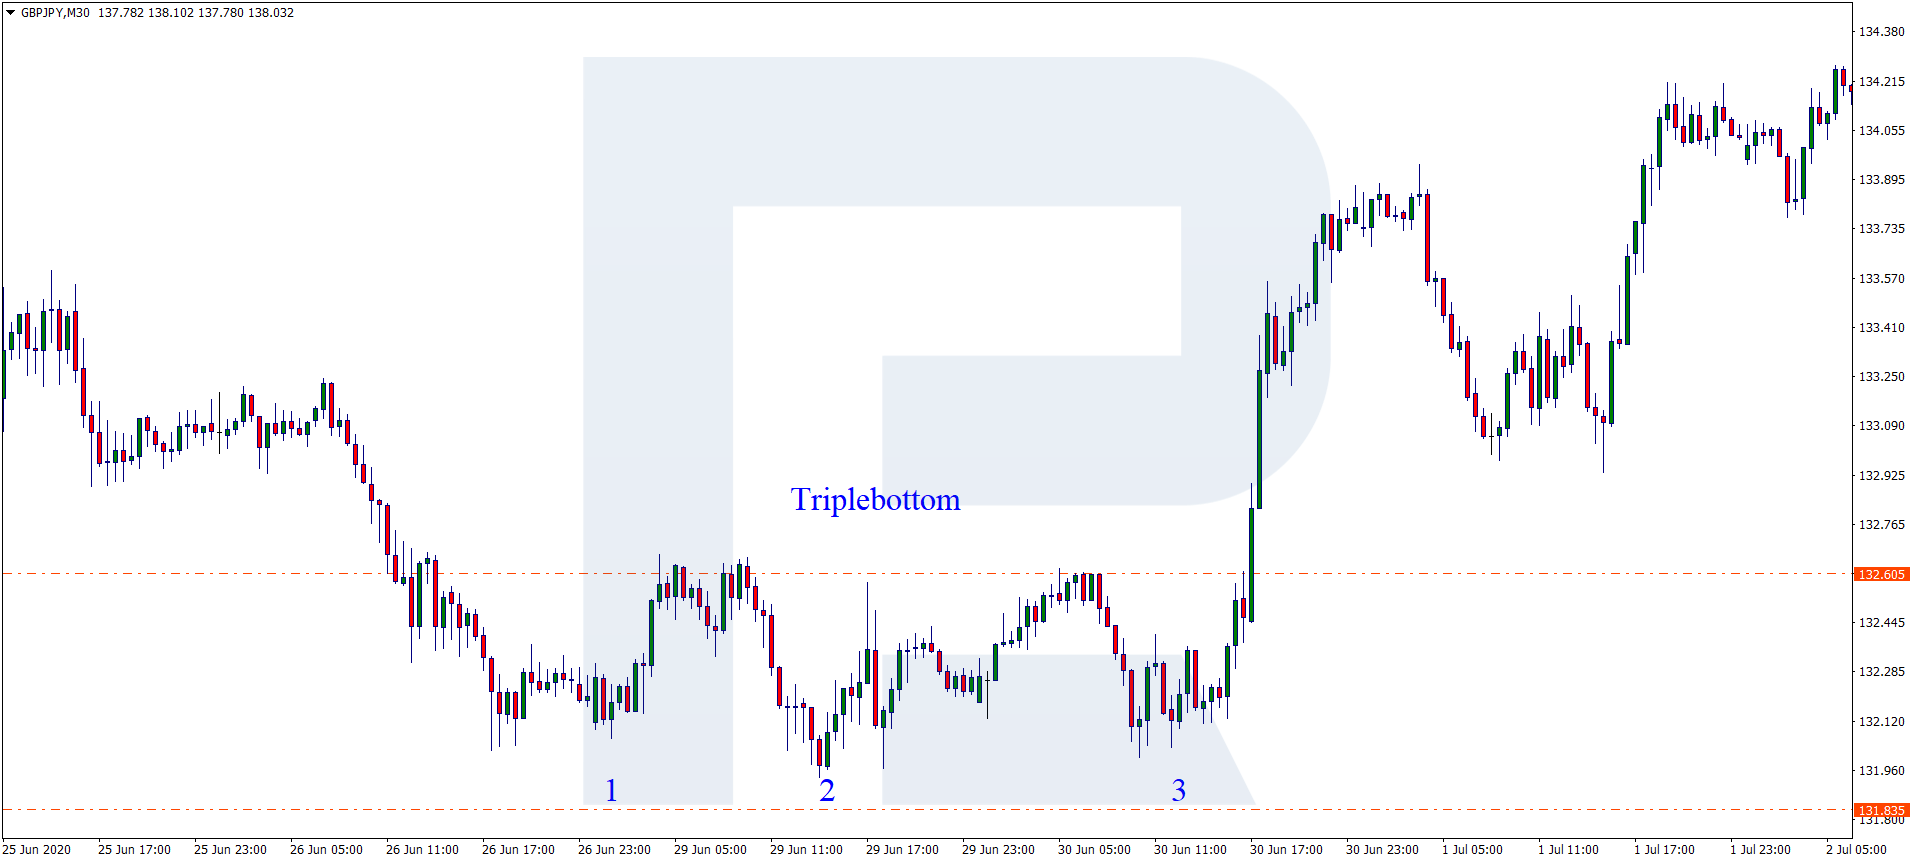
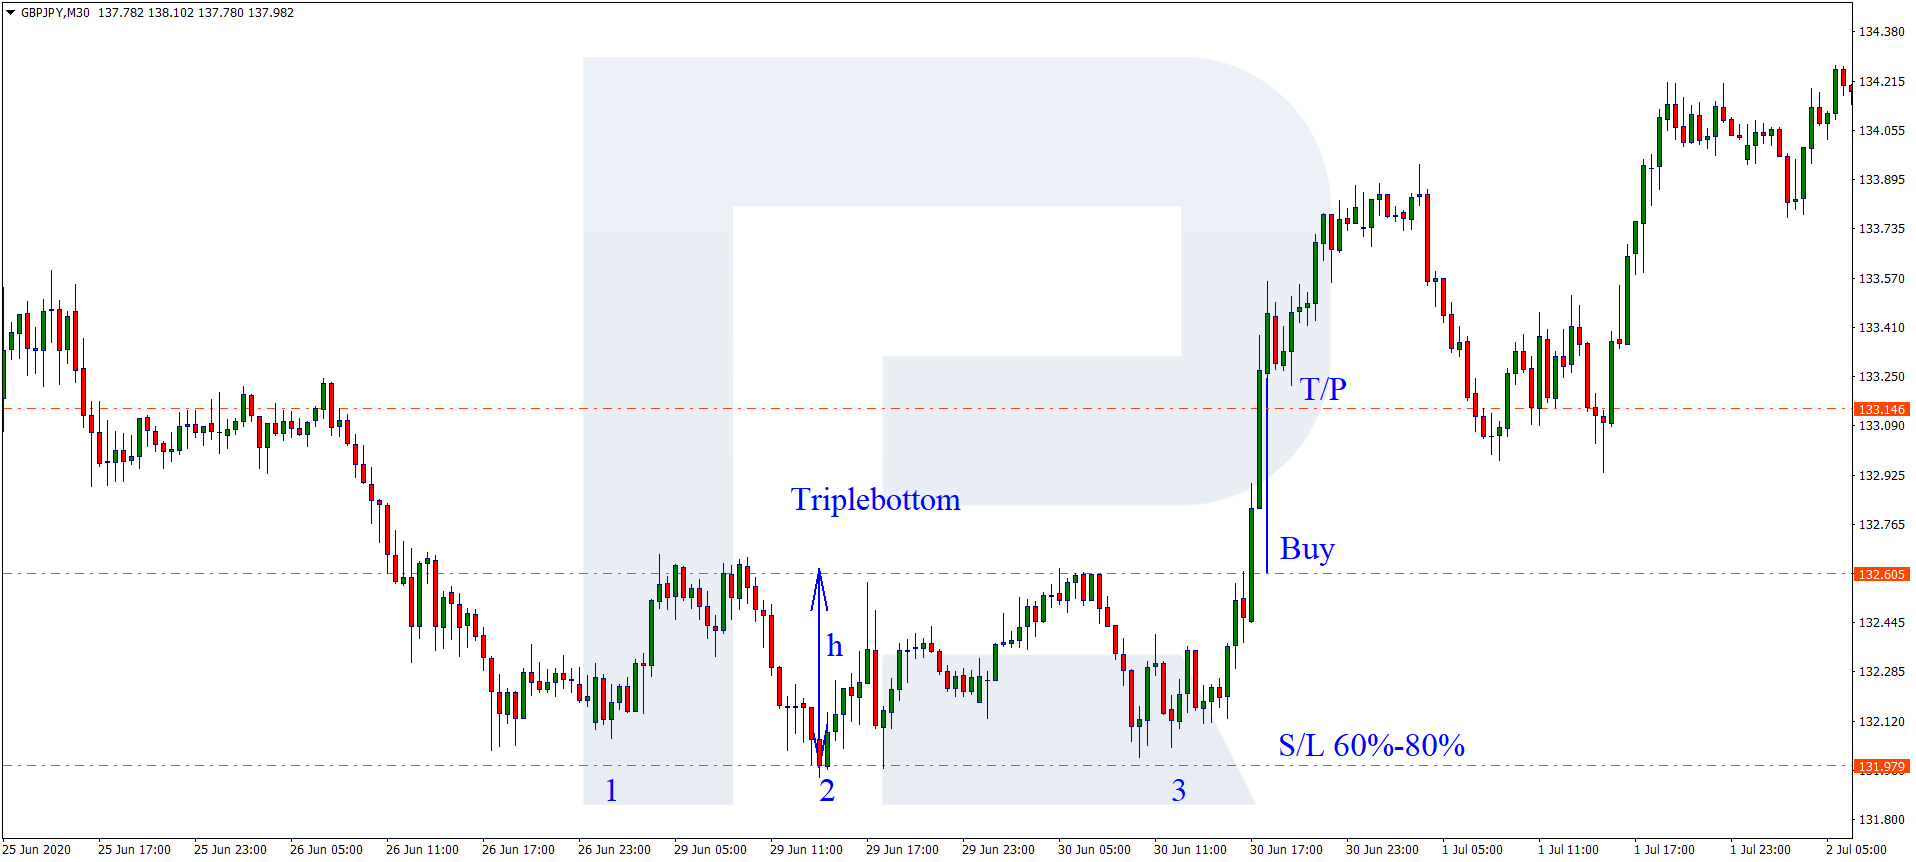
Triple Bottom
The Triple Bottom forms in a way, similar to the Triple Top. After the first bottom forms, a new group of sellers cuts in trying to make a profit on the decline but their trade volume turns out insufficient, and the price starts to grow.
When the price reaches the resistance level, the traders of the second and third waves normally have a loss on their open positions, and they have nothing else to do but to close them. As a result, the quotations test the resistance level, start growing and change the trend.


How to trade Double Top & Double Bottom patterns?
Now we only need to discuss entering trades by these patterns.
Double Top
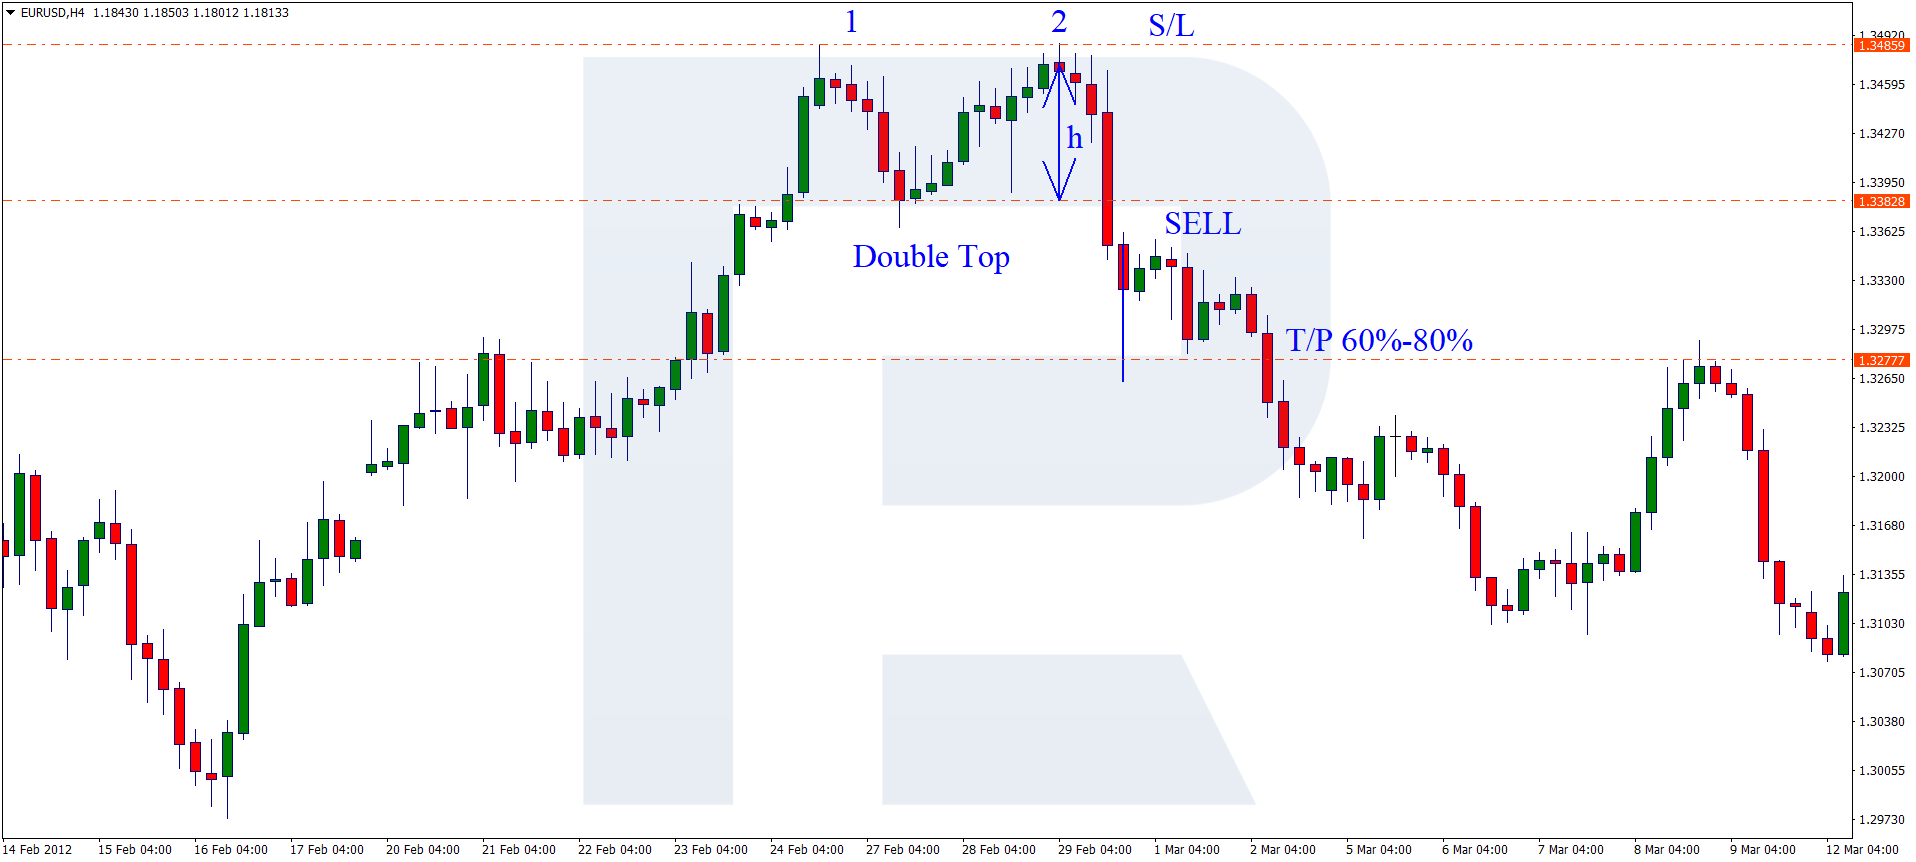
As long as the pattern means a reversal of the uptrend, we open selling trades. Aggressive traders may open positions at the formation of the second top, which, to my mind, is not always wise, being risky.
Conservative trading is a more suitable option. We sell after the price breaks away the support level; it will be perfect if the price closes under this level. In this case, chances are that the pattern starts working off, and there will be no third wave of buyers.
Place a Stop Loss behind the pattern high. Of course, it turns out quite large, and in certain cases, goes counter the rules of money management. If so, abstain from trading this group of patterns.
Potential profit is calculated as the distance from the support level to the high and will equal a possible Take Profit. Ideally, use 60-80% of the pattern height.
Double Bottom
As long as the Double Bottom forms at the bottom of a downtrend, open buying trades. The algorithm is as follows: after the price reaches the resistance level for the second time (ideally, the candlestick closes above it), open a buying trade.
Place an SL behind the high and calculate the TP based on the height of the pattern. As with Double Top, count for 60-80% of the pattern.


How to trade Triple Top & Triple Bottom patterns?
Triple Top
A Triple Top is traded as a Double Top with the only difference that the trade is entered after the third top is formed and the price reaches the support level. Calculate the SL and TP as for a Double Top.
Triple Bottom
In the case of a Triple Bottom, the entry point will be at the breakaway of the resistance level. Open the position after the candlestick closes above the resistance level. With the SL and TP, things are the same as with the Double Bottom.
Summary
Double/Triple Tops and Bottoms are not frequent on charts, however, they may help an experienced trader to make a good profit. Before you start trading these patterns, study the charts and the conditions for the formations of the patterns carefully.
The principle will always be the same but the patterns may look slightly different for various instruments. When choosing a timeframe for trading, make sure that the SL is not against your money management rules.


