What is Volatility and How to Use It on Forex
5 minutes for reading
In this article, we’ll talk about a term called volatility. It’s a very important parameter of the financial instrument price, which is used for forecasts and trading.
What is volatility?
Financial markets never stand still, they are constantly moving. To understand this, just look at the chart of any financial instrument – prices are either rising or falling and quite often trading sideways. For assessing the market activity and price dynamics, there is an indicator called volatility.
Volatility is a range of movements of the financial instrument price over a certain period of time (day, week, month, etc.). In other words, volatility shows how high or low the financial instrument price may rise or fall in a definite time. Volatility can be calculated in percentage or points (the minimum value of price movements)
The stock market is believed to be one of the most volatile and changes in prices of different companies are often measured in percentage. For example, if a stock cost $100 at the beginning of a trading session and added (or lost) $10 during the day, then its volatility equals 10%. Stocks of large companies usually have daily volatility of about 5-10%, mid-caps and low-liquid stocks – 20%, 50%, or even more than 100%.
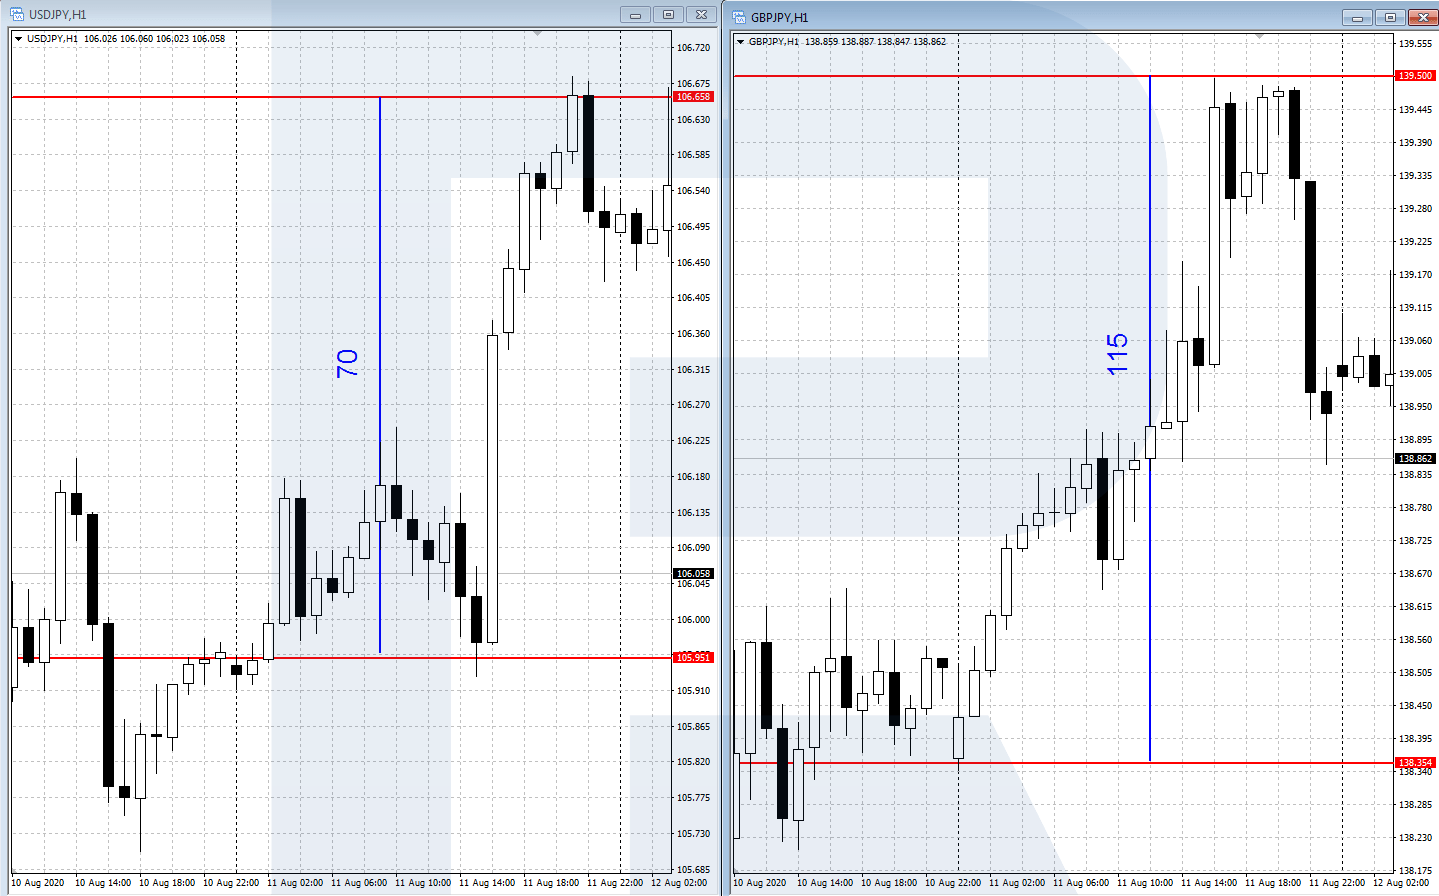
On the Forex market, price dynamics of currency pairs are less significant in percentage terms but it’s due to the trading volumes, which are also much lower. The volatility of currency pairs is usually measured in pips. For example, USD/JPY is considered to be moderately volatile and usually passes 50-70 pips a day, while GBP/JPY is more volatile and its average daily range is between 100 and 150 pips.
How to use volatility in trading?
First of all, volatility is used for assessing opportunities to trade any given financial instrument. Traders make money on price movements, that‘s why instruments with high volatility are more preferable for trading. The more actively a financial instrument moves, the more opportunities traders have to make a profit on this movement.
Long-term investors are more careful with volatility because they usually trade without Stop orders, while high volatility implies high risks. As a result, they prefer a balanced approach, when they choose an instrument with moderate volatility but which has a powerful fundamental or technical background for long-term movements.
On exchanges, one may directly trade volatility by means of futures and options. For that, a lot of different volatility indices were developed with VIX being one of the most famous. This index is calculated based on the US stock index S&P 500. VIX is sometimes called the “fear index” – at the time of panic it rises and at the time of calmness – vice versa.cur
When trading on Forex by means of volatility assessment, one can choose suitable currency pairs. In my opinion, average daily volatility offers three major recommendations for trading:
- Forecasted movement – guidance for Take Profit in pips.
- Risk limiting – guidance for Stop Loss in pips.
- Volatility growth - a confirming signal about the beginning of a new trend.
Indicators for trading using volatility
For calculating and using volatility in trading, a lot of technical indicators were created. Let’s check three of them, which are quite popular with traders.
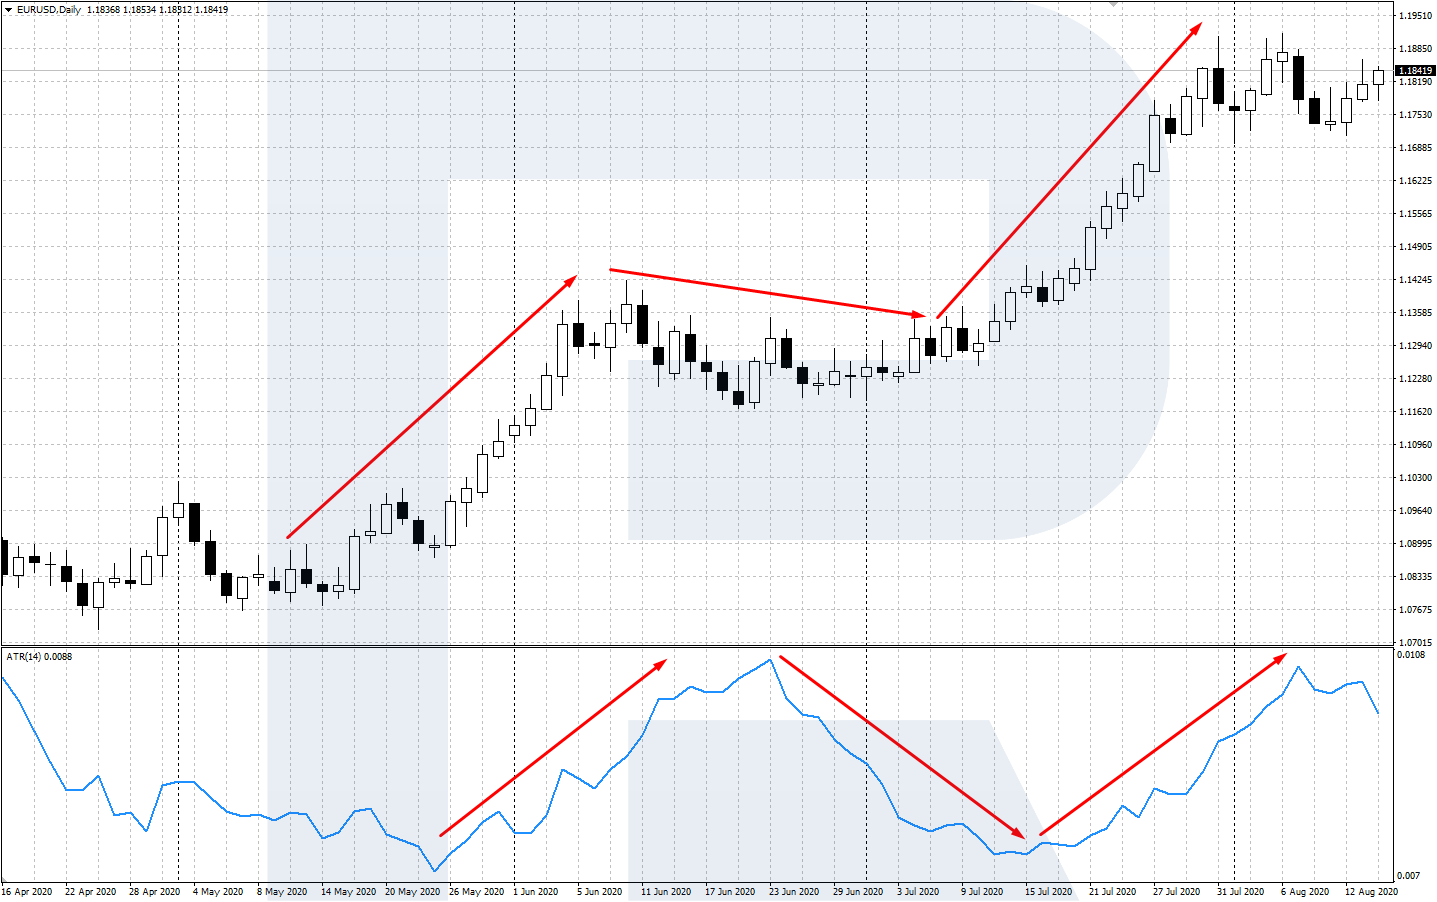
ATR (Average True Range)
ATR indicator is famous for assessing volatility, which was created in 1978 by J. Welles Wilder). The major goal of ATR is to calculate the current volatility of a financial instrument. Volatility in pips is calculated by averaging out the highest and lowest values of the price over a specified period of time.
The ATR indicator is built in a separate window below the price chart and consists of one major line, which shows only positive values starting from 0. Average True Range shows changes in volatility, it will equally grow when volatility rises in both ascending and descending trends. The higher the market volatility, the bigger the indicator value.
Bollinger Bands
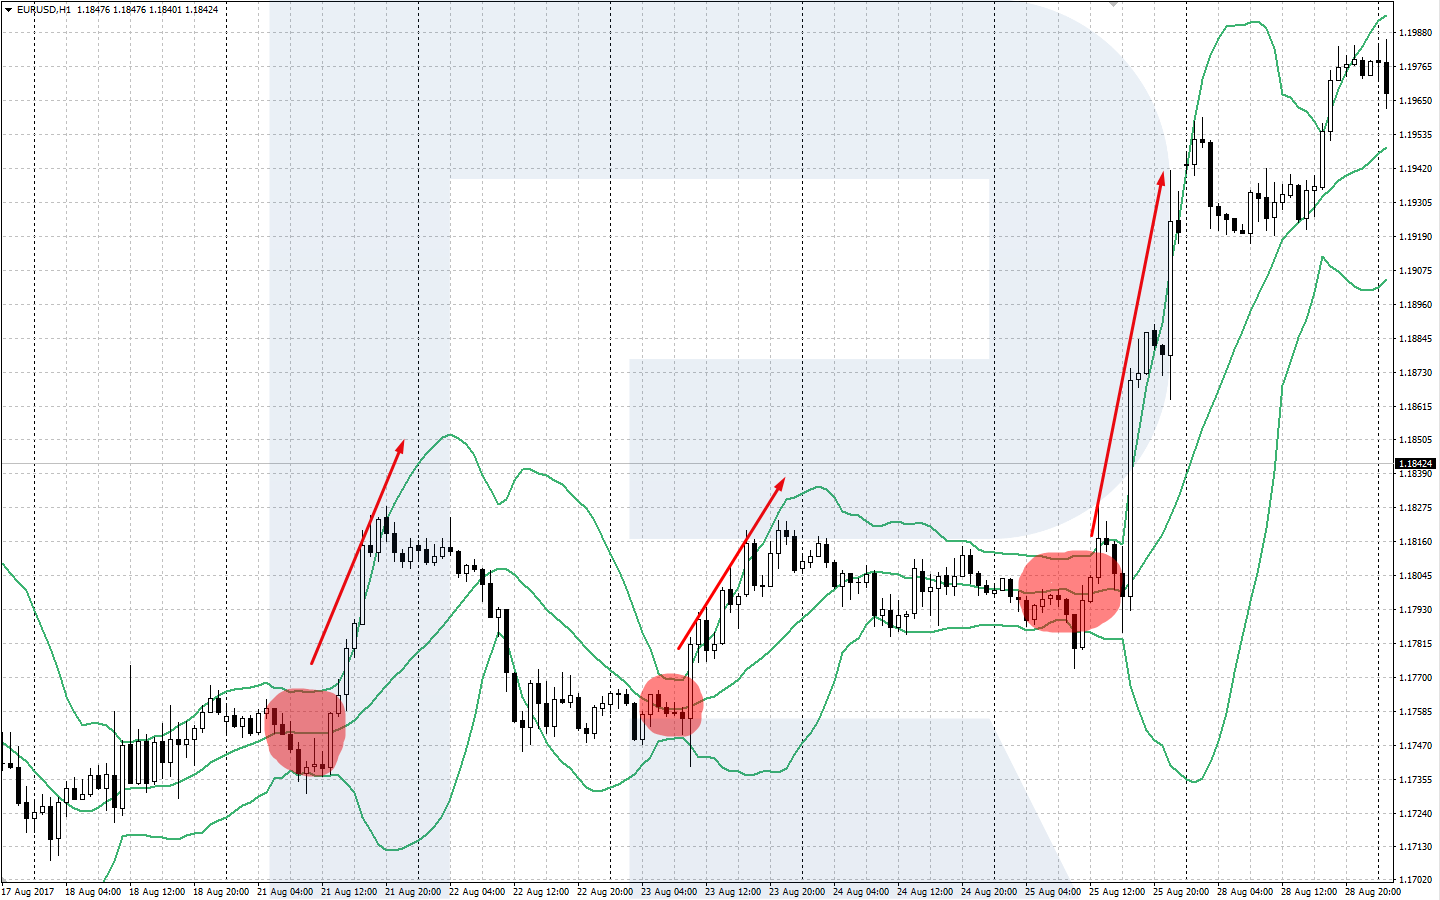
Bollinger Bands is a trend indicator created in 1984 by John Bollinger. However, the major goal of Bollinger Bands is not to define the volatility of a financial instrument but to look for new impulses and signals that hint at a possible trend reversal. Nevertheless, the indicator helps traders to see changes in volatility on the chart.
The indicator’s upper and lower bands are forming some kind of a channel where the price chart is moving. These borders of the price channel provide insight into the current market volatility.
- When the borders are narrowing – volatility is reducing and the price is slowing down.
- When the borders are widening – volatility is increasing and the price may start a new movement.
ADX (Average Directional Movement Index)
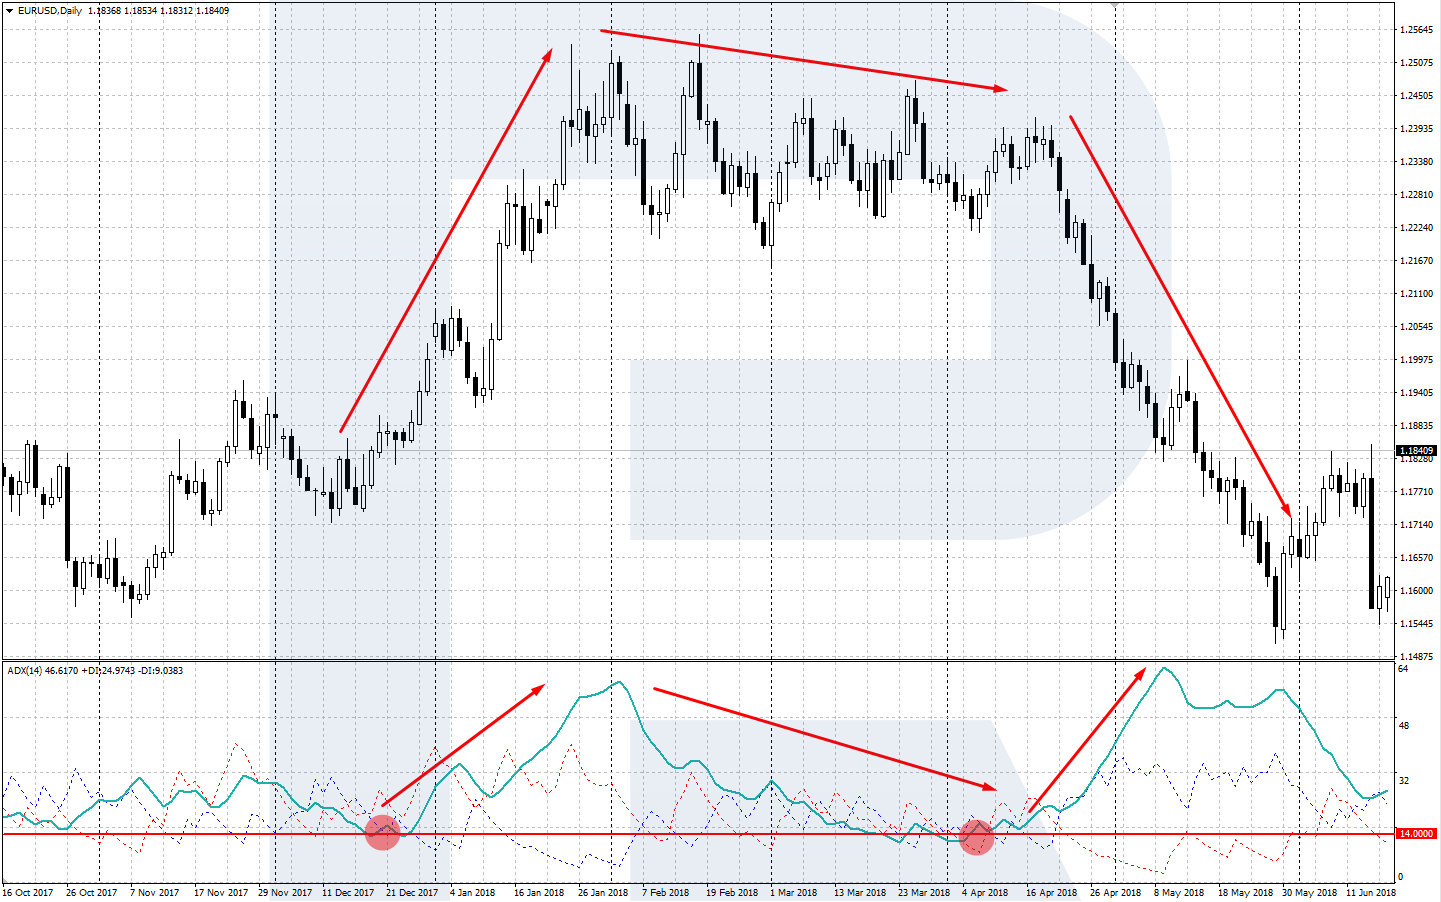
The ADX indicator was also created by J. Welles Wilder. ADX is a trend indicator, which assesses the strength of the actual trend by comparing the highest and lowest prices over a specified period of time (default settings use 14). The indicator consists of three lines: two directional, +DI and -DI, and the main, ADX.
Basically, ADX shows the current market volatility:
- If ADX starts falling, it means that volatility is decreasing, the actual trend is slowing down and may reverse.
- If ADX starts rising, it means that volatility is increasing and indicating the beginning of a new trend.
Closing thoughts
Volatility is a very important parameter of any financial instrument, which defines its price dynamics. Using volatility, we can assess prospects of the price movement, calculate Stop orders, and receive additional signals to enter the market. I think if you want to improve the efficiency of your trading, then volatility should be used as an additional tool for both fundamental and technical analyses.


