Trading with Force Index of Alexander Elder

5 minutes for reading
In this overview, we will discuss the use of the Force Index. This indicator from the group of oscillators was designed and first applied to trading by a famous market expert Alexander Elder.
Description of the Force Index
The Force Index is an irregular oscillator that helps to estimate who is dominating the market – the bulls or the bears. As I have said, the indicator was designed by a famous trader, author, and the creator of the Elder’s Triple Screens strategy Alexander Elder.
The main task of the indicator is to estimate the dynamics of the price and show who is stronger in the market – the bulls or the bears. The indicator uses the following parameters:
- the direction of the price movement;
- the price change during a certain period;
- trade volume.
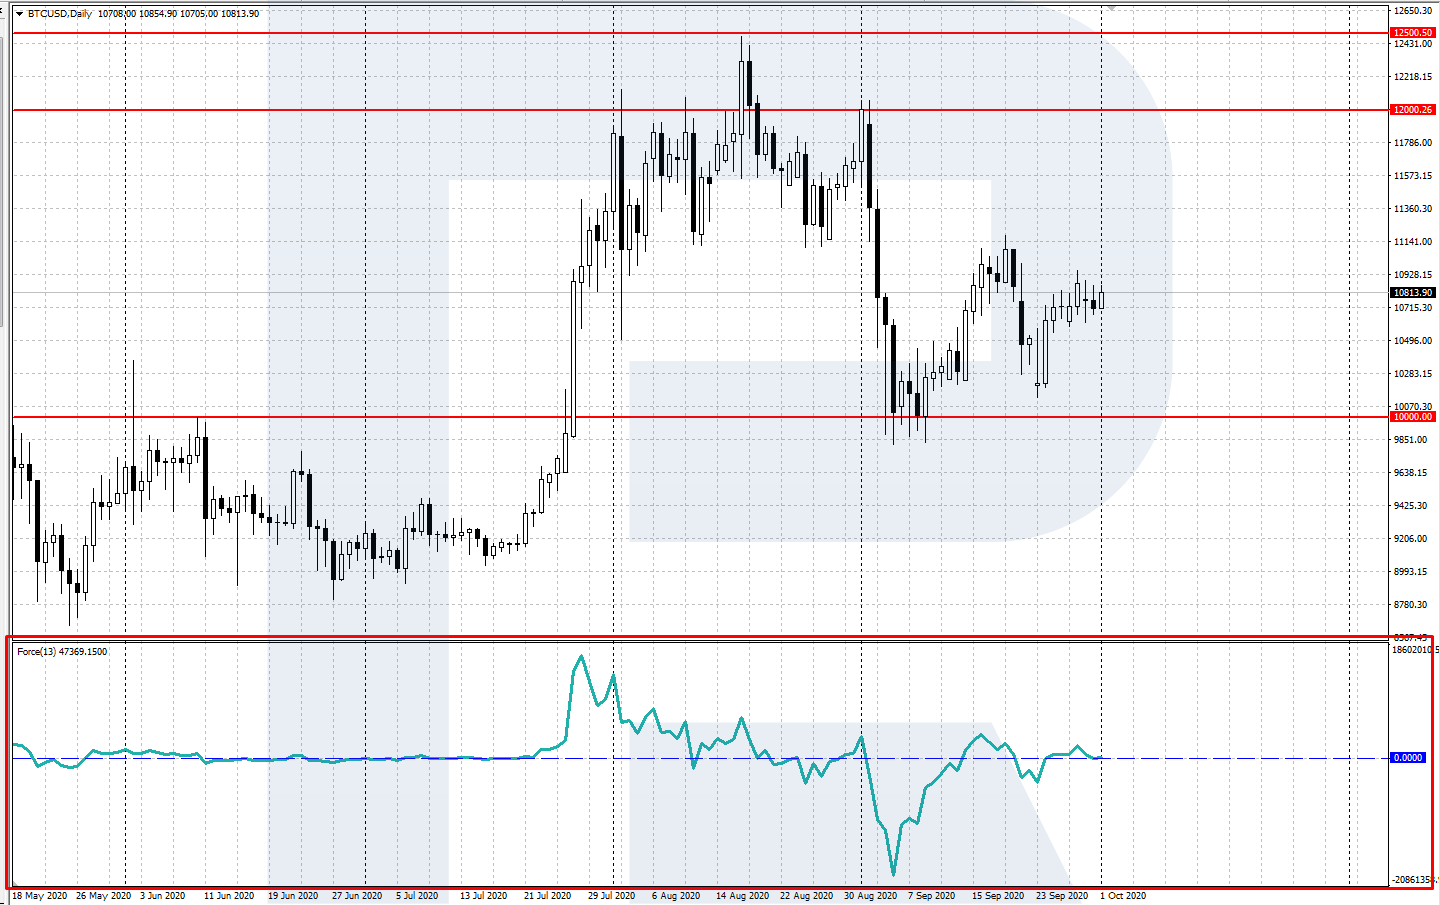
The Force Index gives us an idea of the market direction. If the line of the indicator is above 0, demonstrating another high, this means an uptrend and the dominance of the bulls. If the Force Index drops below zero, forming local lows, the market is in a downtrend, and the bears are ruling.
The Force Index is displayed in a separate window under the price chart and consists of one main line and the center zero level. Elder recommends D2 and D13 for short-term and medium-term trading, respectively. The Force Index is included in most trading platforms, MetaTrader 4 and MetaTrader 5 among them.
The Force Index calculation and setup
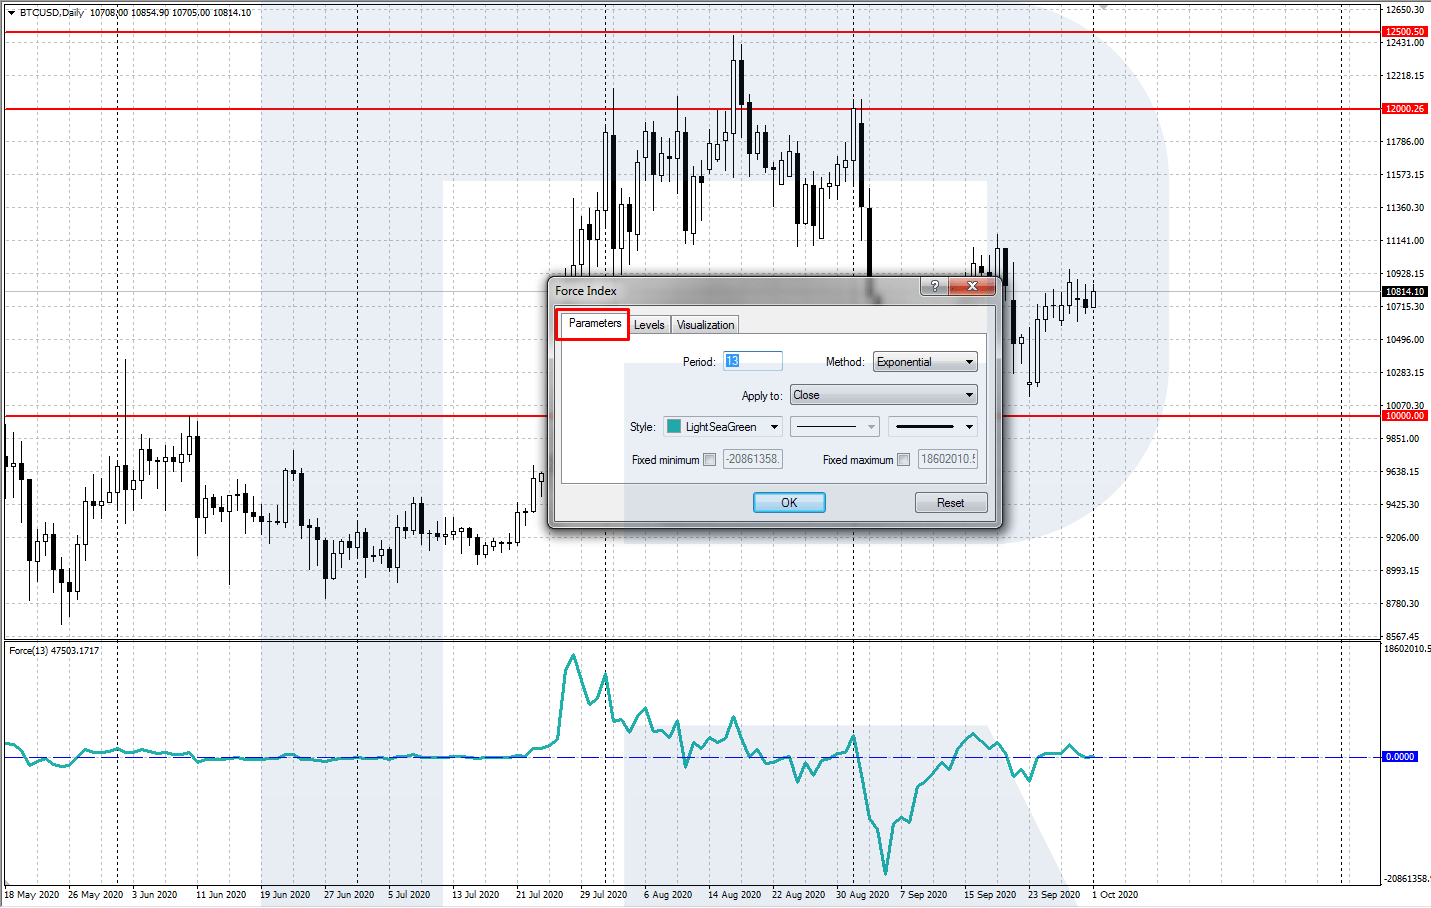
To add the Force Index to the price chart of a financial instrument in MetaTrader 4 or MetaTrader 5, open it via the Main Menu: Insert – Indicators – Oscillators – Force Index.
Elder recommended enhancing the results of the Force Index by averaging its values with an Exponential Moving Average (EMA).
FORCE INDEX = EMA ((Pn – P(n-1)) * VOLUME)
Where:
- EMA is the Exponential MA.
- Pn is the closing price of the current candlestick.
- P (n-1) is the closing price of the previous candlestick.
- VOLUME is the volume of the current candlestick. Note that the volume in Forex is quite relative. The important thing is the real exchange volume in stock or commodity markets.
Installing the indicator to the price chart, set the following parameters:
- Period: the author recommends two periods – D2 for short-term and D13 for medium-term trading.
- MA method is the type of the MA for the indicator; Elder recommended Exponential (EMA).
- Apply to: specify the type of the price. By default, it is Close.
- Style: you can customize the color, width, and representation style of the indicator line.
Trading signals
Apart from estimating the relative strength of the bulls and bears, the Force Index gives the following signals:
Trading the trend
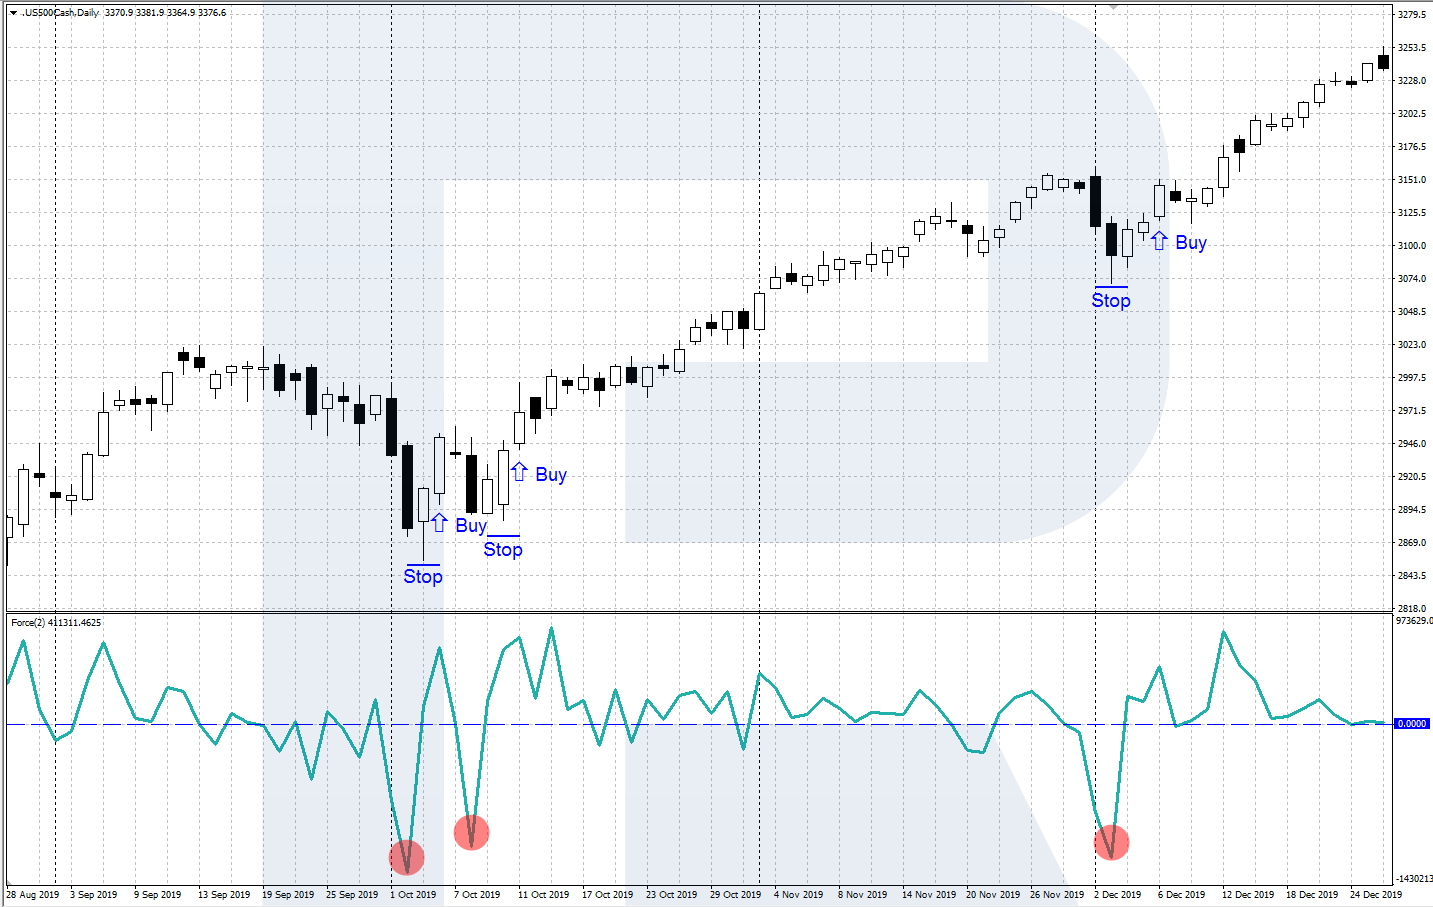
This is the signal given by the Force Index with a short-term D2 period. The idea is to find an entry point by the current trend after a minor correction.
A signal to buy
- The market is in an uptrend;
- The indicator line drops below zero, then reverses;
- After the line exceeds the high of the candlestick on which the price reversed, open a buying position;
- Place a Stop Loss behind the local low. Take the profit after the price reaches a strong resistance level, or when some evidence of an upcoming reversal downwards appears.
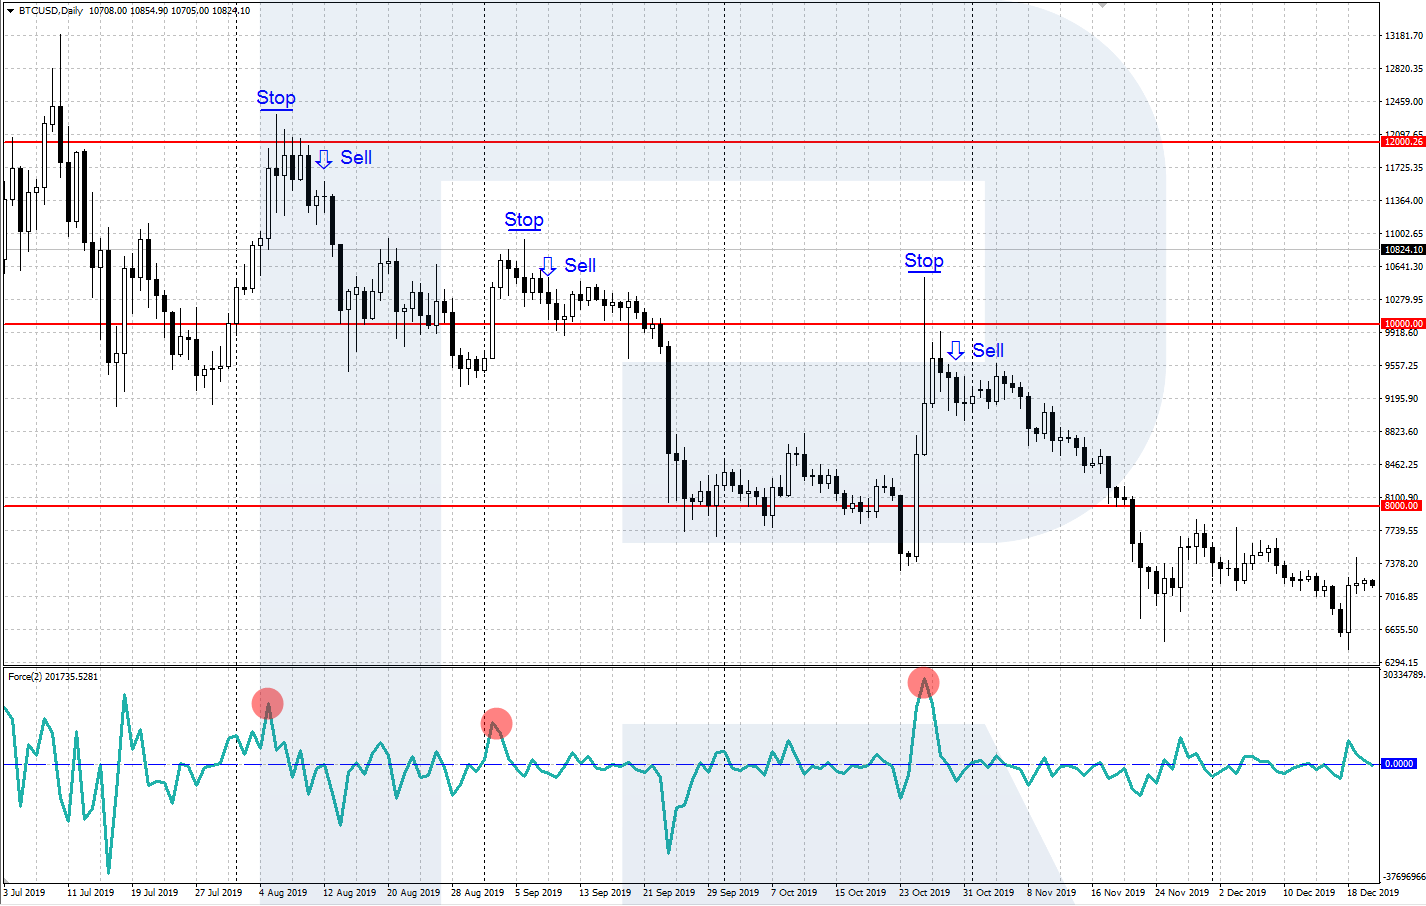
A signal to sell
- The market is in a downtrend;
- The indicator line rises above zero, then reverses;
- After the price renews the low of the candlestick where it has reversed, open a selling positions;
- Place a Stop Loss behind the local high. Take the profit after the price reaches a strong support level, or when some evidence of an upcoming reversal upwards appears.
Divergence
A divergence (from the Latin “divergere”) is a signal that appears when the highs/lows of the Force Index and the price chart do not correspond. It is suitable for both the short-term D2 and the medium-term D13.
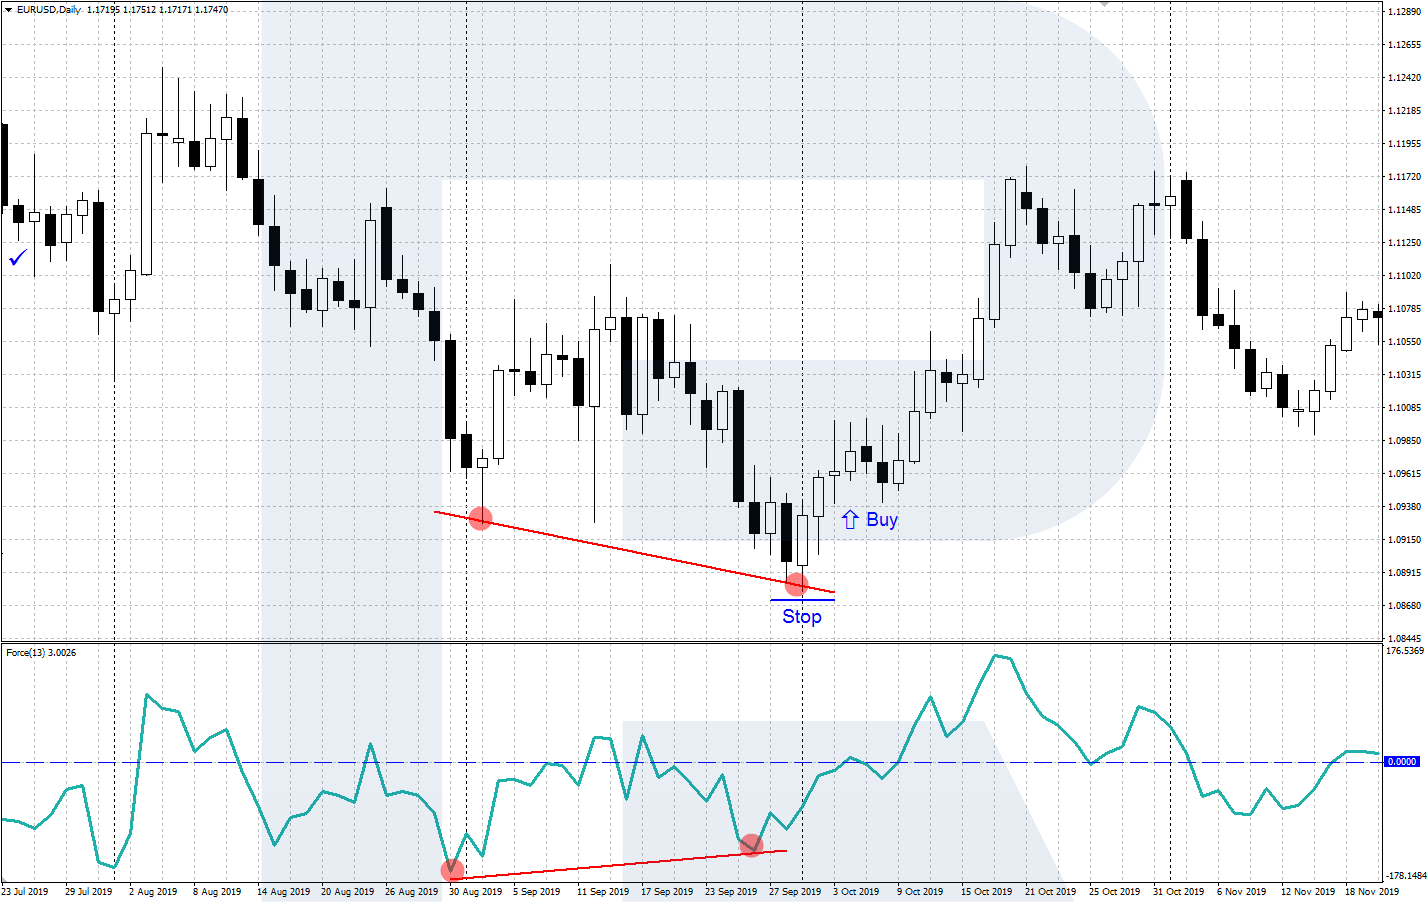
A signal to buy (bullish divergence)
- In a downtrend, the price forms another local low on the chart;
- The indicator line demonstrates a divergence – the new low of the indicator turns out higher than the previous one;
- After the indicator forms the low and reverses upwards, open a buying position;
- Place a Stop Loss behind the last low. Take the profit after the price reaches a strong resistance level, or when the indicator reverses downwards from the area above 0.
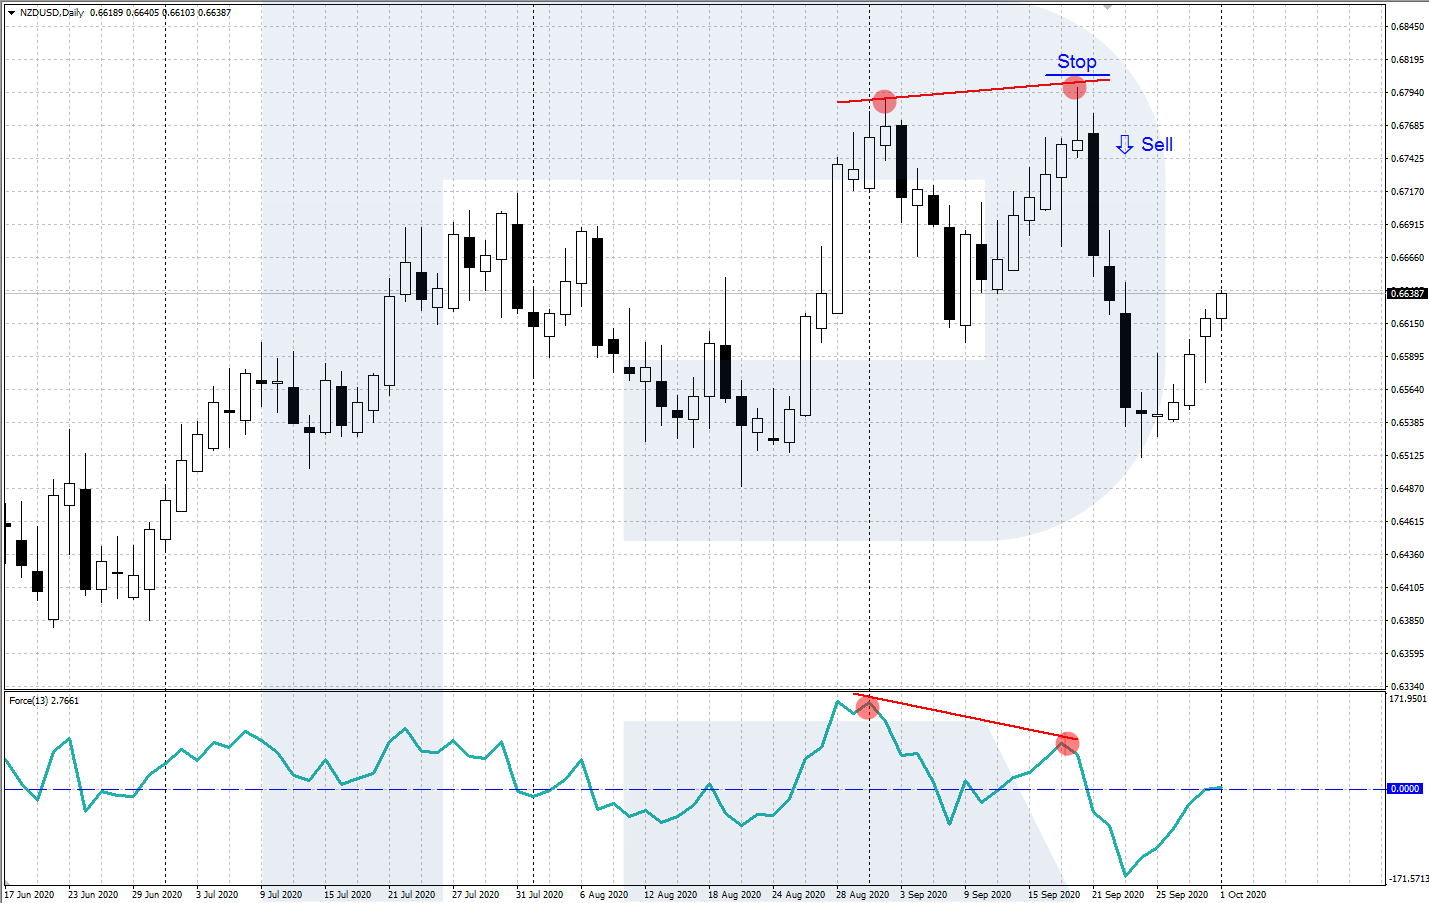
A signal to sell (bearish divergence)
- In an uptrend, the price forms another local high on the chart;
- The indicator line demonstrates a divergence – the new high of the indicator turns out lower than the previous one;
- After the indicator forms the high and reverses downwards, open a selling position;
- Place a Stop Loss behind the complete high. Take the profit after the price reaches a strong support level, or when the indicator reverses upwards from the area below 0.
Closing thoughts
The Force Index is a useful indicator that helps to assess market dynamics and volumes and thus to estimate the relative strength of the bulls and the bears.
Apart from the general market analysis, the Force Index gives signals by the trend and forecasts future reversal points by divergences. See more details about the indicator in the books by Alexander Elder.


