How Does Crude Oil Price Influence USD/CAD?

5 minutes for reading
Oil has become an intrinsic part of our lives, and humanity depends fully on it: oil is not just a source of energy but also the material from which many everyday things are made.
It has long been argued that only large corporations can make money on crude oil but this is wrong. Most types of oil are available for trading in the stock market, the most popular types are BRENT and WTI. The USD is the most widespread currency in the world, used for the biggest part of transactions. The majority of wealthy people keep their capital in the USD. The Canadian dollar is less popular over the globe. It is a commodity currency, which means it reacts actively to commodity prices, oil and gold in particular.
Today, we will discuss the interaction and correlation of oil prices and the CAD. If you look closely at the charts of BRENT and USD/CAD, you will notice certain patterns in the dynamics of the assets. As long as the Canadian economy depends on oil production and selling, USD/CAD quotations correlate with oil ones.
What is the correlation?
Correlation is the way assets relate to one another at a certain period. There are three types of correlation:
- Positive correlation means that two instruments are going in one direction during the observation time. The observed assets will rise or fall proportionately. The charts are similar.
- Negative correlation means that the assets are going in the opposite direction. While one asset is growing, the other one will be declining. The charts look mirror-like.
- Zero correlation means that the instruments are acting with no obvious relation to each other.
The CAD starts growing when the country sells its oil at a higher price. The pricier oil becomes, the better for the Canadian economy thanks to the profit it makes.
As long as in the USD/CAD pair the US dollar comes first, the correlation will be negative. This means that the growth of oil will cause a price chart of USD/CAD to fall.
How USD/CAD correlates with BRENT and WTI on the chart
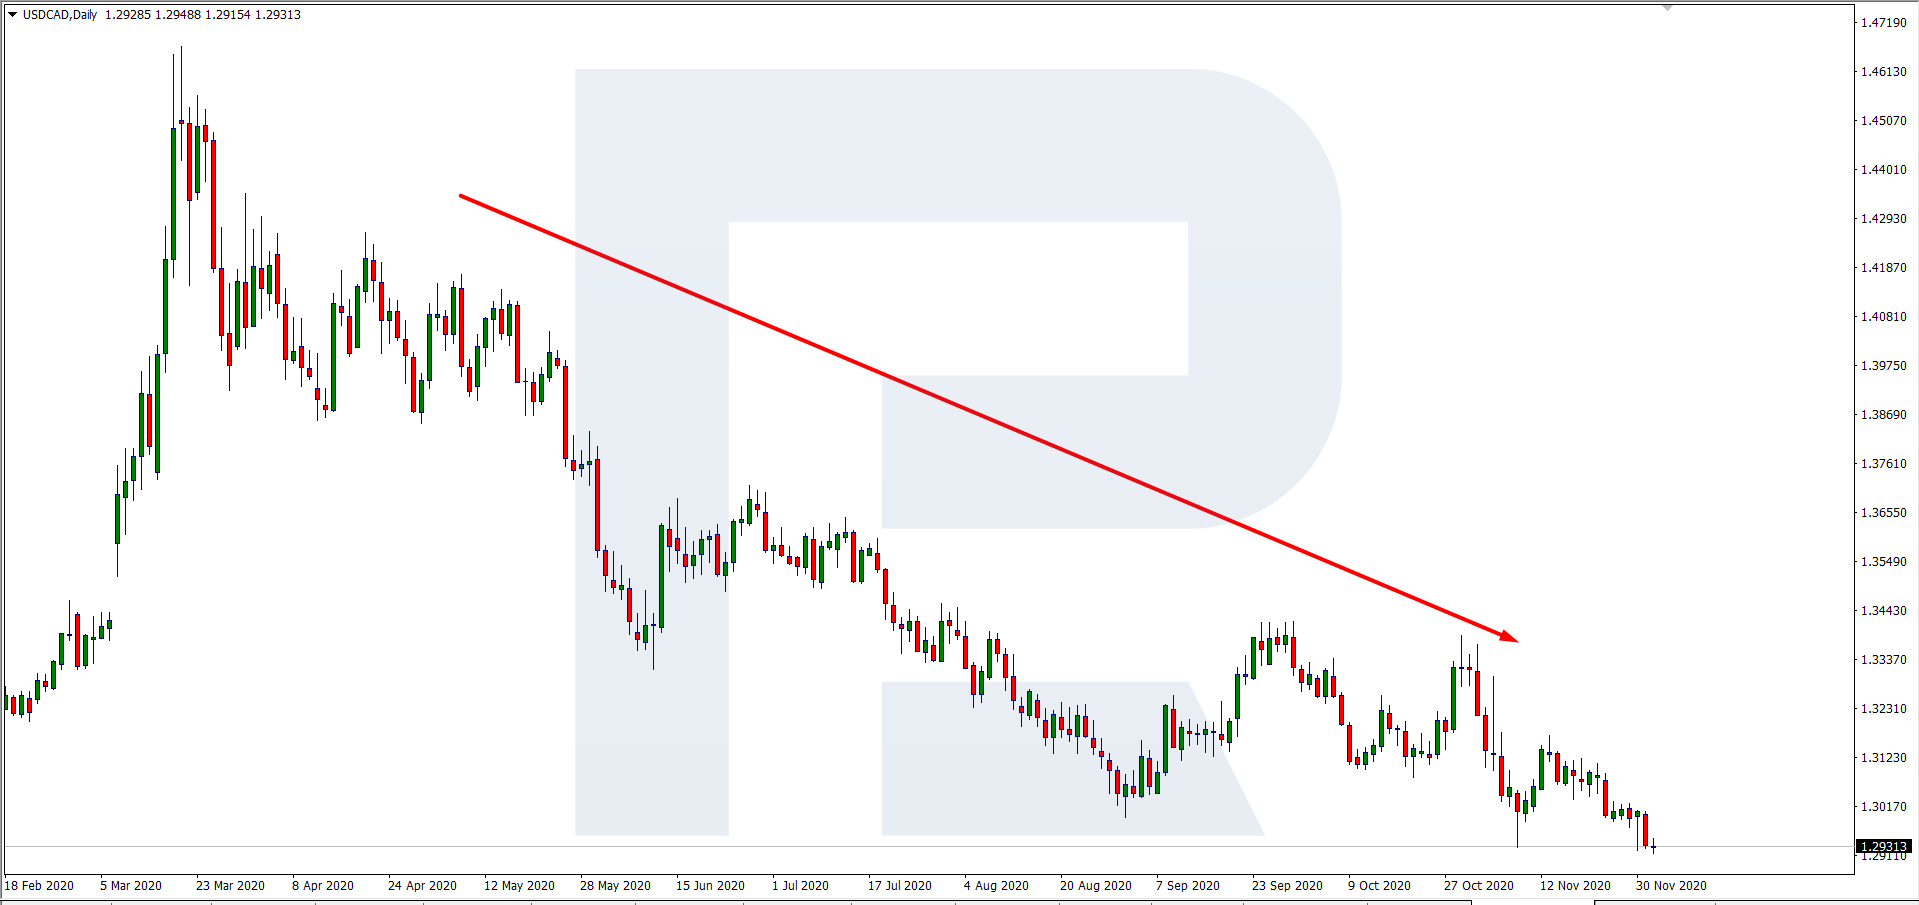
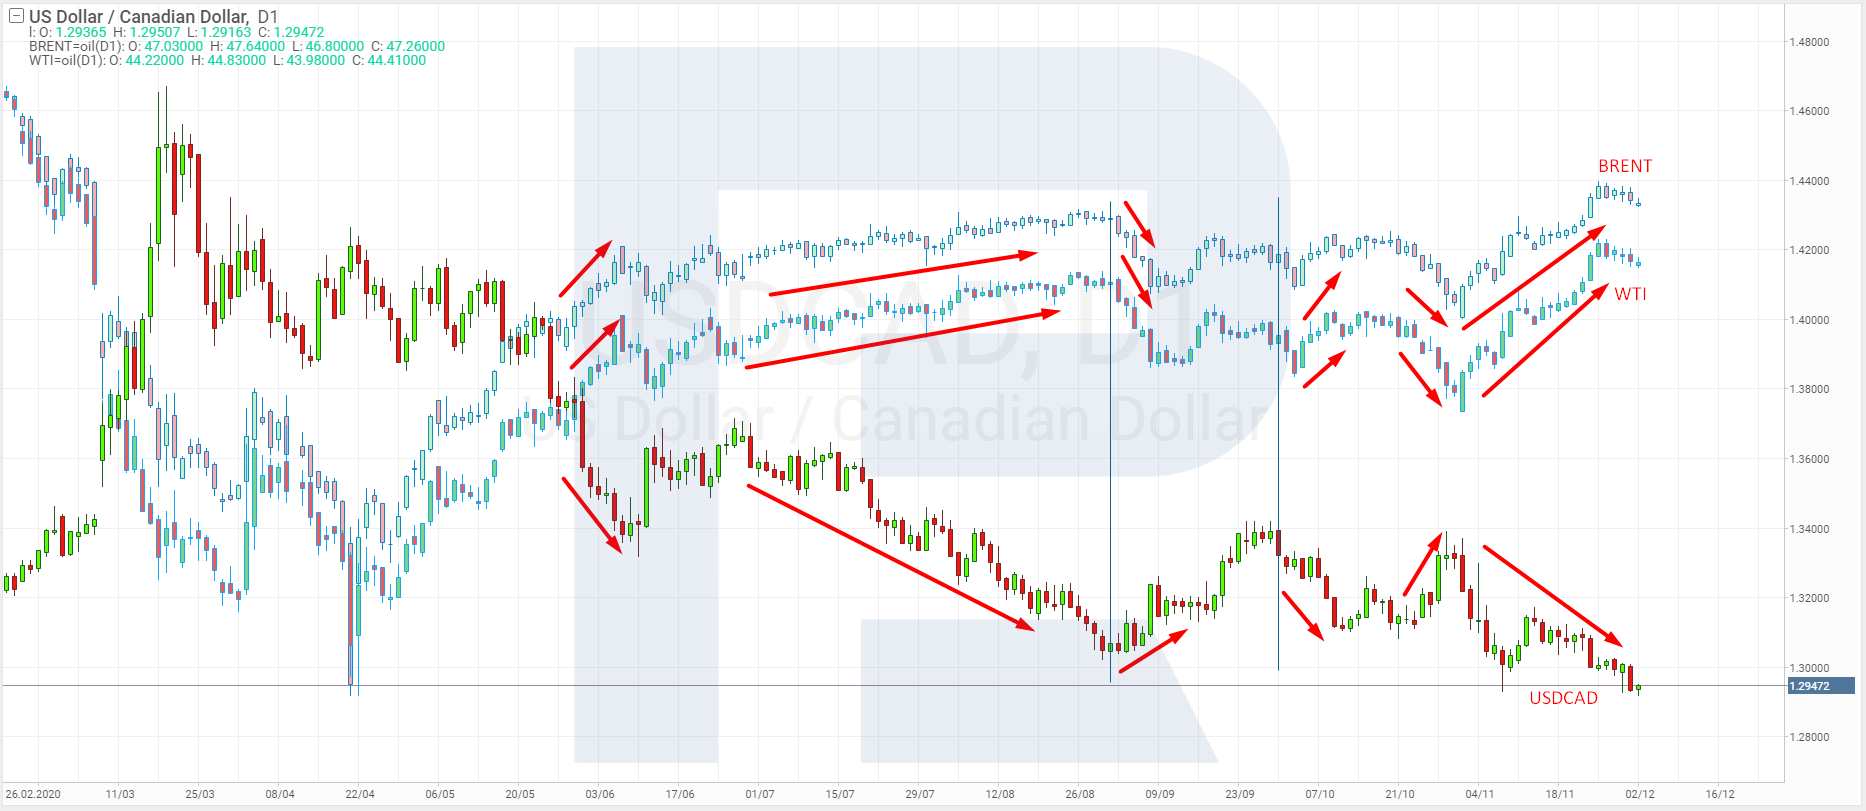
On the chart, the USD/CAD pair is in a downtrend, renewing the lows. From time to time, the quotations correct but this does not take long. As a result, the US dollar loses to its Canadian counterpart.
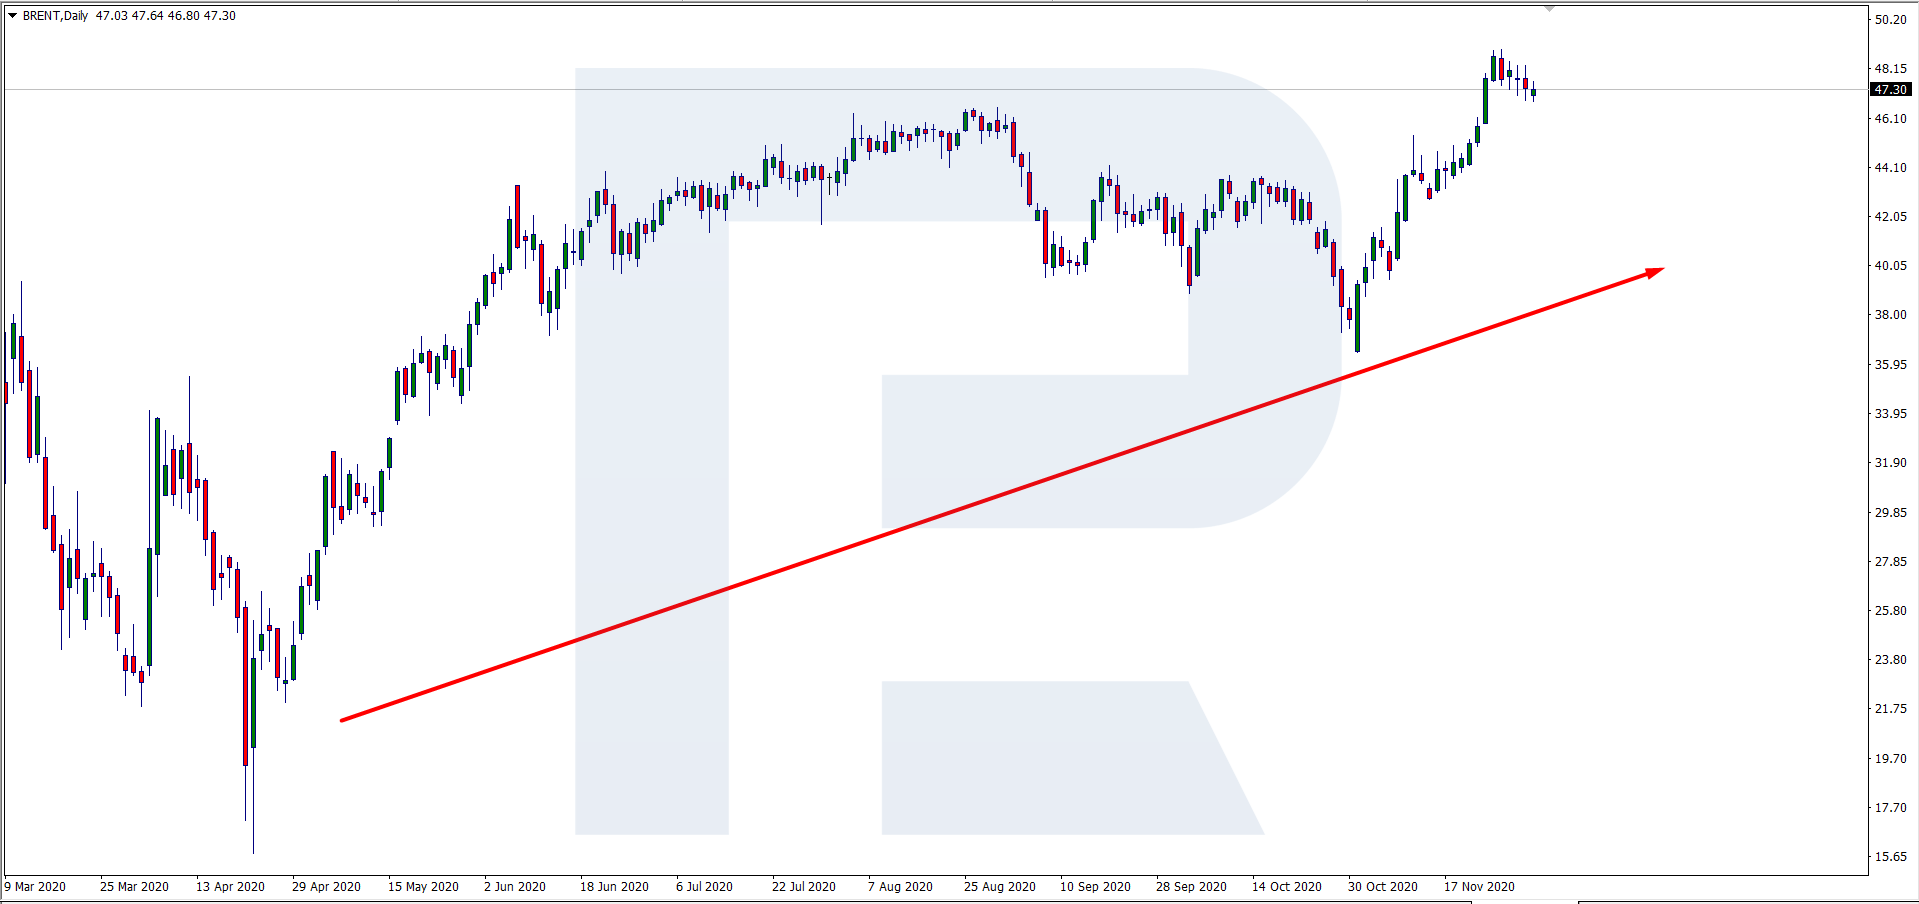
BRENT on D1 has been in an uptrend for a month already. Regardless of a drawdown, it is recovering.
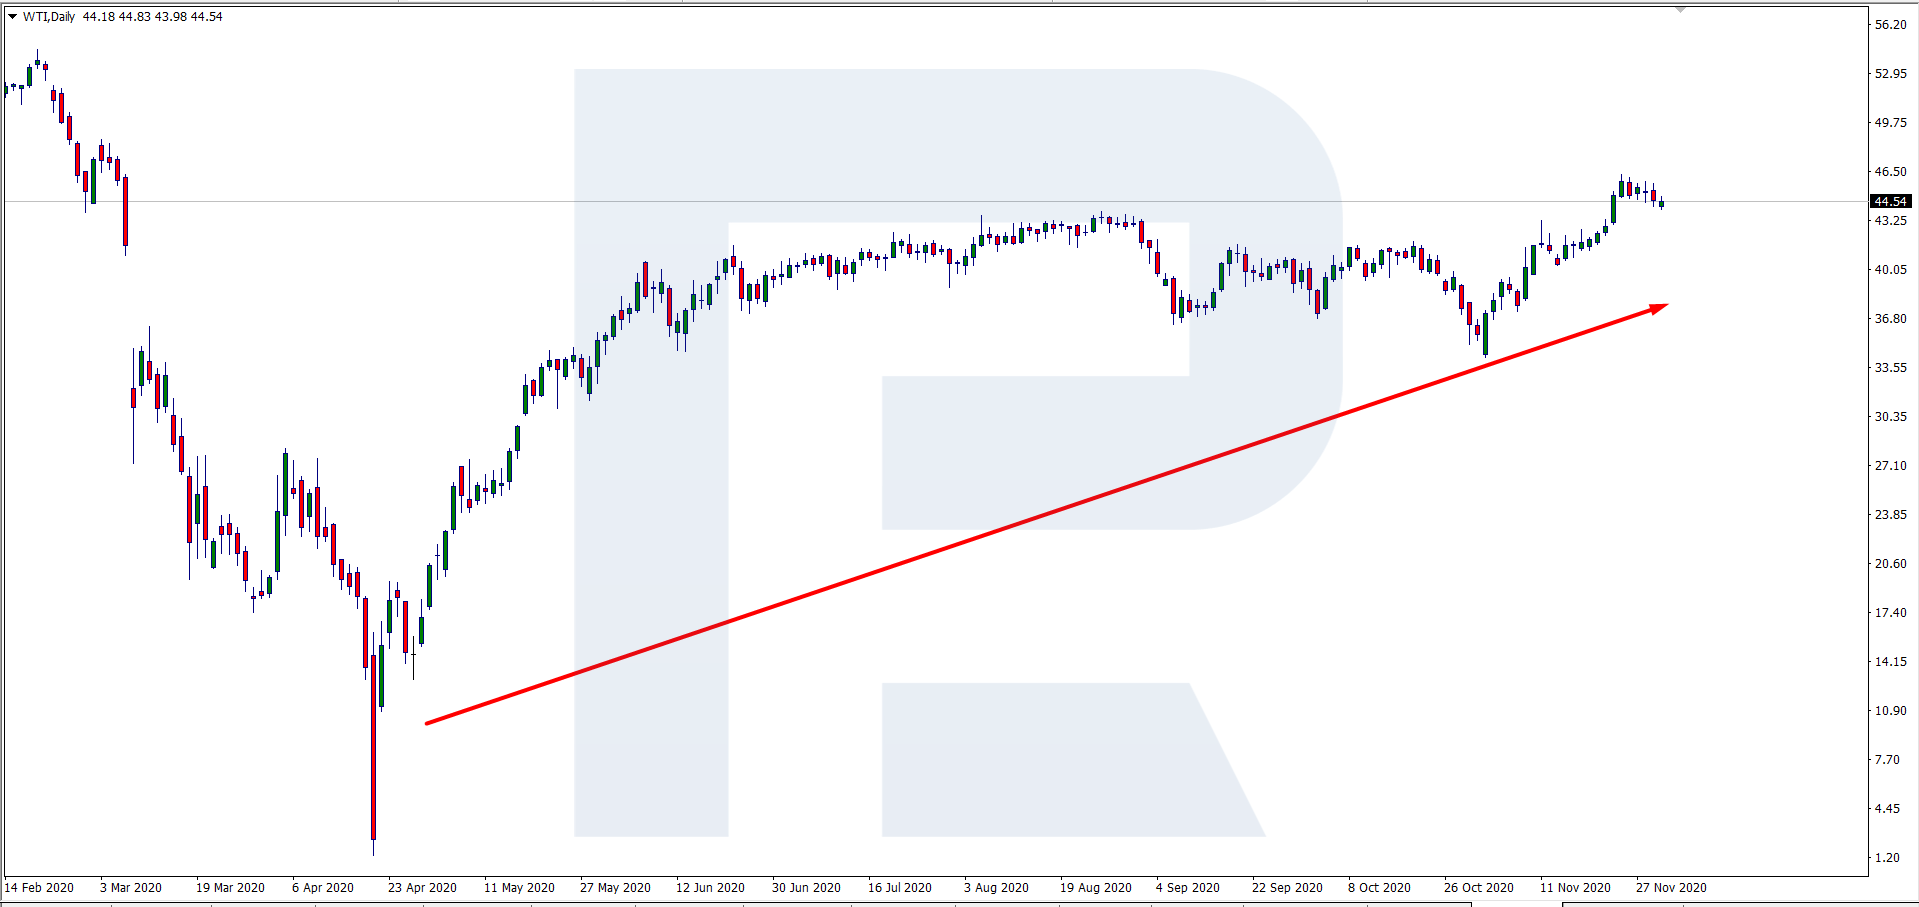
WTI on D1 demonstrates a similar picture to that of BRENT. It has been growing for a couple of months and keep recovering from all pullbacks.
Currently, both types of oil are forming a correctional wave. Simultaneously, the USD/CAD pair is acting similarly: the quotations have paused in their decline and are forming a correction.
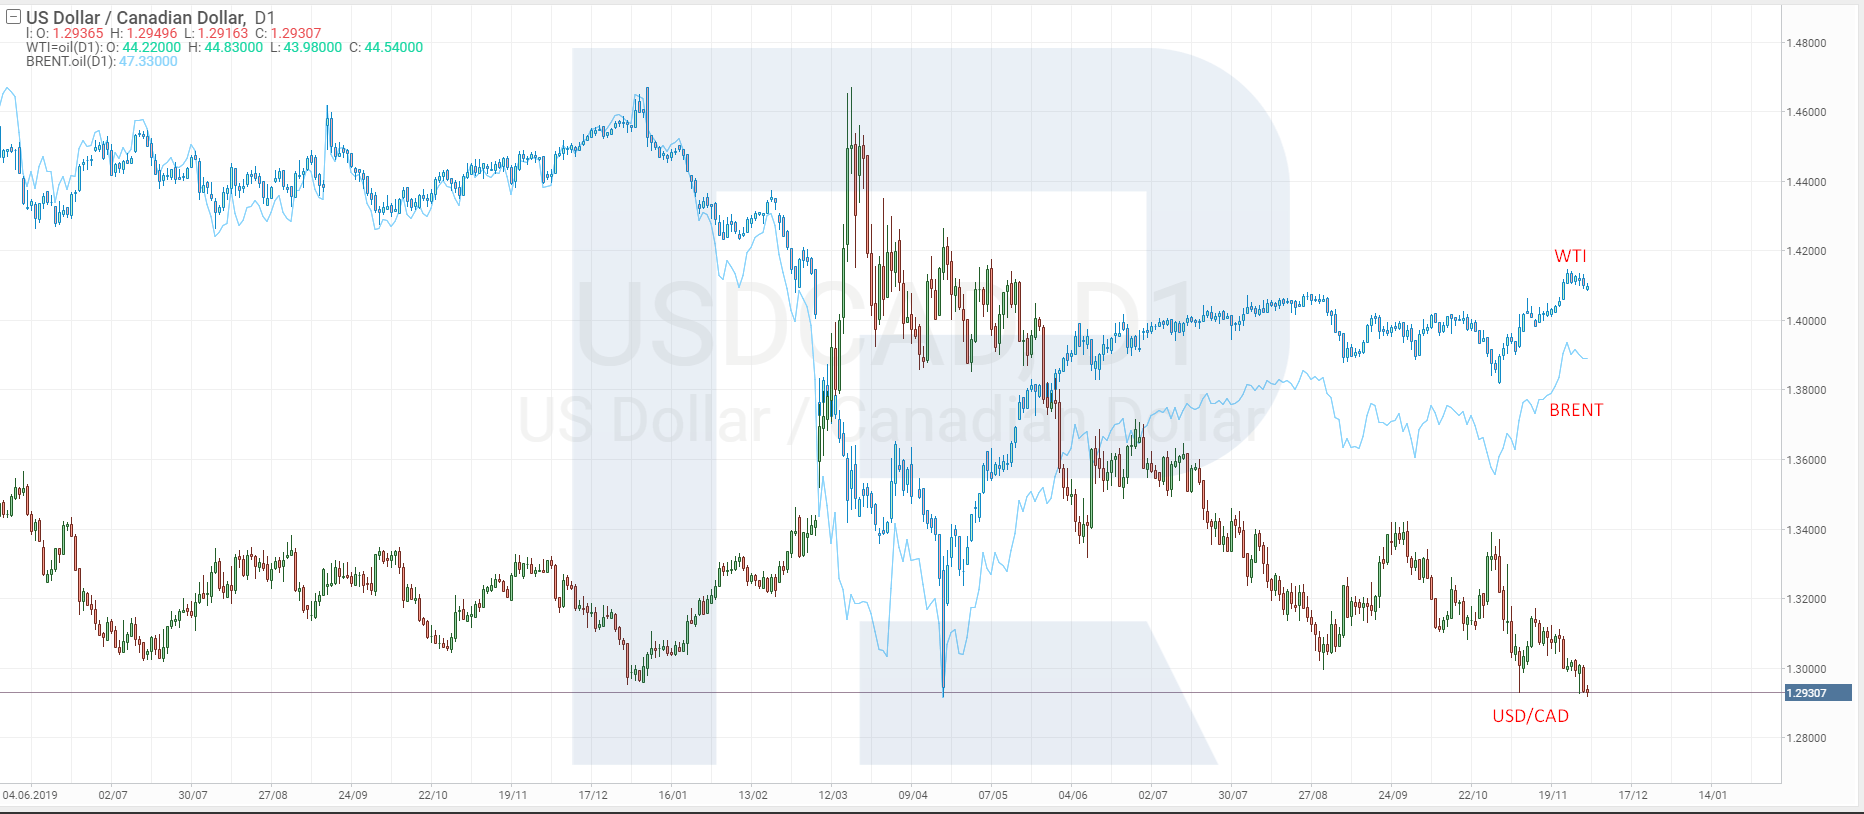
On the chart below, you can see all the instruments. BRENT and WTI charts are not identical but quite similar regardless of a certain difference in the current quotation. BRENT costs 47.30 USD, WTI – 44.54 USD, and the USD/CAD quotation is 1.2931.
How to use this correlation in trading?
Let us now discuss how to use the correlation between oil and USD/CAD in market trading. For the sake of clearance, let us use one chart for both types of oil – BRENT and WTI – and the currency pair.
Note that the daily charts of both types of oil are almost identical – 90% of the Japanese candlesticks coincide. There are certain differences but neither of them is critical. The chart of USD/CAD differs from those of oil, which is natural. Oil prices are influenced by supply, demand, production, geopolitical factors, and force-majeure events.
The currency pair experiences the same influences, only the US dollar and the Canadian dollar feel them separately and then get assessed relative to one the other. From the chart, we can conclude that first oil reacts to some outer factors and starts growing or falling, and some time later, USD/CAD follows up. The quotations of the currency pair start moving after the oil chart does. Meanwhile, the oil chart recovers faster than the chart of the currency pair. Knowing these correlations and patterns, you can build your trading strategy that includes oil and USD/CAD.
Example of USD/CAD trading
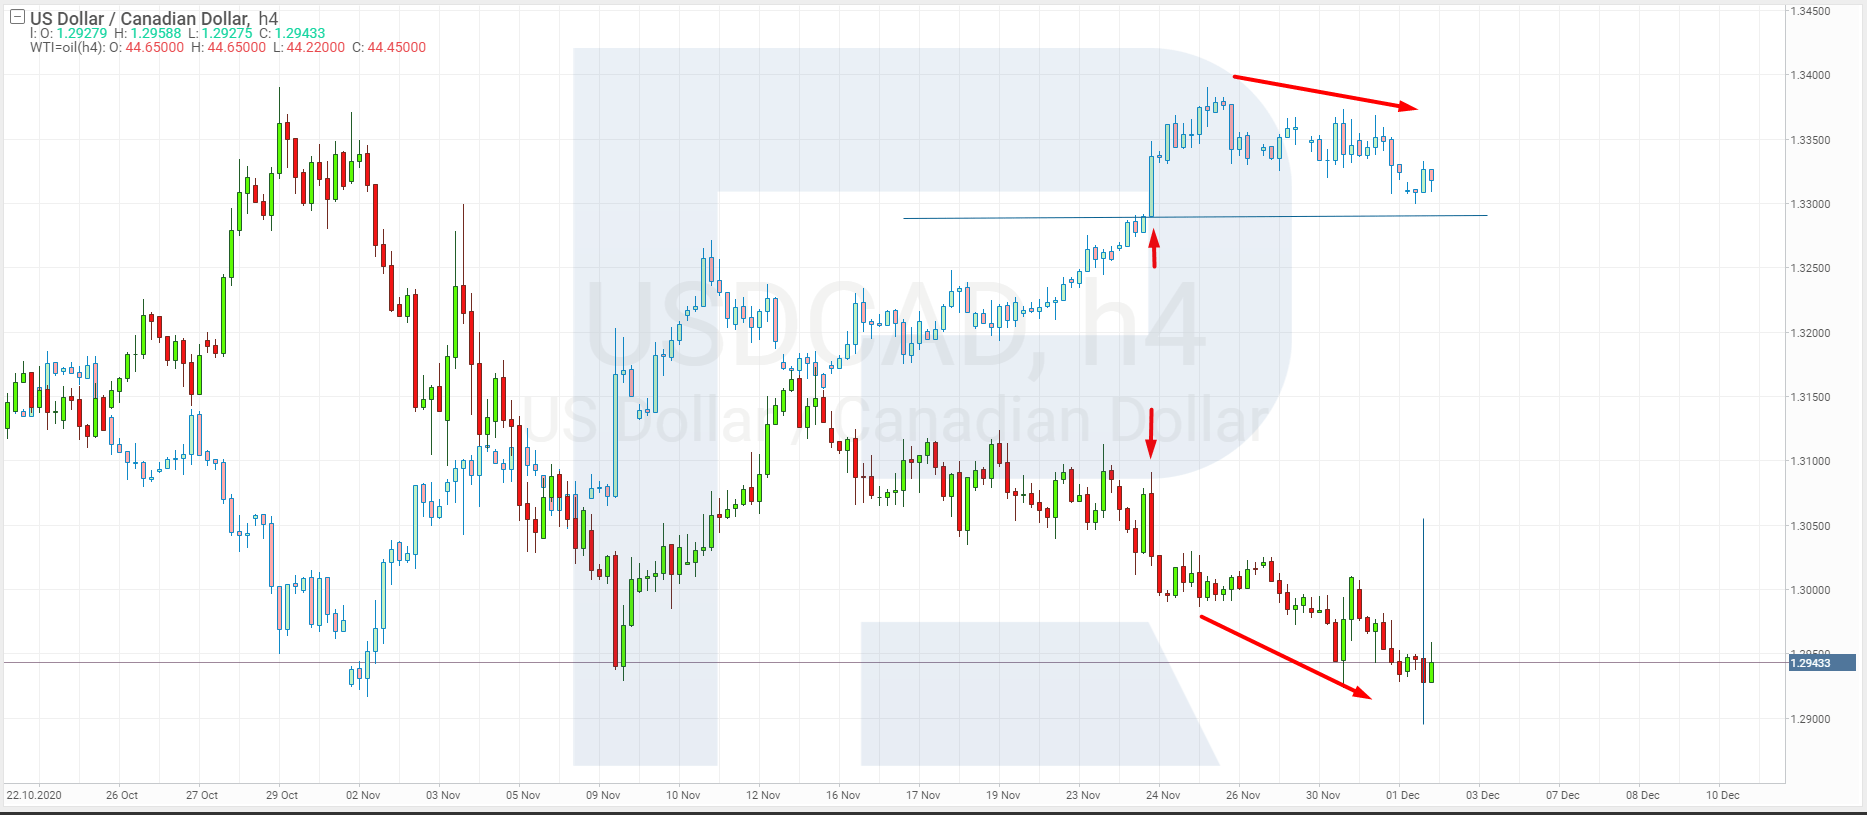
Look at the H4 of USD/CAD and WTI. The WTI quotations broke through the resistance level and started growing. At that moment, the situation on the USD/CAD chart is the opposite: the price began to fall fast. During 8 candlesticks the oil price was growing, then returned top the broken resistance level. As for the price chart, the quotations keep declining, pulling back from time to time. This might mean that Canada made a profit on oil and somewhat secured its national currency against the US dollar. Then if oil quotations keep growing, USD/CAD will be falling, asserting further strengthening of the Canadian dollar.
This was a general example of the correlation between oil and the quotations of the Canadian national currency.
Bottom line
Though there is an obvious correlation between oil and USD/CAD, it would be wrong to use it for trading without additional filters. The market is full f false surges that provoke unpredictable rises and declines. Anyway, this correlation can be used as a supplementary signal supporting the direction of the price.


