How to Trade Arthur A. Merrill M and W Patterns

10 minutes for reading
In most cases, the analysis gets reduced to searching for repeated patterns on price charts. Those can be simple patterns, such as the Triangle or Flag, or more complicated ones, such as the Dragon or Wolfe’s Waves. However, all these patterns are united by a clear price structure. Arthur Merrill, the hero of this article, called his patterns “wave structures”. The name is connected to the popularity of Dow Theory, describing wave-like price movements, at those times. By the way, popular Elliott’s Waves are based on this theory.
As we know, any search for patterns can be subjective, and only 5 out of 10 traders will notice a complete pattern. However, if we speak about mathematical patterns, 10 out of 10 traders will see the same signals.
Merrill tried to find the same logic in graphic structures because many sooner or later turn back to searching patterns on the chart. In the end, he singled out 32 graphic patterns and distributed them between two groups: 16 M-shaped and 16 W-shaped patterns. They indicate the end of either an ascending or descending trend, sort of reflecting one another mirror-like.
The history of Arthur Merrill patterns
The first attempt to describe such patterns is considered to belong to Robert Levi, a financier. In 1971, he took up studying five-pointed price patterns, trying to structure them but failed to complete his studies because the patterns were too abundant (about 2,000 patterns).
Levi abandoned the idea, and it was left behind for a decade. At the beginning of 1980, Arthur Merrill re-took studying the patterns, which resulted in singling out and structuring the five-pointed patterns below.
Why are they called M- and W-shaped?
Merrill based the patterns he studying on their similarity to two letters – M and W. There is no deep hidden sense in it.
This is an important thing to keep in mind because classic patterns also feature M and W shapes but those might indicate the direction of a future position, while Merrill’s patterns do not follow the same logic.
For example, an M-shaped Double Top pattern signals to sell, while a W-shaped Double Bottom pattern signals to buy. Nonetheless, this simple principle does not apply to Merrill’s patterns.


How to trade so many patterns?
As long as the patterns are fully mirror-like so that only 16 out of 32 are unique, we will only show how to use M shapes. For W shapes, rules are identical but inverted.
For example, if by M1 we buy, by the inverted W16 pattern, we consider selling. So do not get scared off by a large number of patterns, in reality, there are not 32 but 16 of them. In this article, we will have a look at all of the patterns and compare them to patterns from classic tech analysis.
M1 and W16
The last point of the M1 pattern reflects the end of a decline, but the author says that it is not as much a reversal point, rather a point of being extremely oversold. As for classic tech analysis, this one is similar to the Wedge reversal pattern.
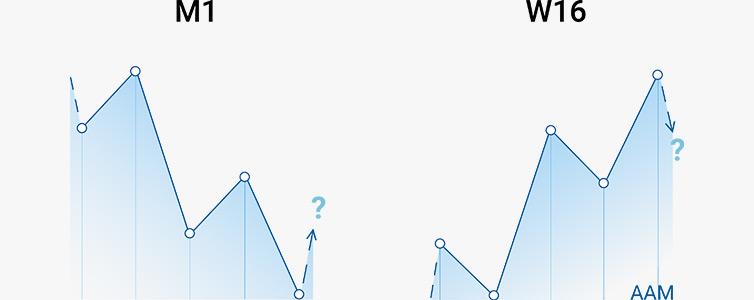
Here, we also watch the pattern contract and the trend – reverse upon breaking the pattern away. To place the goal, calculate the height of the pattern and measure these points from the point of the breakaway.
M2 and W15
In the M2 pattern, the price goes in some sort of a downward zigzag, after which an upwards zigzag appears, but we do not wait for a renewal of the high as in M1. This pattern is similar to an Inverted Head and Shoulders from classic tech analysis. In the picture, the right “shoulder” is rather low but it still remains an example of our pattern. To estimate the goal, measure the pattern and place the goal as many points away from the breakaway point on the “neck”.
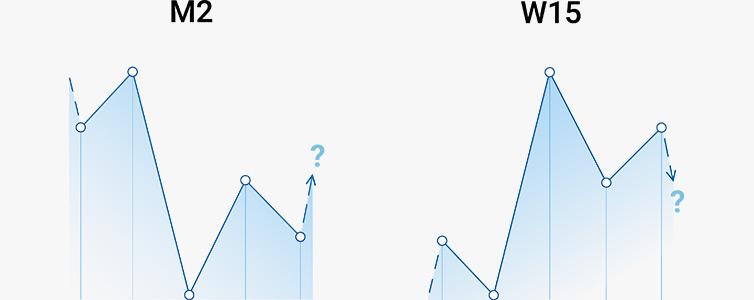
Also, in a downward movement, when the price fails to demonstrate a new low under the previous one but shows a new high above the previous one, the trend reverses. This is the market’s nature. So even if your understanding of the pattern is simplistic, always keep in mind the potential of a trend reversal when the price cannot go on down and breaks through the nearest high.
M3 and W14
M3 is said to be the second-popular Merrill’s pattern. Here, the price renews the low before a potential reversal upwards. In modern trading, it is similar to the Wolfe’s Waves or Three Indians pattern.
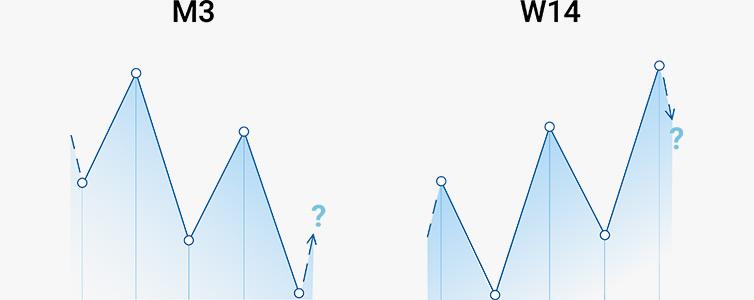
To set the goal, draw a line through the first low and the second high. As you see, it touches the descending support line, after which a reversal of the current trend is expected. The author notes that this is definitely a downtrend but not as strong as in M1.
M4 and W13
This wave-like structure more reminds of the classical reversal pattern Inverted Head and Shoulders with the “shoulders” at more or less one level. Most often, traders buy from the right “shoulder”.
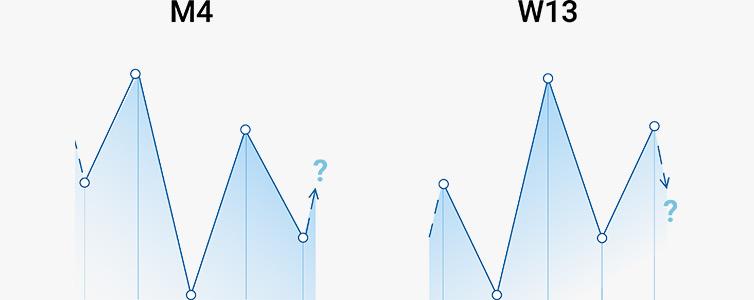
Note that in this case, the low is not renewed while the price breaks through the nearest high. To set the goal, we, again, measure the height of the pattern from the breakaway point on the “neck”.
M5 and W12
M5 is an expanding formation on the price chart. The fluctuations of the pattern begin at their very start and increase to its end. As in the picture, the price, indeed, shows both new highs and lows. At the same time, the low is renewed, and the price bounces off upwards from the support line.
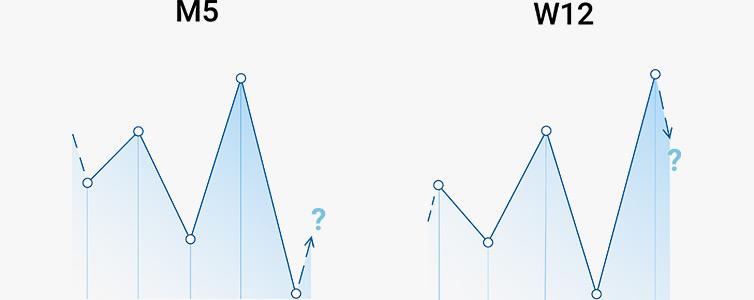
The aim of the growth can be on the line drawn through two highs. In classic tech analysis, this pattern is called an Expanding Formation or Expanding Triangle. Traders do not like this pattern because it is hard to trade, and volatility at its formation is high.


M6 and W11
The pattern reminds of an irregular Inverted Head and Shoulders pattern due to its “neck” being inclined upwards. In the classic pattern, the “neck” must go by the trend, which in this case is declining. However, in the current structure, we can suppose a descending Wolfe’s Wave forming.
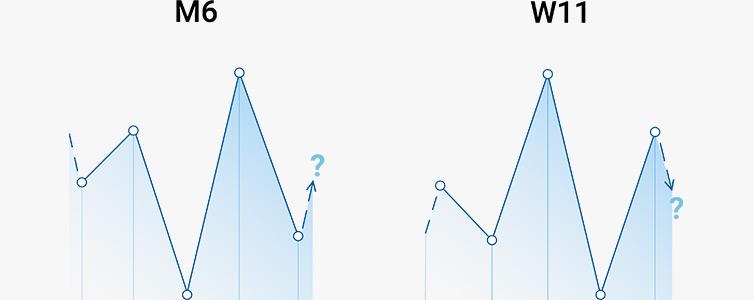
The author did not recommend buying by this pattern, though in most cases, the price is really going up. To set a goal, you can draw a line through two highs, which will be the point off which a bounce downwards is expected.
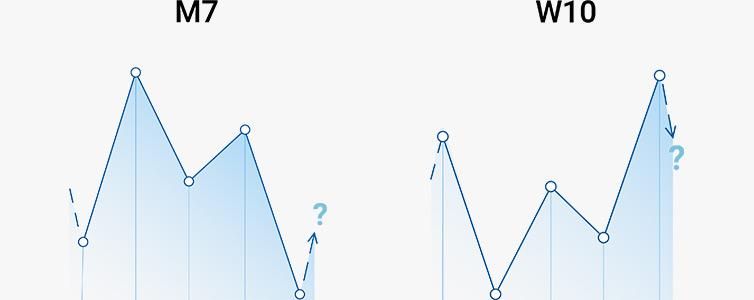
M7 and W10
The price structure of M7 is a Butterfly from harmonic trading by Fibonacci levels. In the case of the Merrill pattern, we do not add the levels, looking just at the chart instead. The aims are normally the first and second highs.
M8 and W9
M8 starts with a steep upwards movement, followed by a downward zigzag that does not renew the low, however. As soon as the price breaks through the high, we can be sure that the upwards movement continues. It slightly reminds us of the Head and Shoulders pattern.
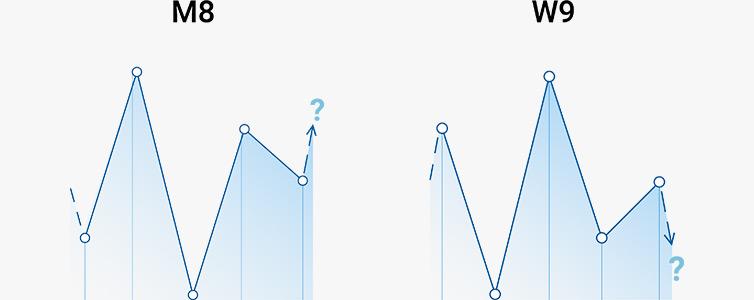
However, to be confident with the structure, you need to see the movement on the left. When the right “shoulder” is much lower than the left one, this means that sellers are weak, and the price is likely to rise. To set the goal, measure the height of the pattern from the “neck”.
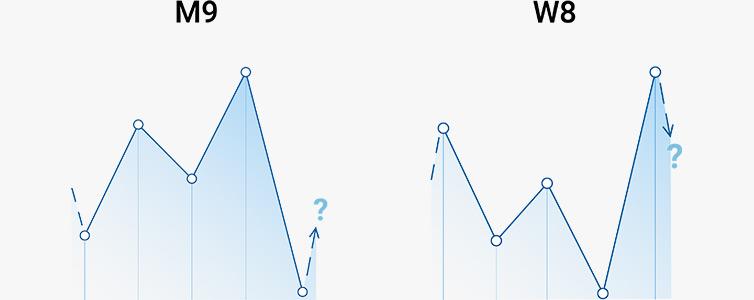
M9 and W8
In harmonic trading, M9 is called the Shark. It is an upward zigzag, followed by falling and a renewal of the low. As a rule, harmonic traders expect this point at 1.13% Fibo. After such a decline, we can expect growth to the low lying between two highs. This will be the completion of the pattern.
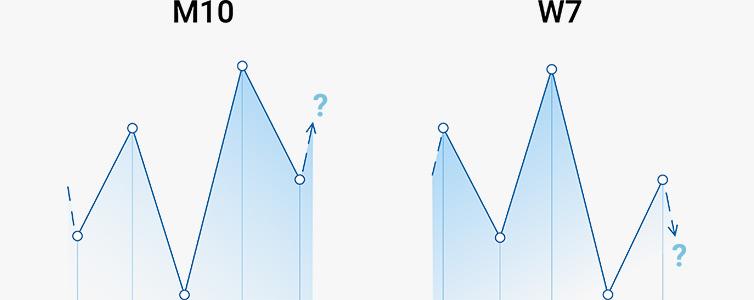
M10 and W7
M10 also reminds of an erratic Inverted Head and Shoulders pattern where traders expect not a breakaway of the “neck” but a bounce off it. Or, this structure presumes the appearance of a descending Wolfe’s Wave, in which case we also draw a resistance line through two highs and wait for the price to drop to it. To set the goal, draw a line through the first high and the low from which the price is going to grow.
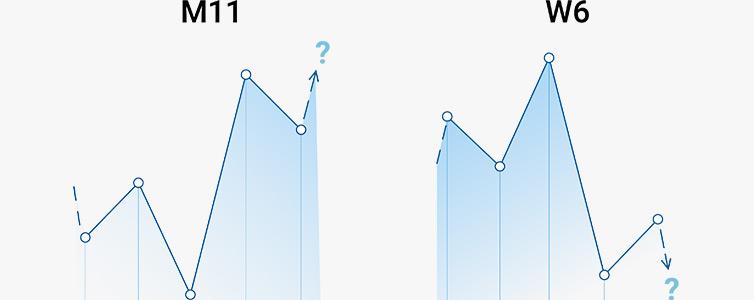
M11 and W6
At the first sight, M11 looks similar to M10 and its counterparts from classic tech analysis, but in fact, M11 is the 5-0 pattern from harmonic trading. As you see, the price shows a low, then grows significantly and corrects. Draw an ascending channel to see where the correction ends. If the price tests this border, we can be sure that the growth continues. The aim of the growth is a breakaway of the local high.
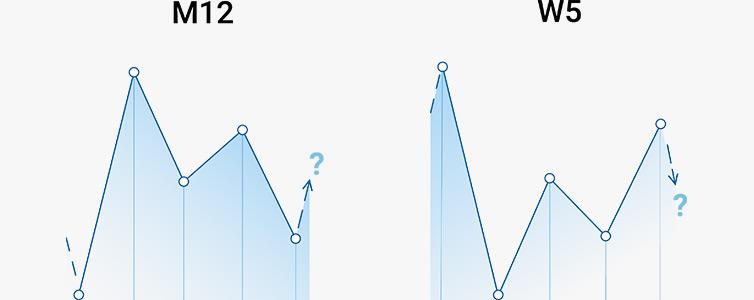
M12 and W5
This price movement is also described in harmonic trading in detail and called the Bat. The correction is to end at 88.6% Fibo. The aim of the growth is the first and second highs.


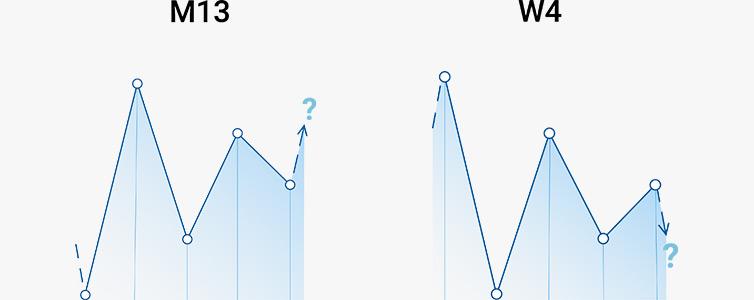
M13 and W4
M13 is the simplest Symmetrical Triangle. As a rule, such a pattern is broken away by the actual trend. Most often, traders start buying inside the pattern already and open new positions at the breakaway of the upper border of the pattern. The aim of the growth is the height of the Triangle measured from the breakaway point.
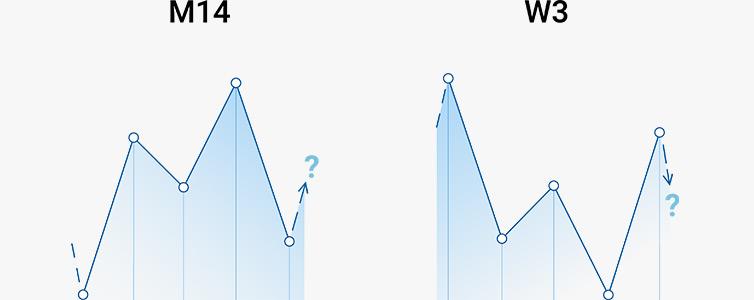
M14 and W3
M14 is very much like M9, but in his case, the price does not renew the low. We can also say that a Shark forms here. While in M9 we expect the price to bounce off 1.13%, in M14, the bounce should happen off 88.6% Fibo.
M15 and W2
M15 is very well described by Bryce Gilmore. He characterizes this one as the 1-1 pattern in a weak market because the price drops below the high. If the trend is strong, the correction might fail to reach the support level.
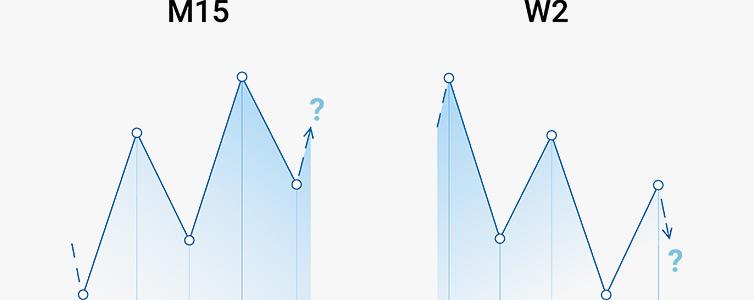
To find the point of the bounce upwards, try drawing an ascending channel. The aim of the growth here is the first movement from the low to the high that traders measure from the point of expected growth.
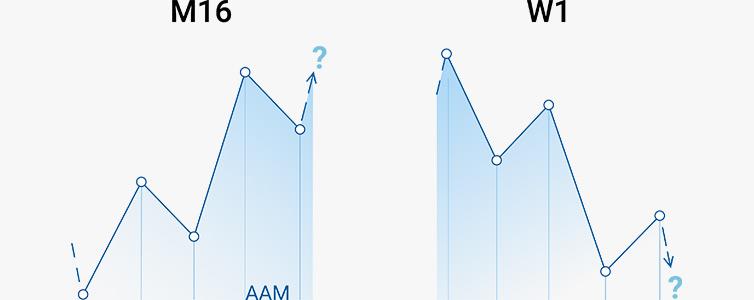
M16 and W1
M16 is a wave-like analog of Gilmore’s 1-1, only that it indicates a strong trend. Here, you can also draw an ascending channel and wait for its lower border to be tested, which will indicate further growth of the price. To set the goal, take the distance from the low to the first high and measure it from the point of expected growth.
Summary
Arthur Merrill showed a whole range of interesting patterns. These are, of course, not all of the patterns that exist but a large part of them. Some look classic, such as the Head and Shoulders or Triangle. Other patterns, such as the Wolfe’s Waves, Butterfly, or Shark, were described later with many amendments by other authors.
Some say that price patterns have worked and will keep working due to the psychology of market players only, who are propelled by greed and fear. Assets and markets can change – psychology remains.
Merrill’s patterns were described as long ago as 1980, and Triangles, regularly emerging in the relatively young market, only confirm that history repeats itself. For successful trading, you do not need to know all patterns, just two-three of them to be confident in any state of the market.


