How to Trade by the Shark Pattern?

9 minutes for reading
Shark is a price pattern that consists of five impulses and promises soon trend reversal. This pattern is a rather recent phenomenon; it was first singled out and described in 2011 by Scott M. Carney. The pattern belongs to Harmonic trading designed by Harold M. Gartley and described in his book "Profits in the Stock Market".
Shark is simular to such graphic analysis patterns as Double Top and Double Bottom, but in essense, it is an updated 5-0 pattern. Detecting reversal points in the Shark pattern requires the use of Fibonacci lines that are essential for the pattetn: without them, we cannot be sure if the pattern has formed correctly.
In this article, we will discuss the rules by which the Shark forms on the chart and the principles, by which we open positions with this pattern.
How does the Shark pattern form?
The Shark pattern consists of five points: 0, X, A, B, C — that form on the chart one after tge other. A complete pattern looks like the shark's fin or its jaws swung open; to my mind, however, this is all very individual.
Seeing all the five points in the chart, a trader might conclude that here goes the shark; nonetheless, without Fibonacci levels, you cannot be 100% sure.
How to confirm a Shark pattern by Fibonacci levels?
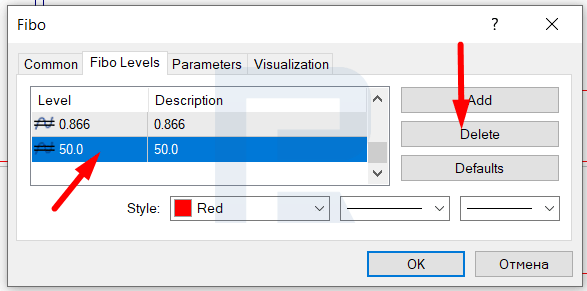
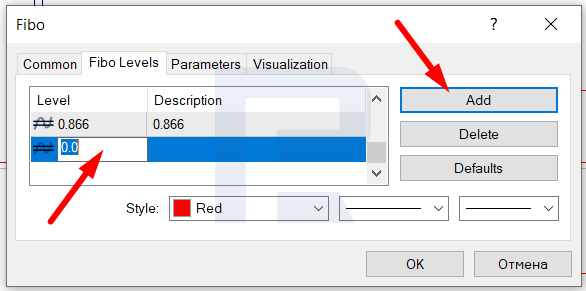
All trading terminals feature an instrument called Fibonacci Lines with basic settings, but they do not suit us. To check your presumable Shart pattern, delete all the default levels (except "0") and write in 0.866, 1.13, 1.618, 2 24. See below this settings amendments in MetaTrader 4/5:
In more detail, you can read about Fibo levels in these two terminals in the following article:
How does a Bullish Shark form?
A bullish pattern forms as follows:
As with all the patterns of Harmonic trading, the price movement starts in point 0; growth begins, setting up a high at X.
Upon testing point X, the quotations correct a little. The pullback is over in point A. Upon testing point A, the quotations form another ascending impulse and renew the highs in point B.
Upon testing point B, the quotations start another correction that comes to an end in point C. This is the largest declining wave.
Ckecking the bullish Shark by Fibo
To check the pattern by Fibo, do the folowing:
Drag the Fibo grid from point X to point A. We need point B to get within 1.13-1.618. If point B is above or below this range, further analysis of price movements on the chart becomes useless.
Then drag the grid from point 0 to point B. Point C must get between levels 0.899-1.13. If this does not happen, the pattern is considered broken. Double-check point C by dragging the grid from point A to point B. In this case, point C must get within 1.618-2.24.
Only when these requirements are fulfilled, the Shark is complete.
How does a bearish Shark form?
A bearish Shark pattern forms in a mirror-like wave:
Price movement starts in point 0; a decline begins, setting a low in point X.
Upon testing point X, the quotations form a minor correction, and the pullback ends in point A. Upon testing point A, the quotations form another descending impulse, renewing the lows in point B. Upon testing point B, the quotations begin another correction that ends in point C. This wave of growth is the largest of all.


Checking the bearish Shark by Fibo
In this case, the rules of dragging the Fibo grid are the same as with a bullish Shark:
Point X-point A: point B must get within 1.13-1.618. From point 0 to point B: point C must get within 0.899-1.13. Point A-point B: point C must get within 1.618-2.24. Only when these rules are followed, the pattern is considered complete.

How to trade by the Shark pattern?
In my practice, you can disregard the strict rules in certain cases and ignore the position of point B, which means it can be out of the 1.13-1.618 range. With point C, this does not work: it must lie within the two ranges.
Opening a buying position
To open a buying position, find a newborn pattern at the chart; choose a timeframe over M15 because smaller ones give a lot of false signals.
On the chart below, you can see the quotations form two highs, the second one being hgher than the first one — this might be the beginning of a Shark pattern.
What to do next:
- Mark points 0, X, A, B on the chart.
- Drag the Fibo grid from point X to point A and check the placement of point B: it must be within 1.13-1.618. This is our case.
- A bit later, the price starts going down and forms a reversal right after approaching the support — point C appears here.
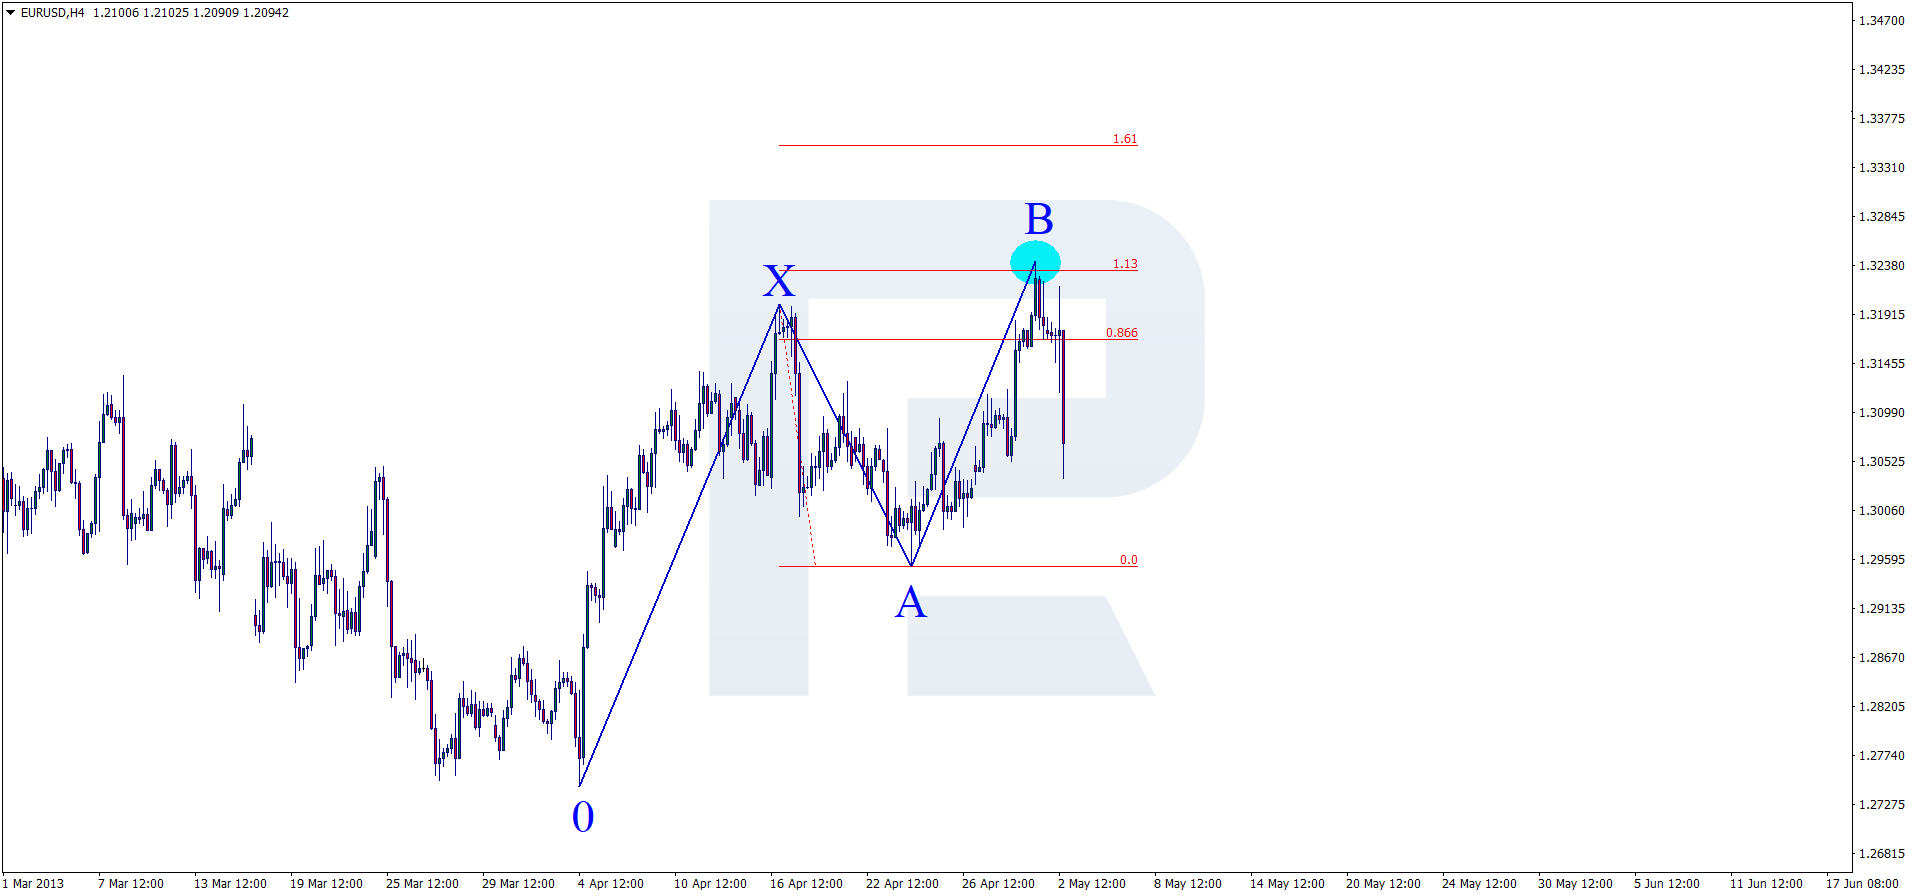
4. Drag the Fibo lines from point 0 to point B: point C must lie within 0.86-1.13 at this checkup. In our case, it is exactly 0.86, which goes by the rules.
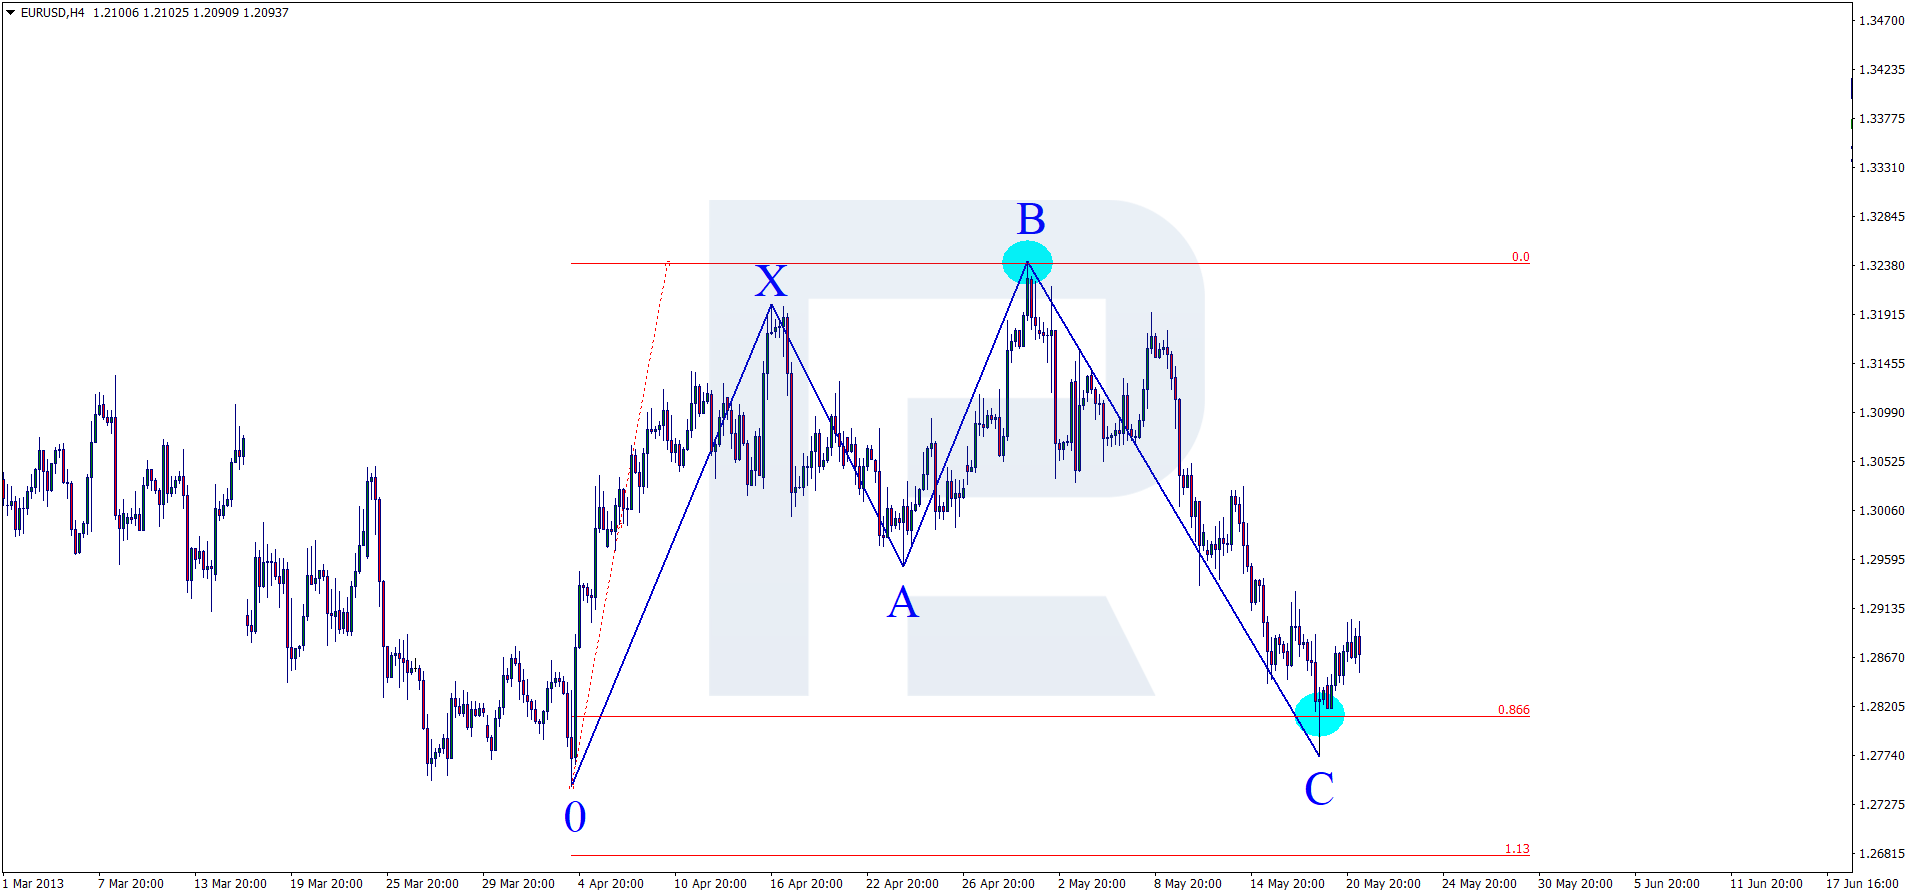
5. Check the position of point C again. This time, drag Fibo from point A to point B: the price touches 1.681, which means point C is situated correctly.
6. When a bounce off 1.618 is forming, open a buying position.
7. Place a Stop Loss behind the nearest low, which, in our case, is point C.
8. The initial landmark for a Take Profit will be at 50% of the distance from point A to B. The next goal is the level of point B.


Opening a selling position
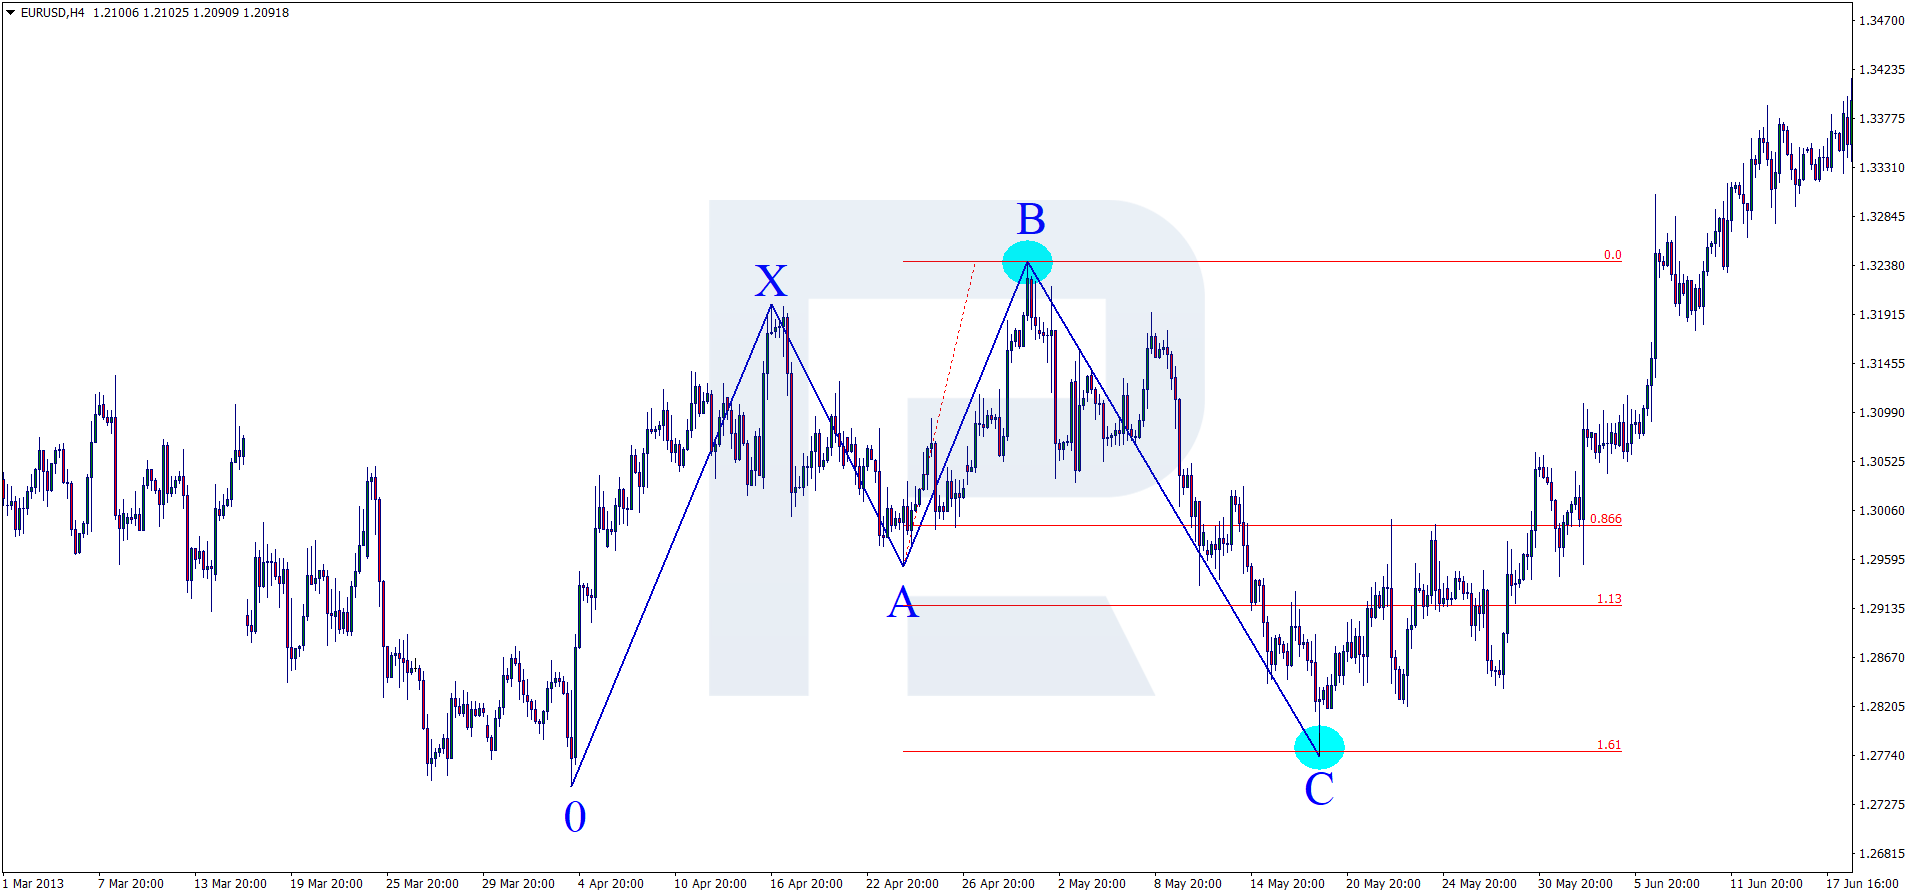
On the chart below, we can see the quotations form two lows looking like a tech analysis pattern Double Bottom only that the second low is much lower than the first one. This might be a Shark forming.
On we go:
- Mark points 0, X, A, and B on the chart.
- Drag the Fibo lines from point X to A. Point B must be within 1.13-1.618, which is exactly what happens in our example.

3. A bit later, the price starts growing and, having approached the resistance level, it starts reversing — mark point C there.
4. Drag Fibo lines from 0 to B: at the first measurement, point C must get within 0.86-1.13. In our case, it works.
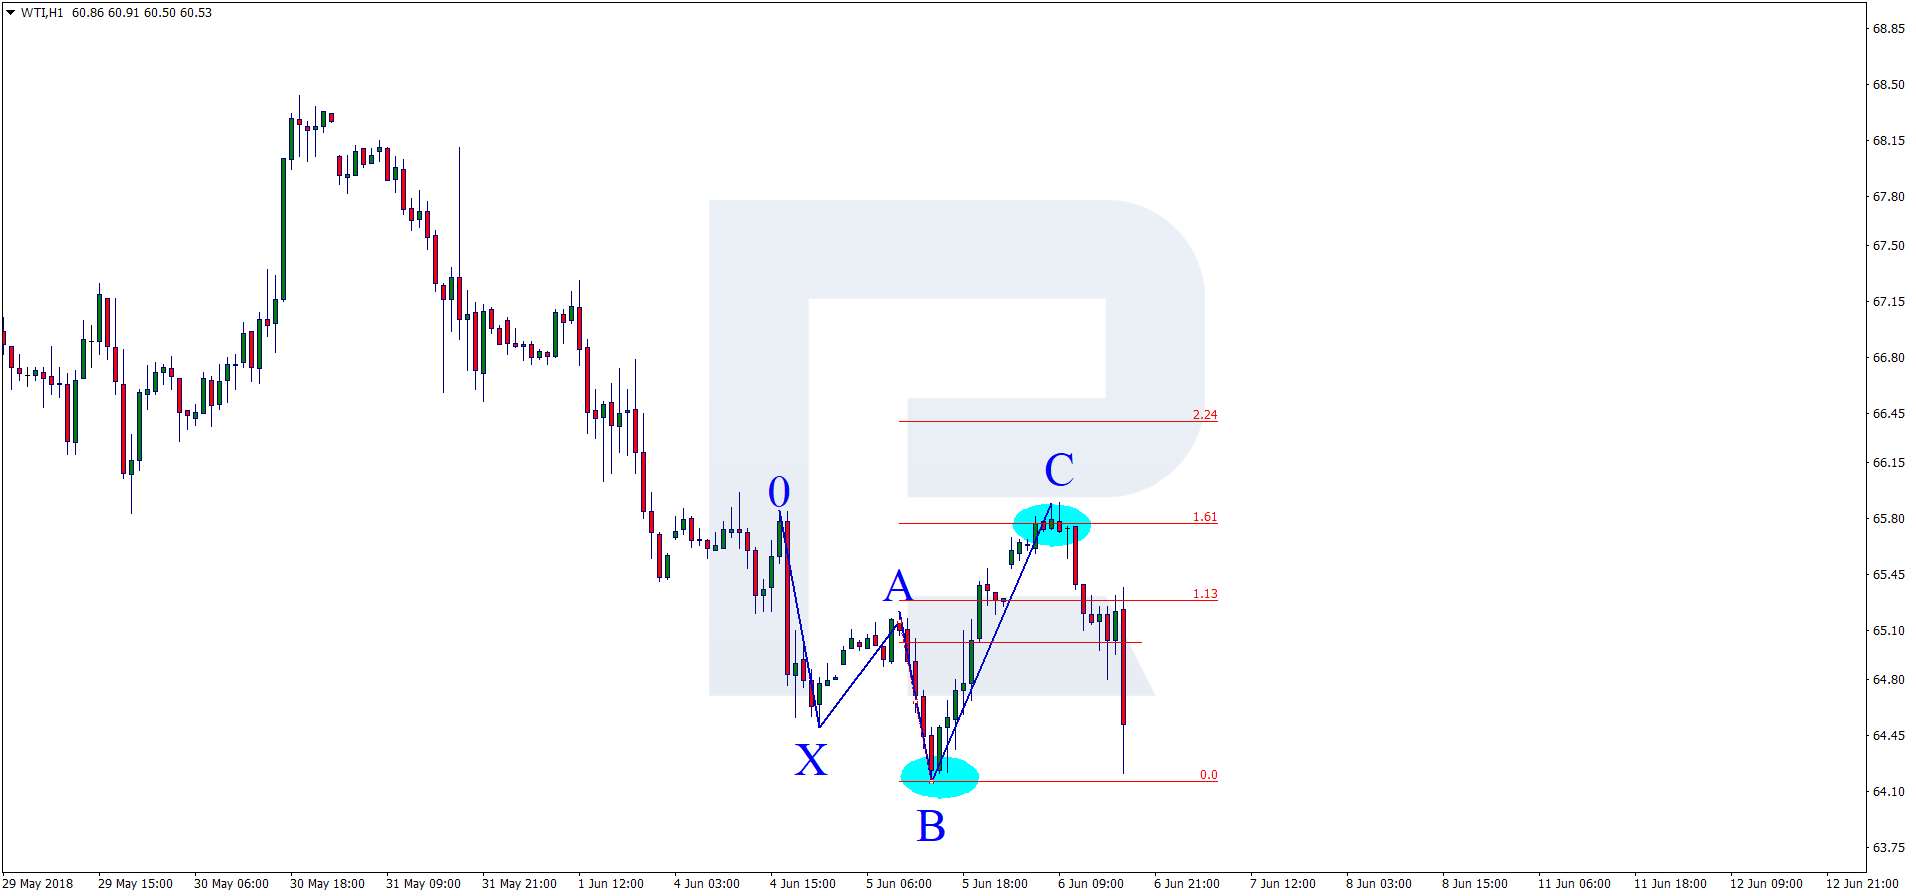
5. Check point C by Fibo for the second time, dragging Fibo from A to B: the price touches 1.681, confirming that C is positioned right.
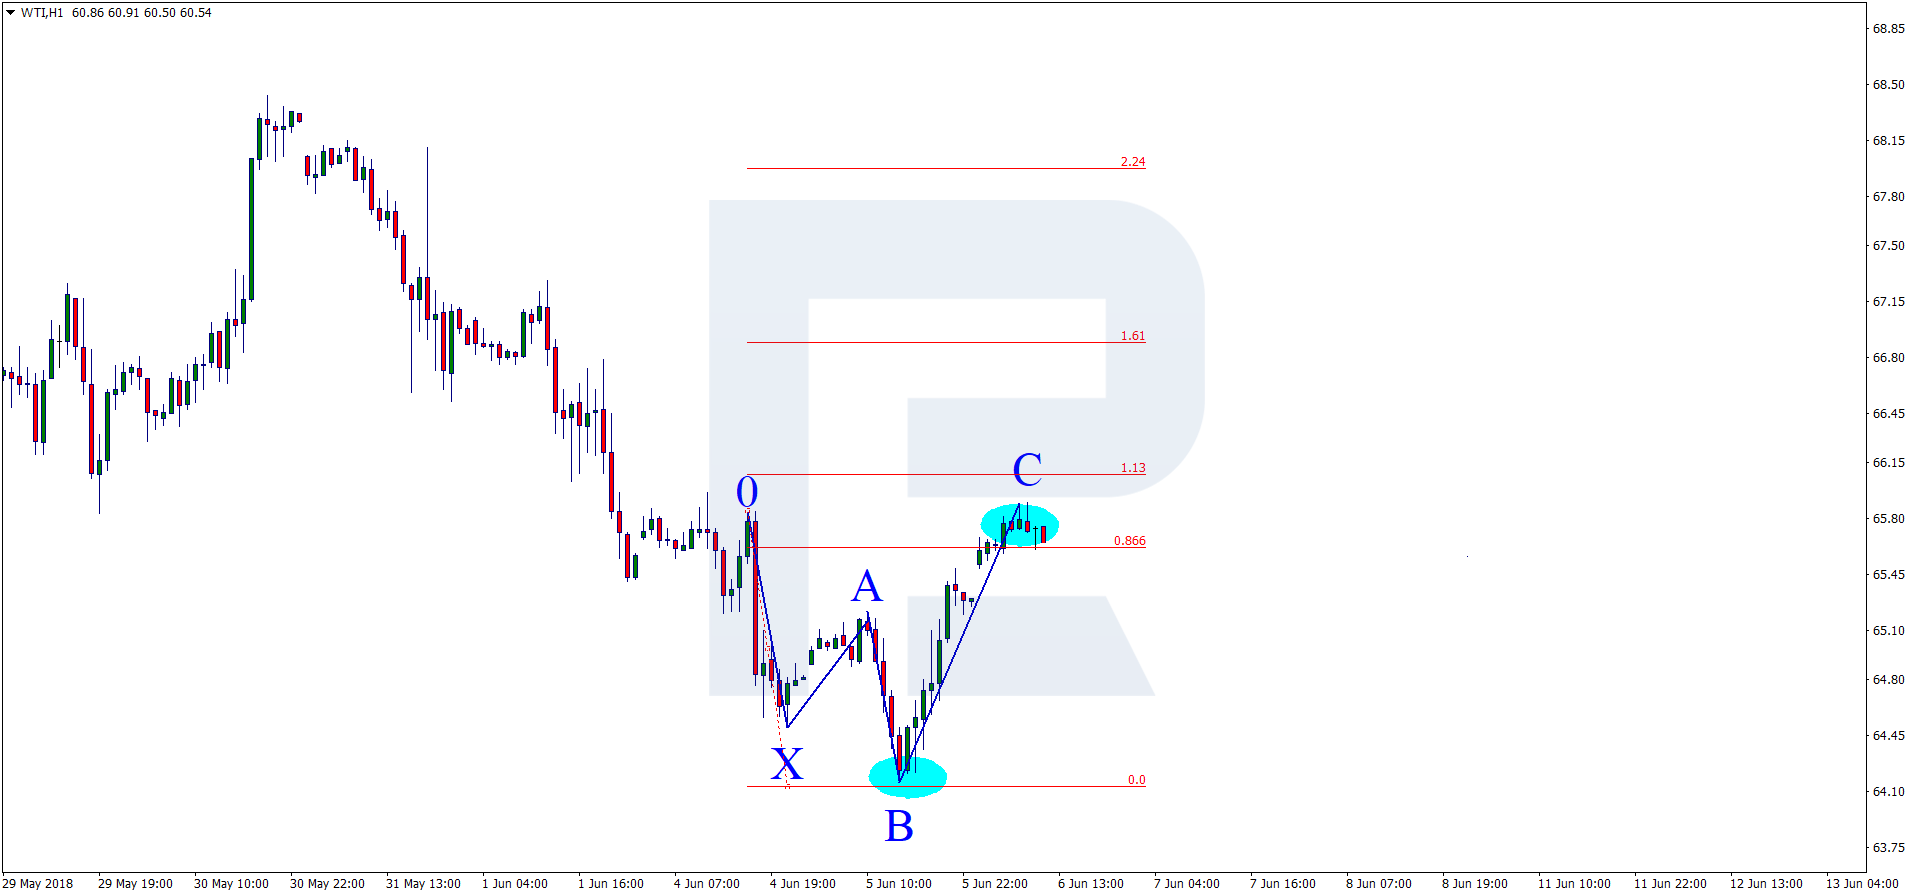
6. When a bounce off 1.618 is forming, open a selling position.
7. Place a Stop Loss behind the nearest high at the level of point C.
8. The initial landmark for a TP in this case also is at 50% of the distance from A to B. The next goal for the TP is point B.
Bottom line
The Shark pattern has been singled out not so long ago but has won the hearts of many traders. At first glance, detecting it on the chart might seem complicated but if you put some effort in it and gain experience, you will start checking it much faster and use the Shark for analyzing the market successfully. However, do not forget about money management and open positions consciously.


