How to Trade Intraday with Keltner Channel?

7 minutes for reading
In this overview, I will present to you the main principles of trading with the Keltner Channel indicator. This indicator forms a price channel on the chart that we will use for intraday trading.
What is Keltner Channel based on?
Keltner Channel is a popular trend indicator that can be used for evaluating the current trend and searching for trading signals. The indicator was created by a trader Chester W. Keltner in the 1960s; later (in the 1980s) Linda Bradford Raschke used a modified version of this indicator.
In Keltner Channel, we use a combination of medium-day volatility (the ATR indicator) and a Moving Average (SMA or EMA). The indicator consists of three lines: the upper, lower, and middle ones. These lines go alongside the quotations, creating a dynamic price channel. The working principle is similar to those of other channel indicators: Envelopes and Bollinger Bands.
On the price chart, the moves of quotations in the Keltner Channel look as follows:
- When the asset is in an uptrend, the quotations regularly reach the upper border of the indicator and break through it. Most of the time, the price rests above the lower line of the channel and sometimes descends to the middle line.
- When the financial instrument goes in a downtrend, the quotations regularly reach and cross the lower line of the price channel. Most of the time, the price rests below the upper line of the channel and sometimes corrects to the middle line.

Installing and setting up the indicator
Keltner Channel is not a standard indicator, which means you need to download the installation file and install the indicator to your terminal. You can download the file for MetaTrader 4 via a link at the end of the article.
To install Keltner Channel to MetaTrader 4, copy the file with the indicator into the folder Indicators. Via the Main menu, go to File/Open data catalog/MQL 4/Indicators – copy the file into the folder and restart the terminal.
As a result, Keltner Channel will appear on the list of user indicators, and you will be able to install it to the desired chart via Insert/Indicators/User/Keltner Channel. Alternatively, left-click the indicator in the Navigation window and drag it to the chart.
The indicator is calculated as follows:
- Middle Line = SMA with the set period.
- Upper Line = SMA+ATR, a Moving Average shifted upwards for the width of average volatility.
- Lower Line = SMA-ATR, a Moving Average shifted downwards for the width of average volatility.
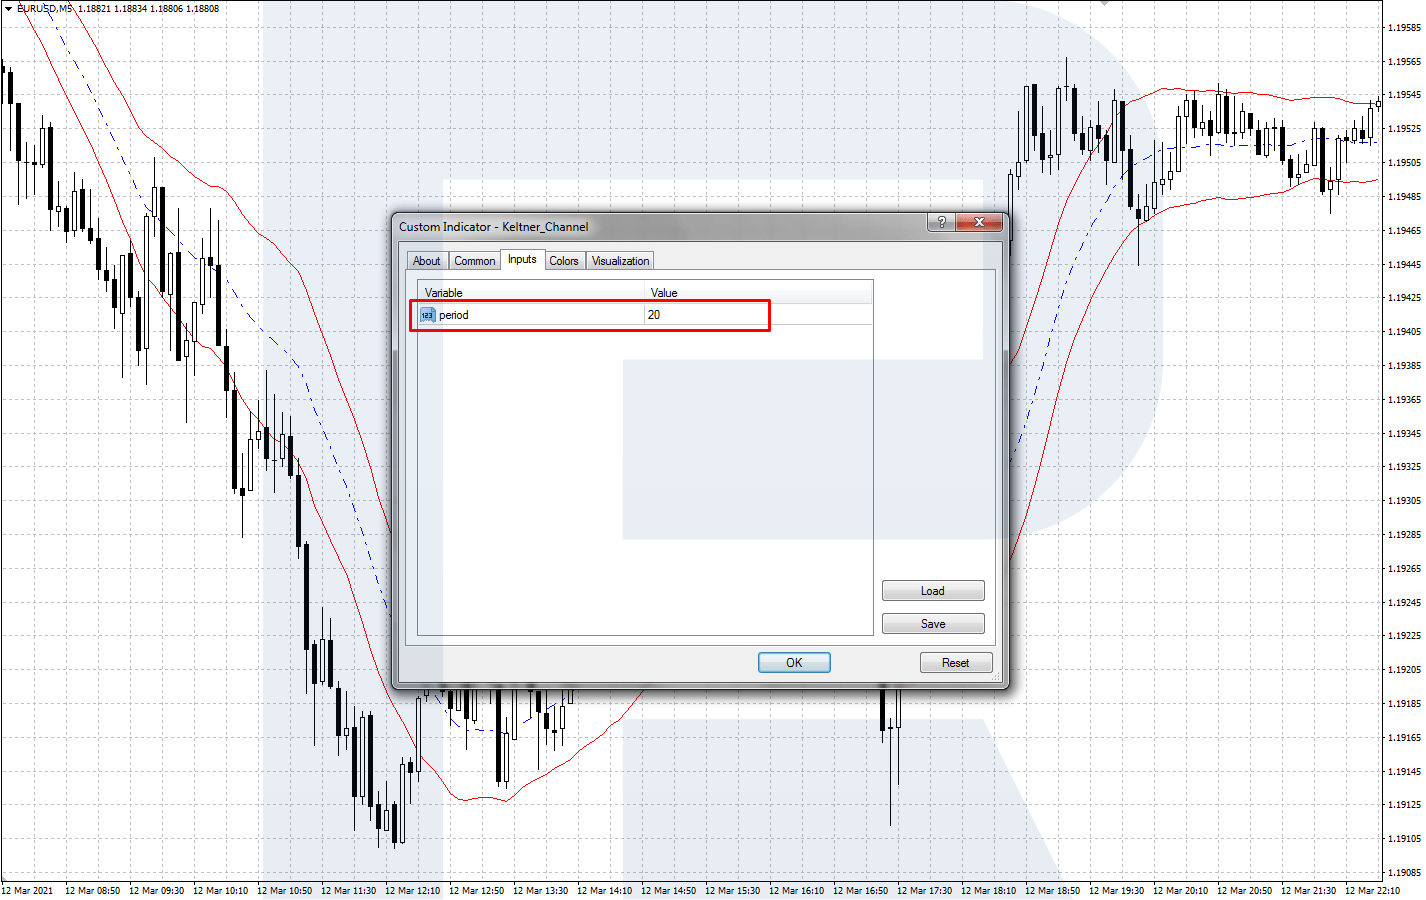
Customizable settings:
- Period (the number of candlesticks on the price chart by which the borders of the channel are set); for intraday trading, choose 20.
In this article, we overview the standard version of the Keltner Channel. On the Internet, you can find several versions of this indicator with extended settings: an increasing factor for the ATR, customizable settings for the MA, etc. If you are interested, you can play with various settings.
Trading intraday by Keltner Channel
For trading intraday with Keltner Channel use small timeframes from M1 to H1. There are two main signals: a bounce off the middle line of the channel and a breakaway of the borders.
A bounce off the middle line
The gist of trading by this signal is to open buying/selling positions in an uptrend/downtrend when the price corrects to the middle line. You should only trade the trend: use a bounce upwards in an uptrend and a bounce downwards in a downtrend.
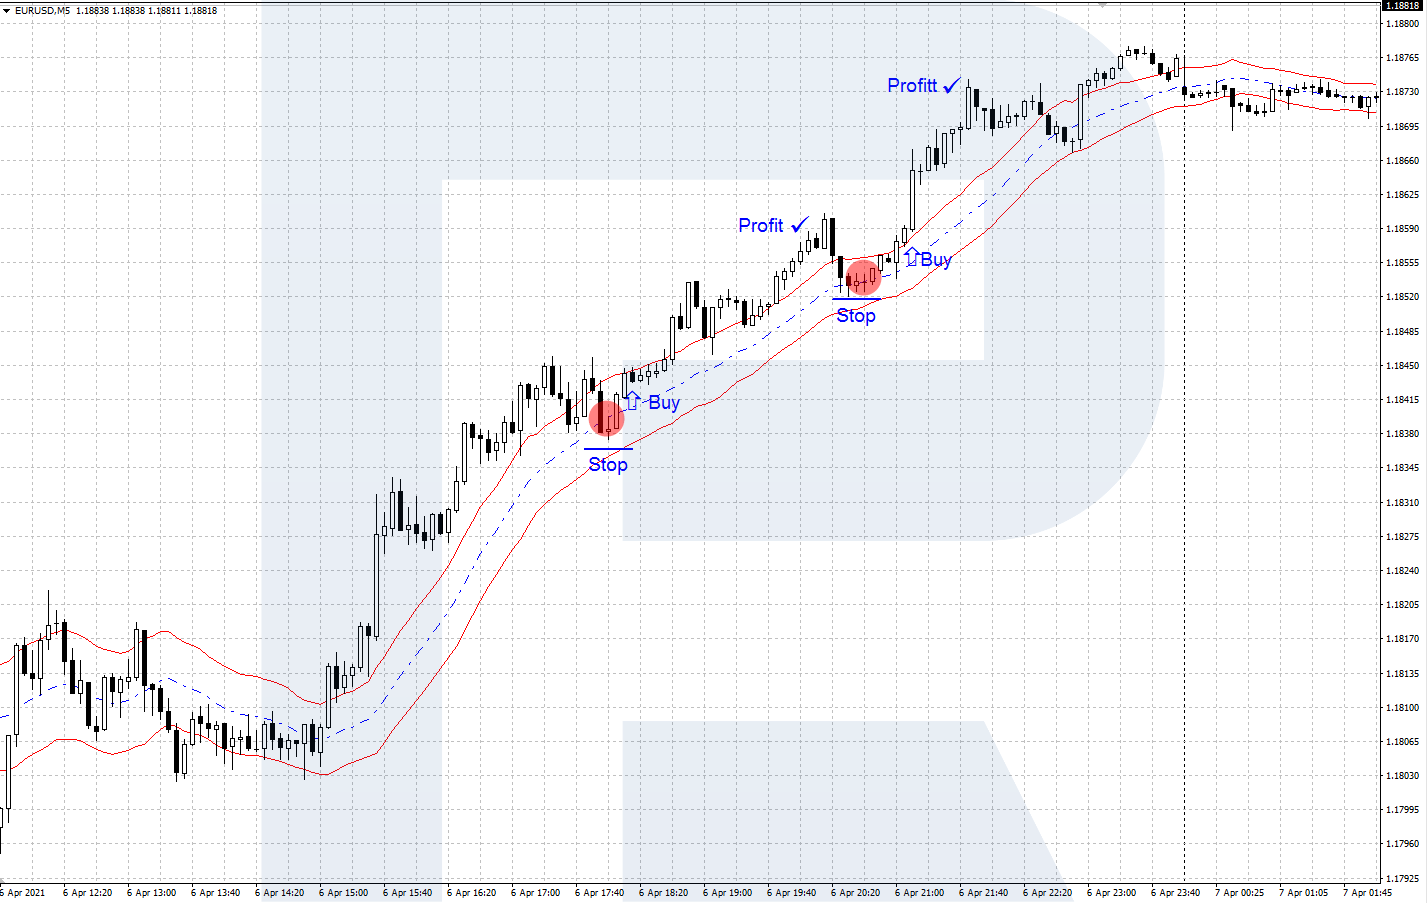
A signal to buy
- The signal appears after the price bounces off the middle line upwards in an uptrend.
- After the correction to the middle line, the price must form a local low and reverse upwards.
- After a reversal upwards, open a buying position, placing the Stop Loss behind the local low.
- You can take the profit after the price passes a double length of the SL or when a reversal downwards forms.
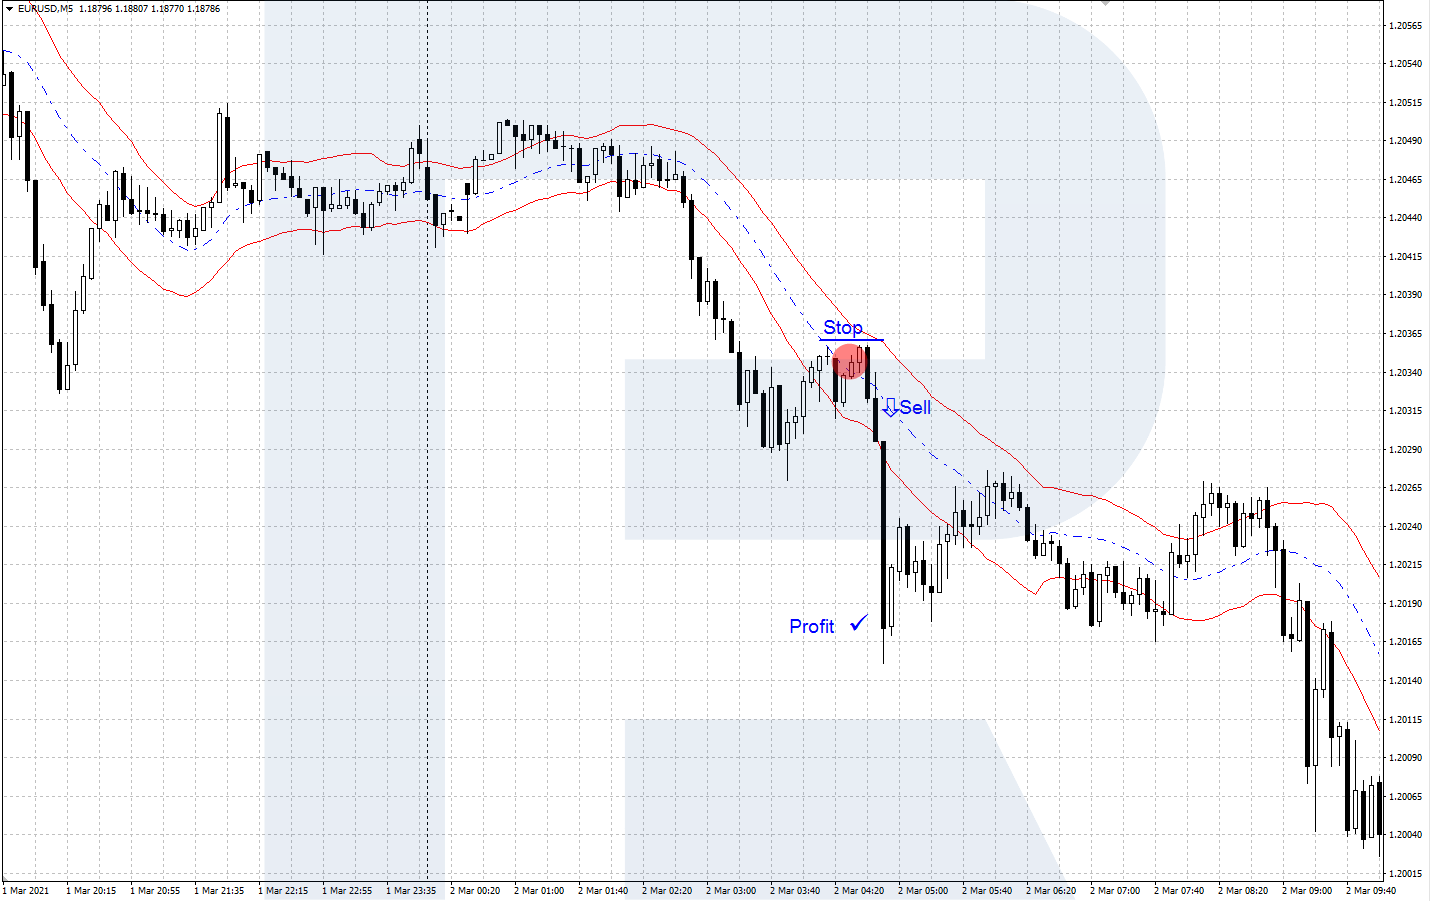
A signal to sell
- The signal appears after the price bounces off the middle line downwards in a downtrend.
- After the correction to the middle line, the price must form a local high and reverse downwards.
- After a reversal downwards, open a selling position, placing the Stop Loss behind the local high.
- You can take the profit after the price passes a double length of the SL or when a reversal upwards forms.
A breakaway of the channel border
You can trade by this scheme when a move up- or downwards starts on the price chart. Thanks to a directed impulse, the price escapes a flat and the channel borders.
A signal to buy
- The signal appears after a steep price move upwards, out of a flat and the upper line of the price channel.
- After a candlestick closes above the upper border of the indicator channel, open a buying position with an SL behind the local low.
- Take the profit at the triple length of the SL, when the price reaches a strong resistance level, or if it reverses and crosses the lower border of the channel.

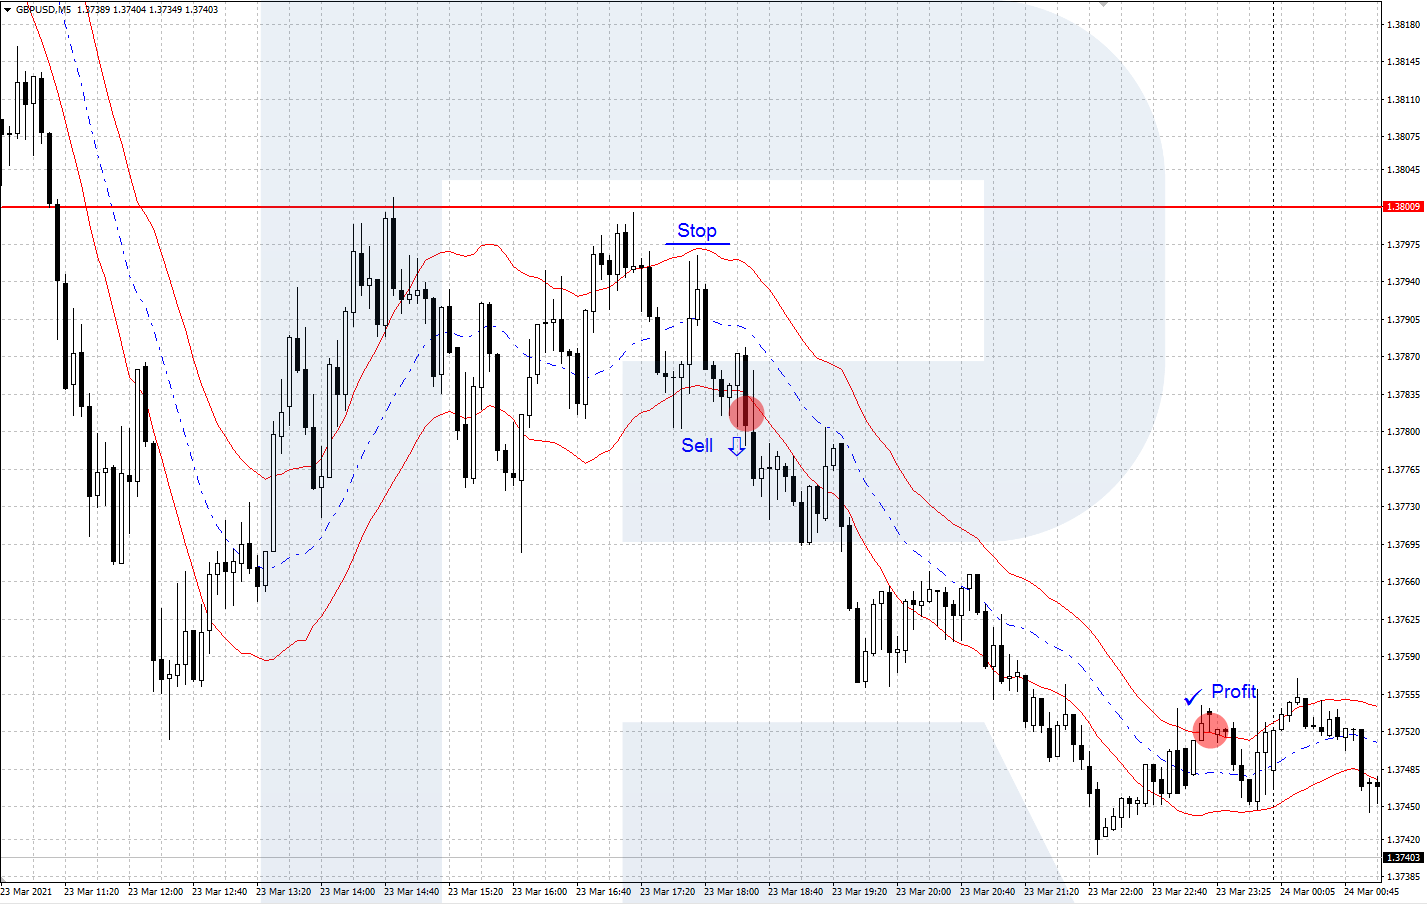
A signal to sell
- The signal appears after a steep price move downwards, out of a flat and the lower line of the price channel.
- After a candlestick closes below the lower border of the indicator channel, open a selling position with an SL behind the local high.
- Take the profit at the triple length of the SL, when the price reaches an important support level, or if it reverses and crosses the upper border of the channel.
Bottom line
The Keltner Channel indicator forms a price channel on the chart that is used for finding trading signals. To make trading signals more efficient, you can use Keltner Channel alongside other indicators, price patterns, and Price Action.
In more detail, read about the indicator in Chester Keltner’s book "How To Make Money in Commodities".


