What is Pairs Trading and How to Use It?
7 minutes for reading
Pairs trading is a market-neutral trading strategy that implies buying and selling similar (correlating) trading assets simultaneously.
This method is equally valid for the currency, stock, and commodity markets. The hardest part of this method is choosing the type of assets.
In this article, I will tell you about the main principles of pairs trading, describe basic ways of choosing your instruments, and give examples of using the strategy in the real market.
What is the gist of pairs trading?
Pairs trading is a method based on trading two correlating financial instruments simultaneously in opposite directions.
Correlation is a statistical link between two or more values (assets). It can be direct and inverse. In the first case, one asset basically repeats all the movements of the other one. If the correlation is inverse, the charts of two instruments are mirror-like.
As an example of direct correlation, take the behavior of oil prices and stock prices of oil companies. When oil prices grow, stocks also grow. And vice versa: when oil prices are falling, correlation will stay in place, only in the opposite direction.
However, each oil company will grow or fall in its own way, faster or slower. This temporary divergence of prices can be used for pairs trading.
The strategy of pairs trading uses the principle of balance: it presumes that divergences of correlating instruments tend to return to their average values. Such divergences happen after some important fundamental events: changes in interest rates by Central banks, corporate events, etc.
To trade by the strategy, find a highly correlating pair of financial instruments, one of which has grown/fallen compared to the other. We expect the correlation to restore with time, after which you will close the position.
How to choose instruments for pairs trading?
Choosing assets for this strategy implies using fundamental and technical analysis, as well as statistical calculations. On the whole, you can start to look for instruments for pairs trading among:
- The stocks of companies of one market sector;
- Contracts for similar instruments: Brent and WTI oil, gold and silver, etc.
- Interconnected currencies.
A popular way to evaluate interconnection of two instruments is Pearson’s correlation coefficient. The higher it is, the more it is possible that they will be moving in one direction. Also, we use the notion of cointegration, which is a statistical property of two or more variables that demonstrates the stability of their interrelation.
In this article, I will try not to overwhelm you with mathematical calculations, opting for choosing the assets by graphic analysis. However, mind that this is just one way of choosing instruments for graphic trading, and not the most precise one.
To get started, display the chosen instruments on one chart. To do it on the MetaTrader 4 trading platform, you will need to find and install special scripts and indicators. But also, you can use ready-made Internet resources, such as TradingView.
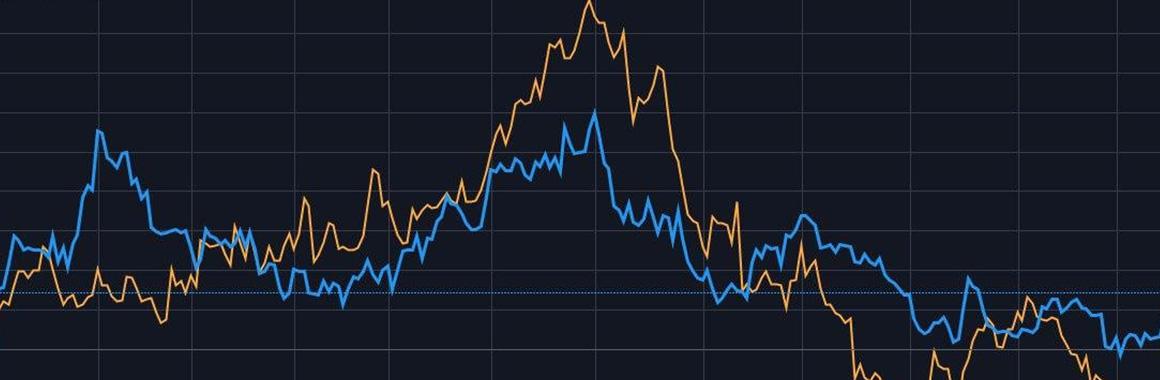
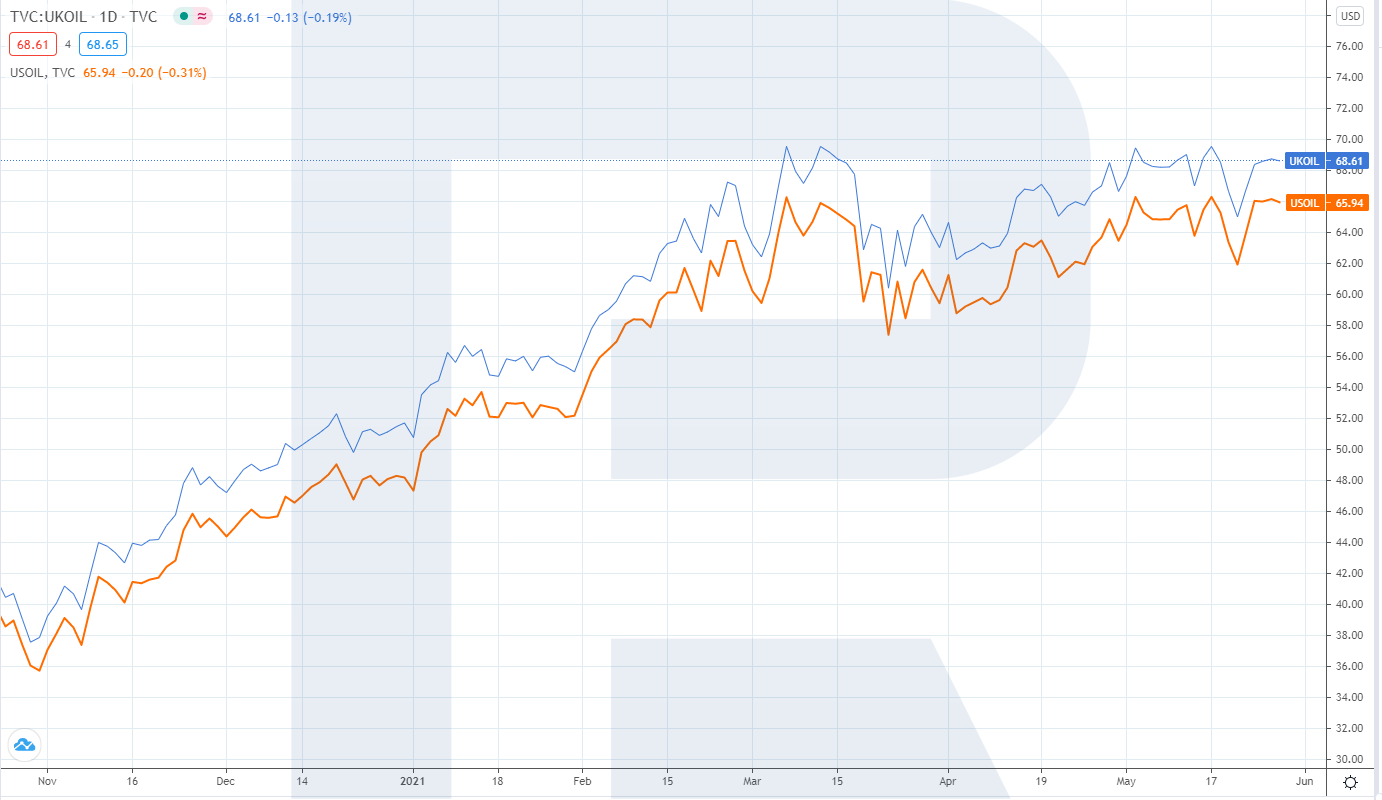
Uniting two assets on one chart, we can assess the correlation visually on the chosen timeframe. The change in asset prices – the spread – is the main landmark for your trading decisions. Take its average value and use the deviations (convergences or divergences). In the picture below, there are two instruments on one chart – Brent and WTI oil.
Examples of using pairs trading
Stock market
Pairs trading can be used for trading stock indices and the shares of companies working in one or connected sectors of economy. Some events can violate the correlation of such assets, for example, signing large contracts or designing new products. Also, the general stock market sentiment influences the correlation significantly.
Example:
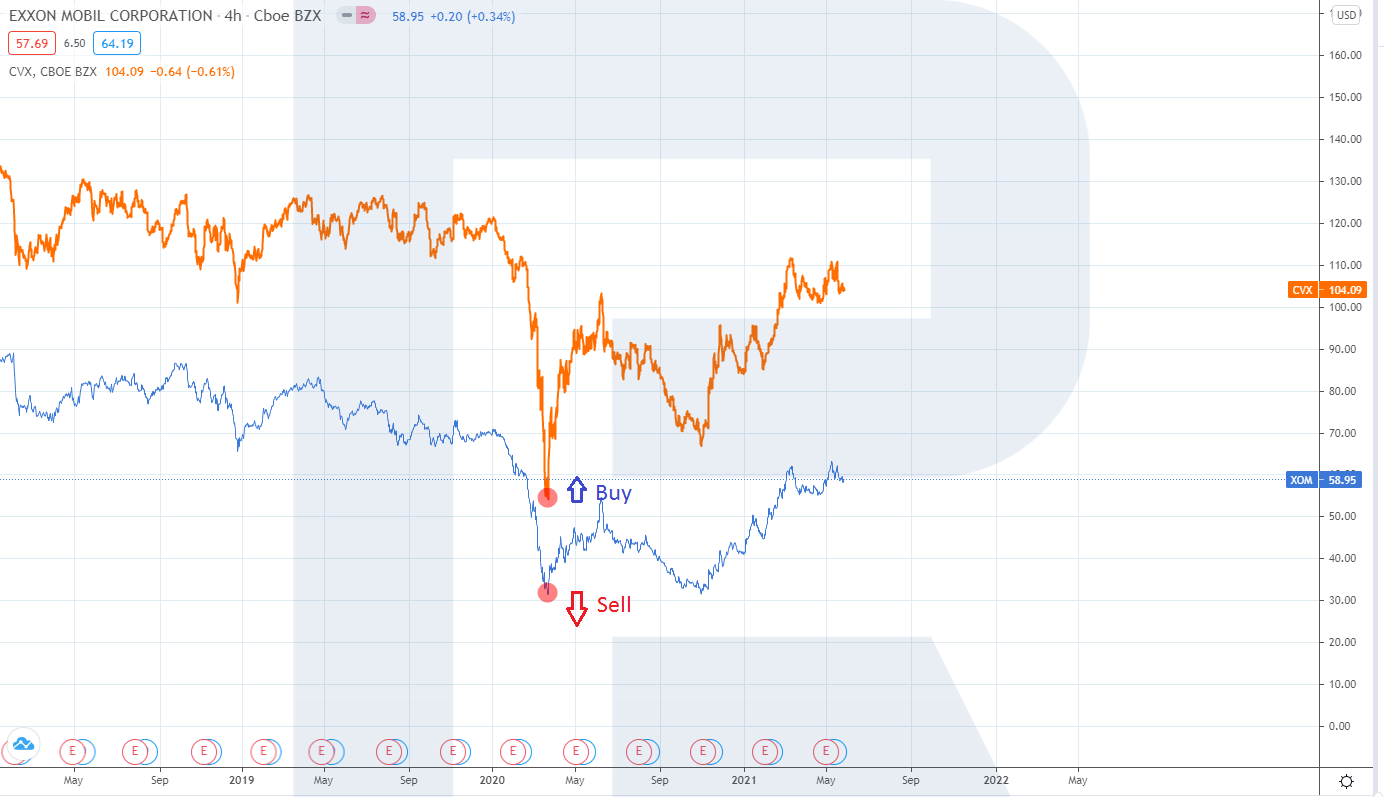
- On the chart, there are the quotations of the stocks of two oil companies: Exxon Mobil (NYSE: XOM) and Chevron (NYSE: CVX).
- The history of these stocks shows high correlation; an average spread of this pair is $40.
- At the beginning of 2020, while the stock market was falling and the spread of oil prices narrowed two times, to $20. At that moment, you could buy some Chevron shares and simultaneously sell the same number of Exxon Mobil, expecting the spread to return to its average values.
- Two-three months later, the spread returned to its average value of $40; closing all your position could bring you $20 per 1 share.
Commodity market
For pairs trading, you can choose contracts for similar commodities, such as oil and nature gas, gold and silver. Also, you can use different types of contracts for the same commodity.
Example:
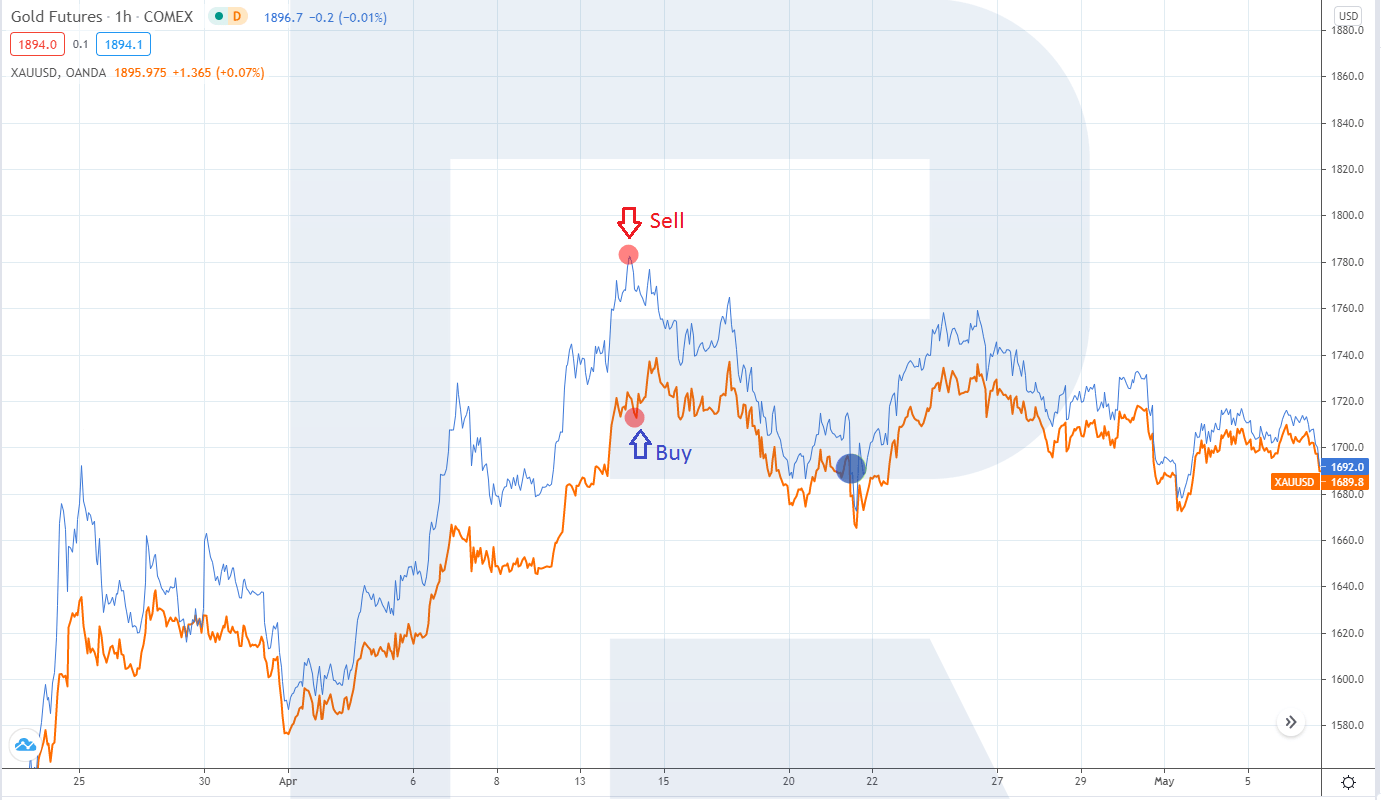
- On the chart, you can see the quotations of a spot contract for XAU/USD and a futures for GC gold.
- Contracts have very high correlation; usual spread is about $10.
- Last year, due to the crisis, the spread was abnormally high - $60. You could sell the leading GC futures and simultaneously buy the same number of XAU/USD spot contracts.
- Two weeks later, the spread returned to $10; closing both positions would bring you $50 per stock of profit.
Forex
For pairs trading in Forex, you will need two correlating currency pairs. For example, EUR/USD and GBP/USD have positive correlation. However, this dependence is unstable, which means the quotations can diverge significantly and stay away from each other for a long time. In essence, trading the spread between EUR/USD and GBP/USD is like trading their cross-rate – EUR/GBP. When there is a stable trend in EUR/GBP, the correlation between EUR/USD and GBP/USD gets violated.
Example:
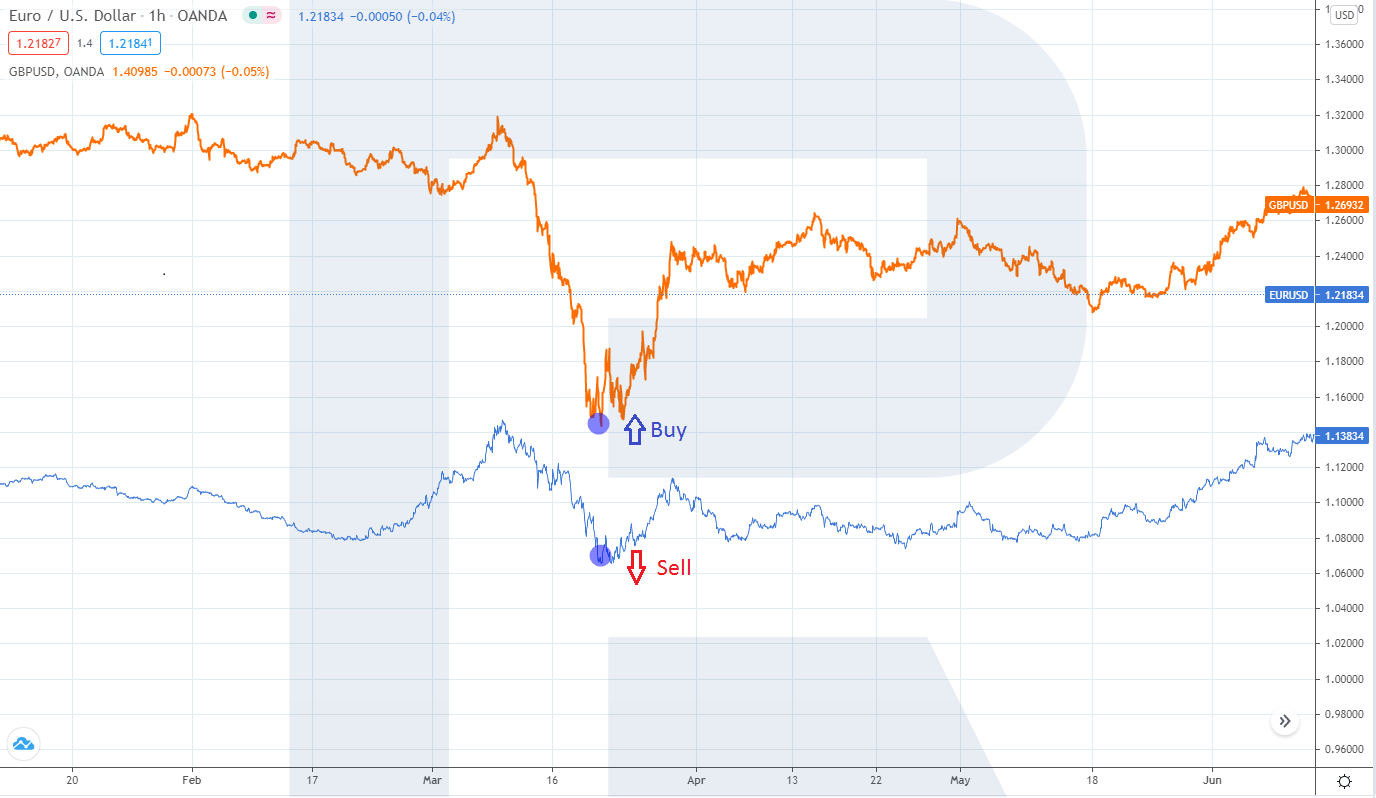
- In the chart, there are the quotations of EUR/USD and GBP/USD.
- These pairs correlate moderately, an average spread on the chart is about 0.1500, which is 1,500 points.
- Last year, when markets were falling, and investors were fleeing to protective assets, the spread narrowed two times – to 0.0750, or 750 points. At that moment, you could buy GBP/USD at a serious decline and simultaneously sell the same volume of EUR/USD.
- A month later, the spread returned to 0.1500, and closing both positions would bring you 0.0750, or 750 points of profit.
Risk management in pairs trading
As with any trading strategy, you will need risk management in pairs trading. And thought the position is market-neutral, unexpected news influencing one or the other asset, can change the speed and direction of the spread movement abruptly. Hence, formulate the criteria of risk-management in advance.
As long as the strategy depends on the change of the spread, placing a Stop Loss for each instrument is invalid. As one option, you can trail the overall loss for both positions. You need to set an acceptable loss size for per trade (such as 3% of your capital), and if the overall loss reaches this value, close the positions.
Bottom line
Pairs trading is a popular market-neutral strategy. It seems simple at first glance only. To succeed, a trader will need to find suitable instruments, use statistics, and choose optimal moments for trades.
Also, stick to risk-management rules. Before risking your real capital, test the strategy and your skills on a demo account.


