Top-7 Oscillators for Trading

6 minutes for reading
Trading indicators have long become useful instruments in traders’ work. This article is devoted to seven popular oscillators that help detect the current market situation and give signals for opening and closing positions.
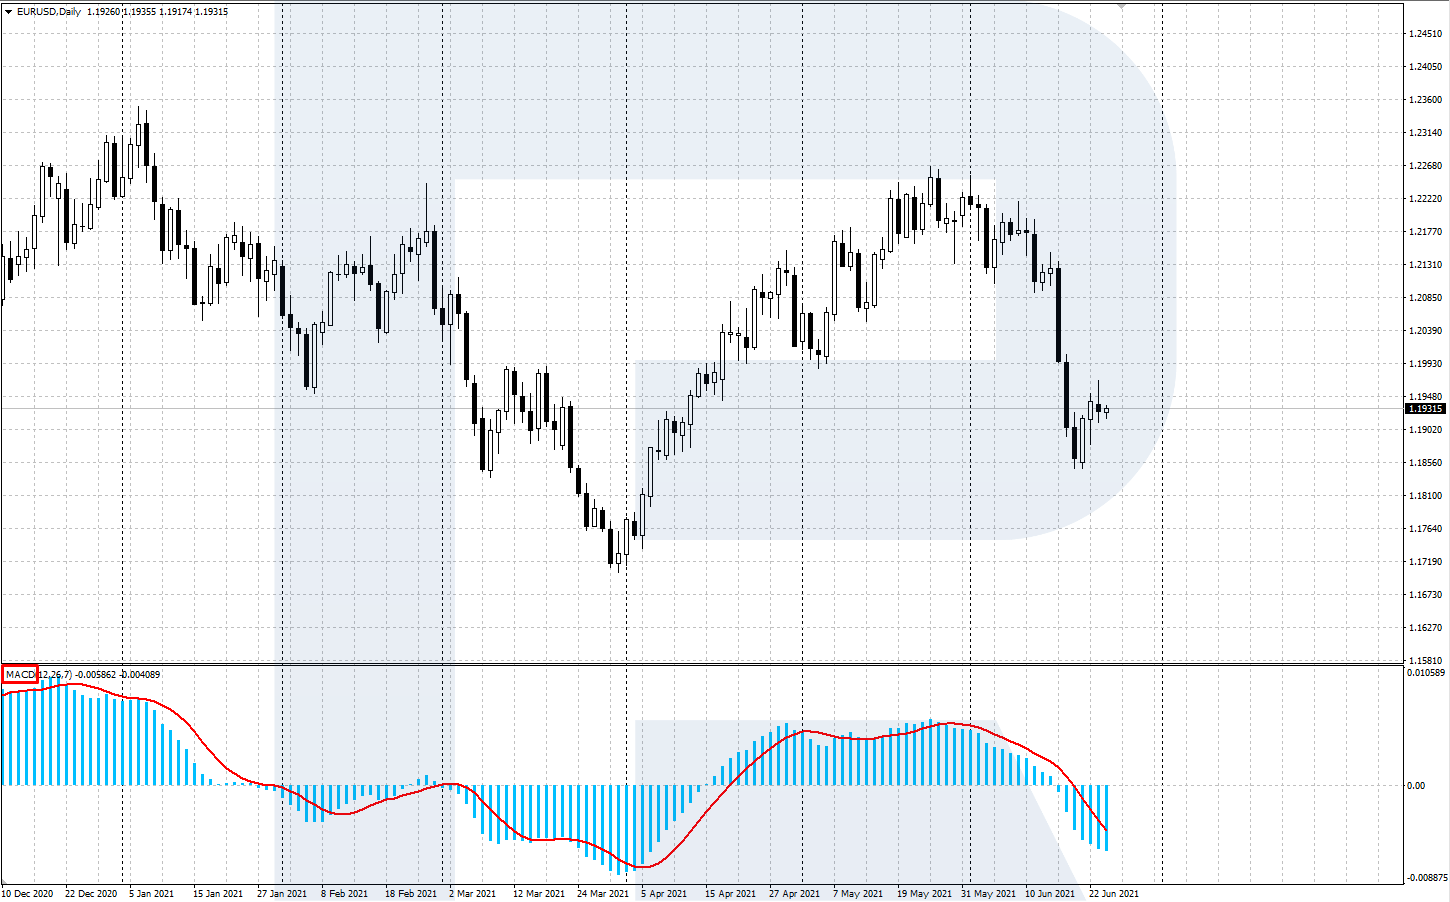
1. The MACD (Moving Average Convergence/Divergence)
MACD is one of the most popular oscillators. It was created by a famous trader and analyst Gerald Appel. As the name of the indicator tells us, the indicator is comprised of several MAs with different parameters.
The indicator is calculated in a separate window on the terminal desktop and consists of two lines, one of them presented by a bar histogram. A trading signal is basically a crossing of the two lines or a divergence of their extremes (highs and lows) with the price chart. A divergence might be predicting a correction or even a trend reversal.
Read more about the characteristics and the ways of using the indicator by the link below 👇
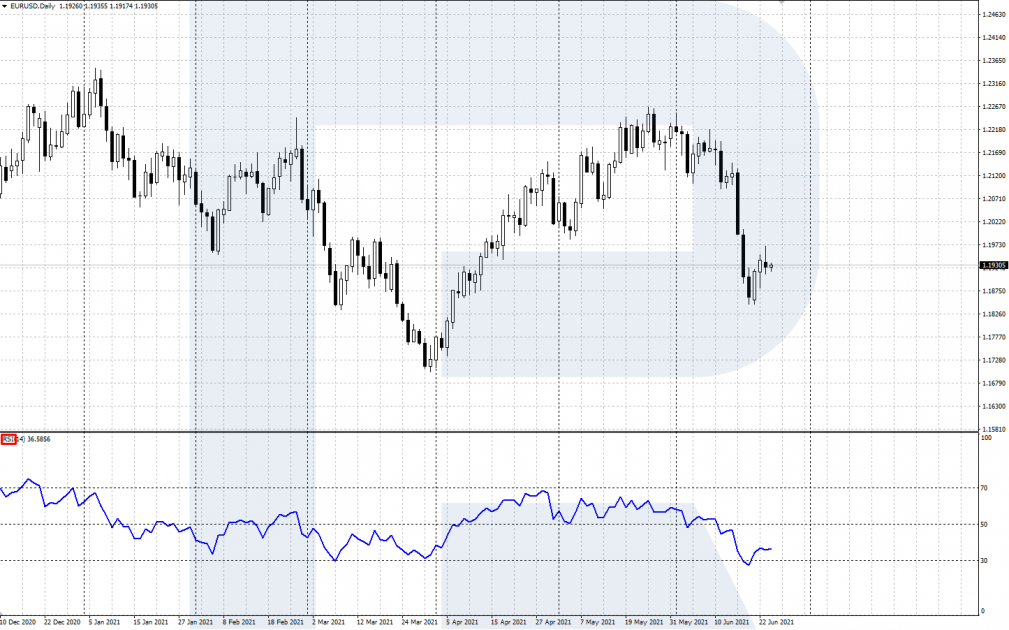
2. RSI (Relative Strength Index)
RSI is a normalized oscillator. The developer and popularizer of the indicator is J. Welles Wilder.
RSI shows the position of current prices compared to the previous period. It has become a great option for trading flats as it shows how much the price has deviated from its average.
RSI is displayed in a separate window under the chart of your asset. Trading signals are generated by levels 30, 50, and 70. The area above 70 is called overbought. There signals to sell appear. The area below 30 is called oversold, and there signals to buy emerge. If there is a bright trend in the market, use RSI by the trend only.
Read more about the characteristics and the ways of using the indicator by the link below 👇


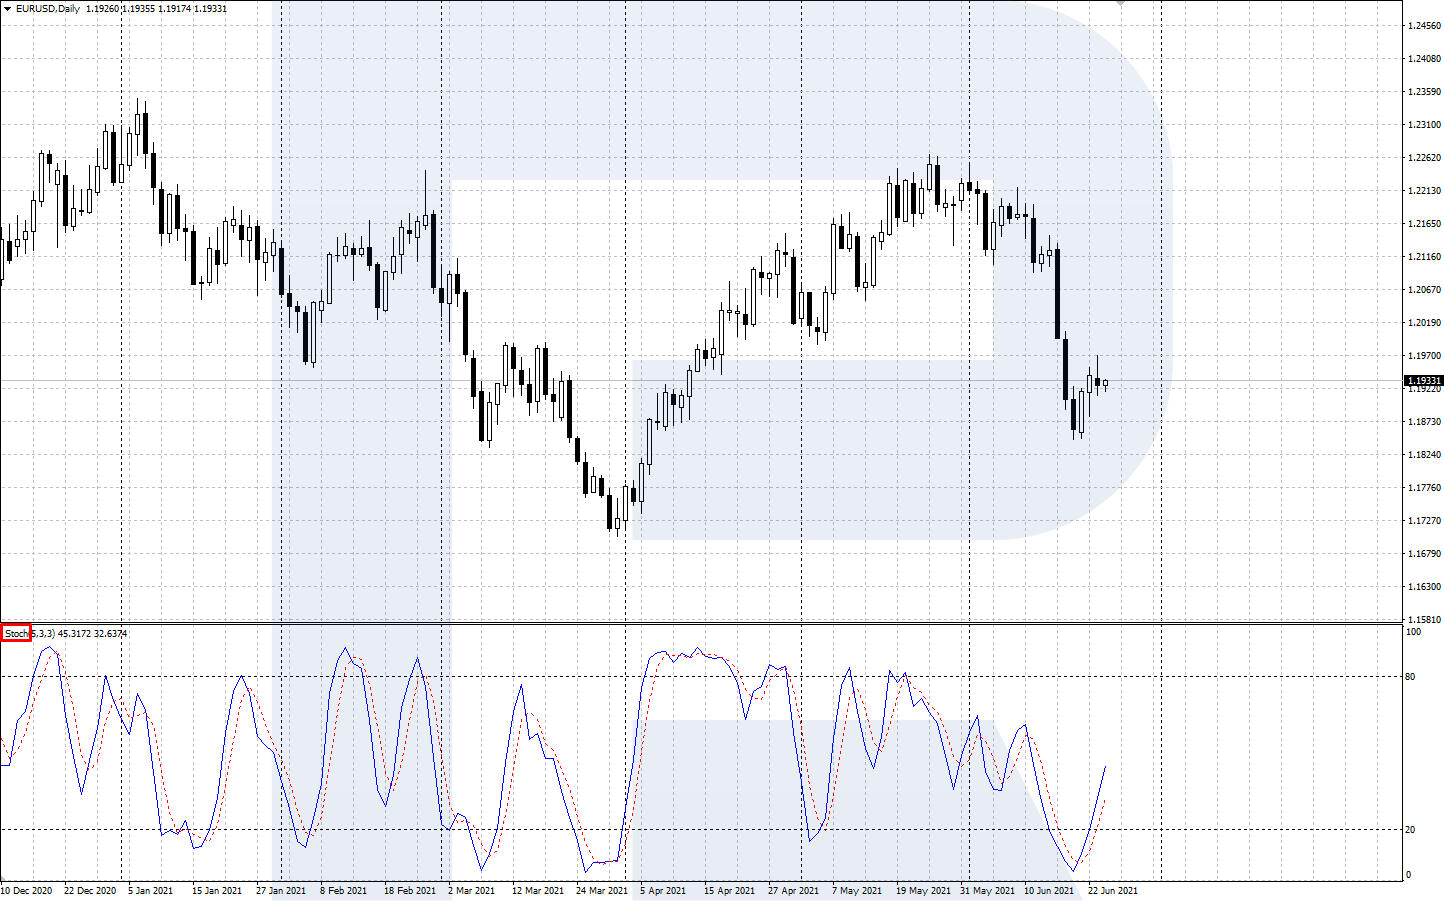
3. The Stochastic Oscillator
The Stochastic Oscillator was created by a famous trader George Lane. He noted that prices move in some sort of cycles: going from one level to another, it sometimes becomes in turns oversold and overbought. The Stochastic shows whether buyers and sellers can close the day at the reached highs/lows.
Stochastic is a normalized oscillator, displayed in a separate window under the price chart and consisting of two lines: %K is fast and %D is slow. Values vary from 0% to 100%; at the levels of 20% and 80% signal lines are drawn. They single out the oversold (0-20%) and overbought (80-100%) areas. These areas are used for finding signals to buy and sell.
Read more about the characteristics and the ways of using the indicator by the link below 👇
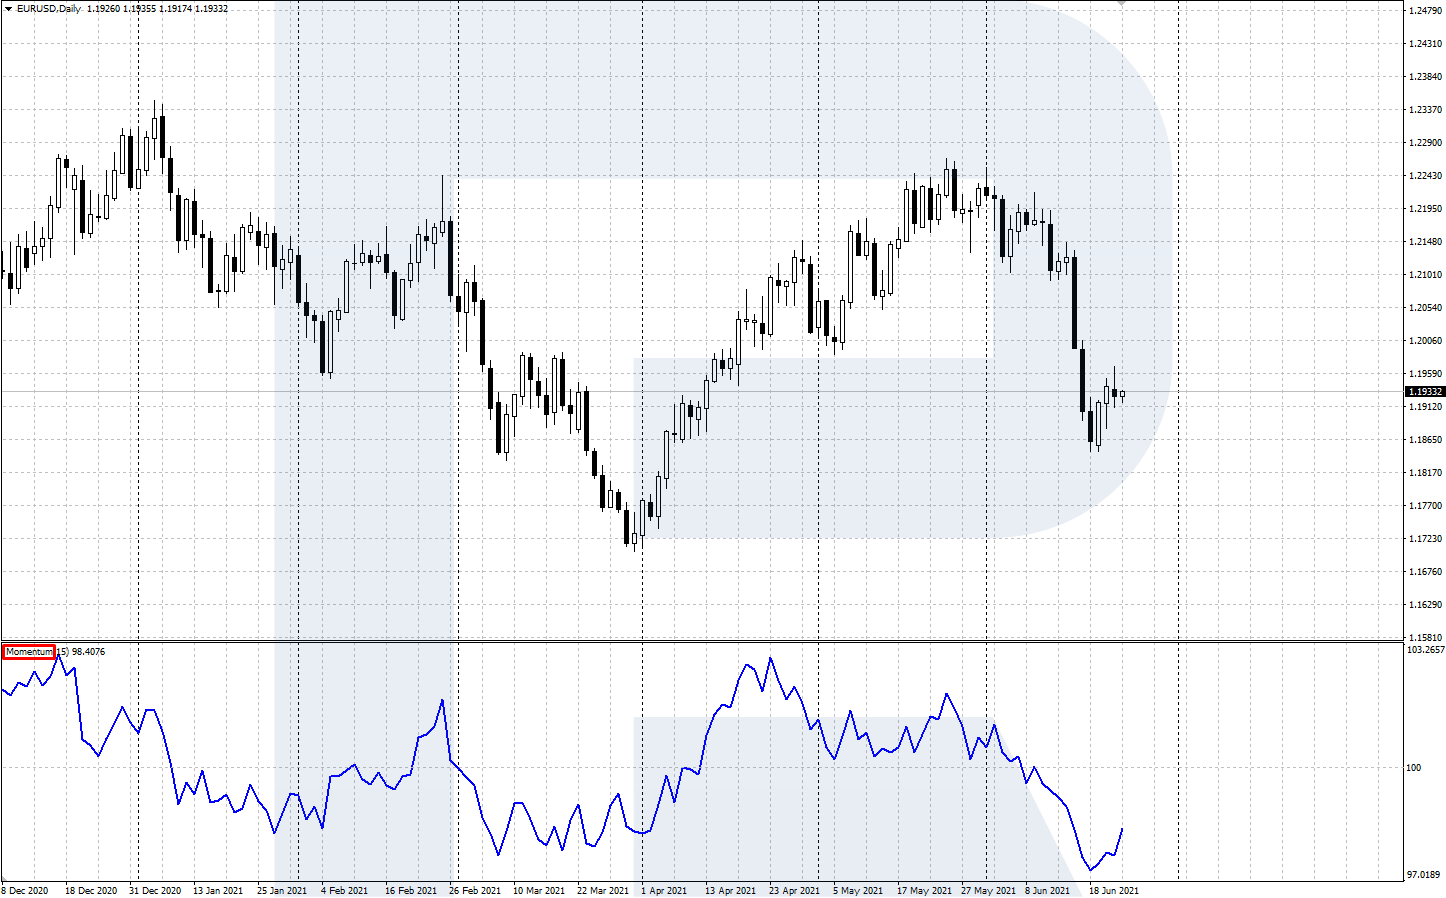
4. Momentum
Momentum is a non-normalized oscillator that also helps to define the trend. It compares the closing price of the current period with the closing price of the previous one. In essence, Momentum shows the speed (tempo) and direction of price changes.
The popularity of Momentum can be explained by its simplicity, universality, and the ability to sometimes give leading signals. Momentum assesses the tempo at which quotations are changing and helps detect whether the trend is speeding up or slowing down. Also, it helps find turning points on the chart. The indicator is displayed in a separate window under the chart.
Read more about the characteristics and the ways of using the indicator by the link below 👇
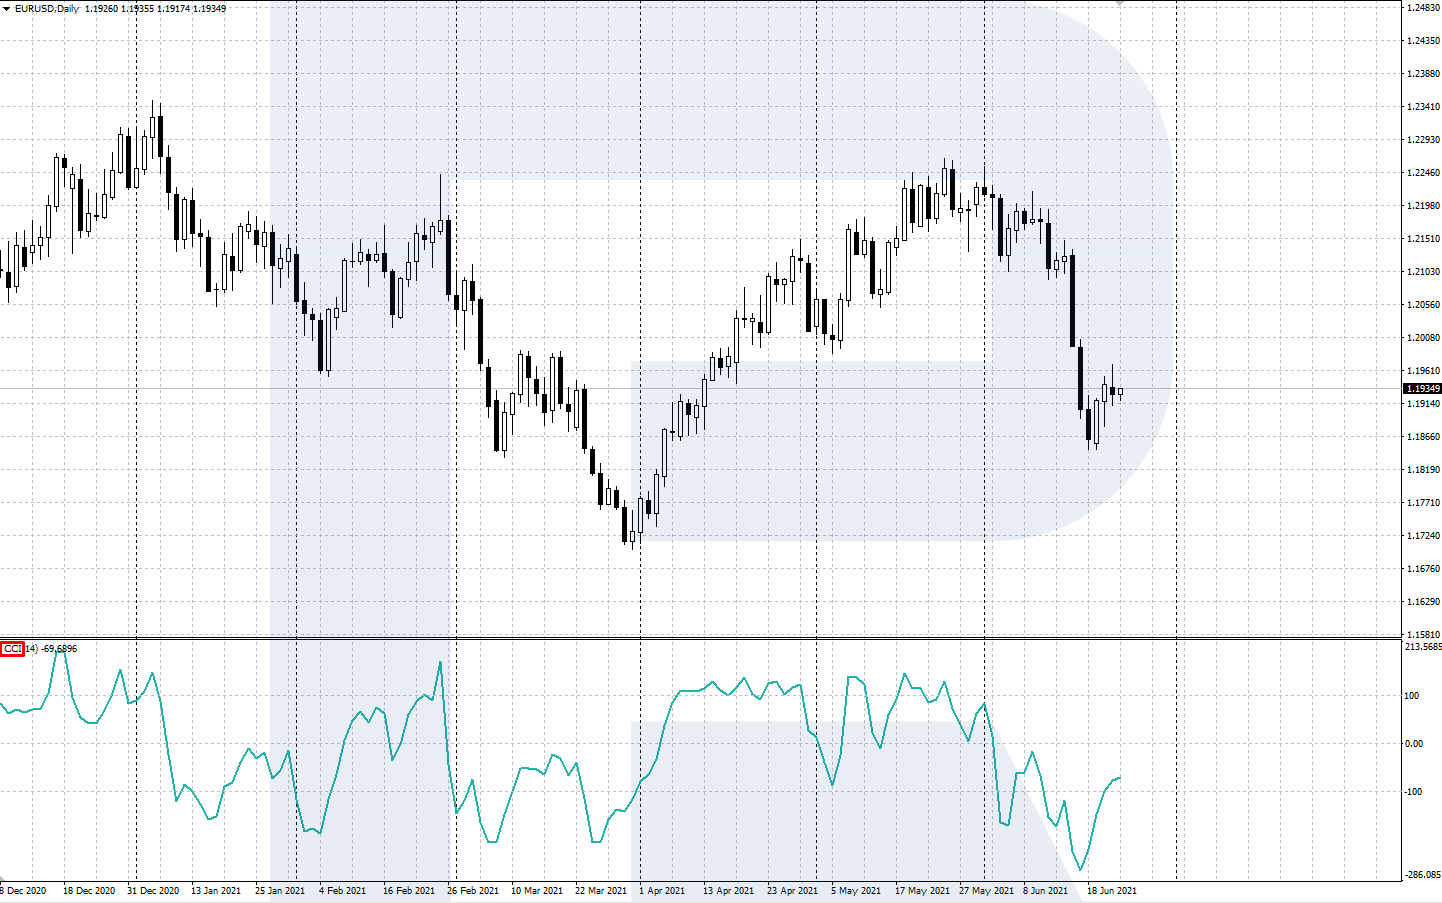
5. The CCI (Commodity Channel Index)
The CCI is a non-normalized oscillator designed by a market trader named Donald Lambert. He used the CCI to trade in commodity markets. The CCI helps find out at which state your trading instrument is now: overbought or oversold.
The CCI evaluates the current relation of the price and a Simple Moving Average (SMA). In other words, it shows how much the price deviates from its average. The CCI highs demonstrate that the quotations have grown a lot, deviating from the average, while lows show that the quotations have dropped, deviating from the average again.
Read more about the characteristics and the ways of using the indicator by the link below 👇


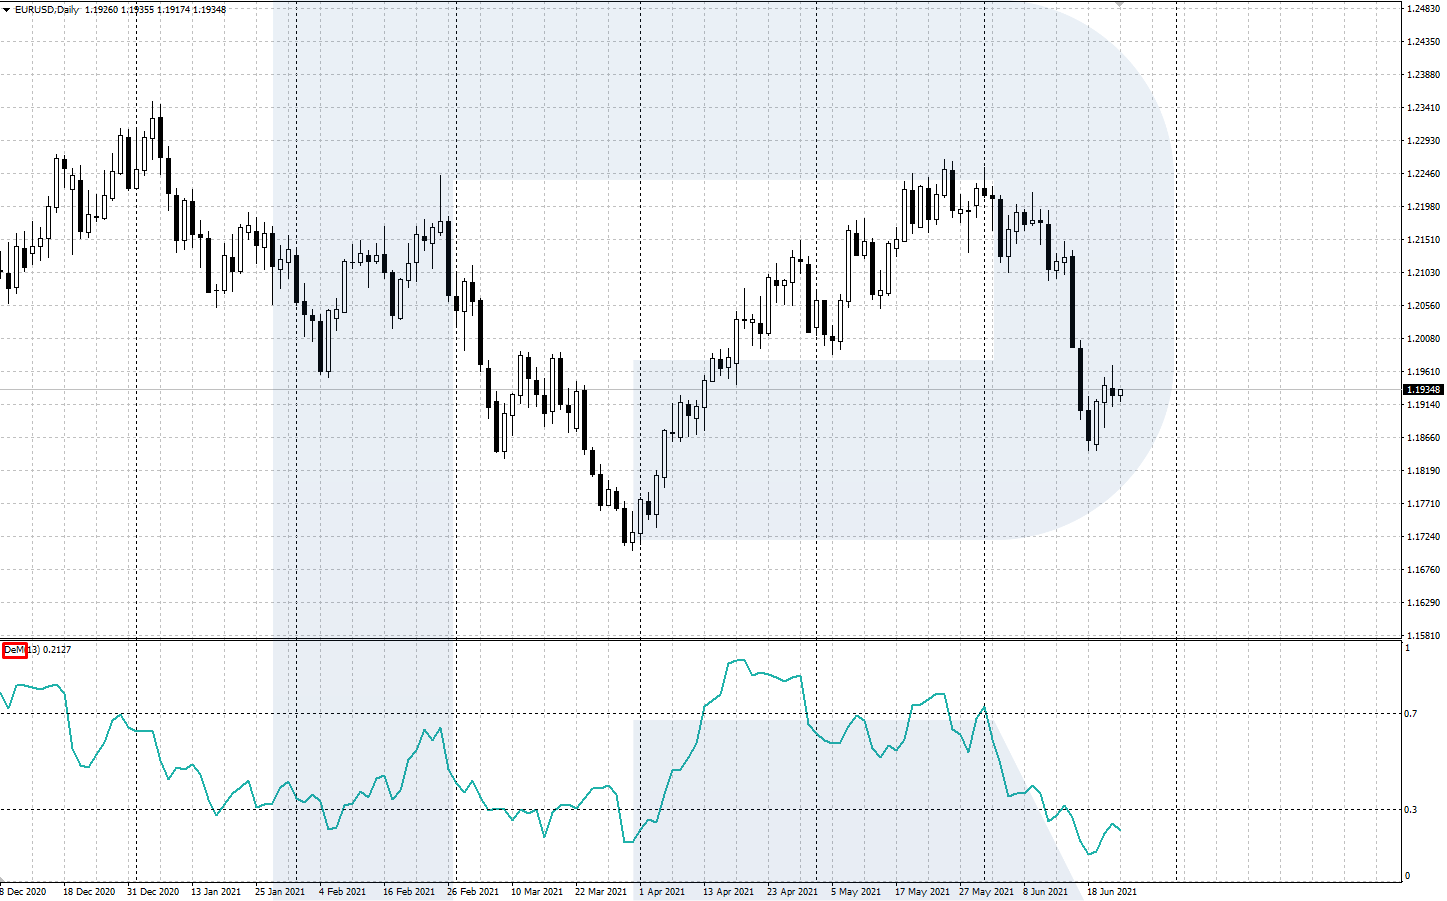
6. The DeMarker indicator
DeMarker is an original indicator named after its creator, a famous trader and tech analysis guru Thomas DeMark. The indicator assesses the position of the current price compared to the previous period and helps define the market situation and find the place for a possible reversal. The indicator is calculated in a separate window.
DeMarker is a normalized oscillator: it oscillates from 0% o 100%. In the indicator window, they are marked 0 and 1. Unlike other indicators, DeMarker pays more attention not to close prices by to extremes (highs and lows). The calculating algorithm compares current highs and lows to the extremes of the previous period.
Read more about the characteristics and the ways of using the indicator by the link below 👇
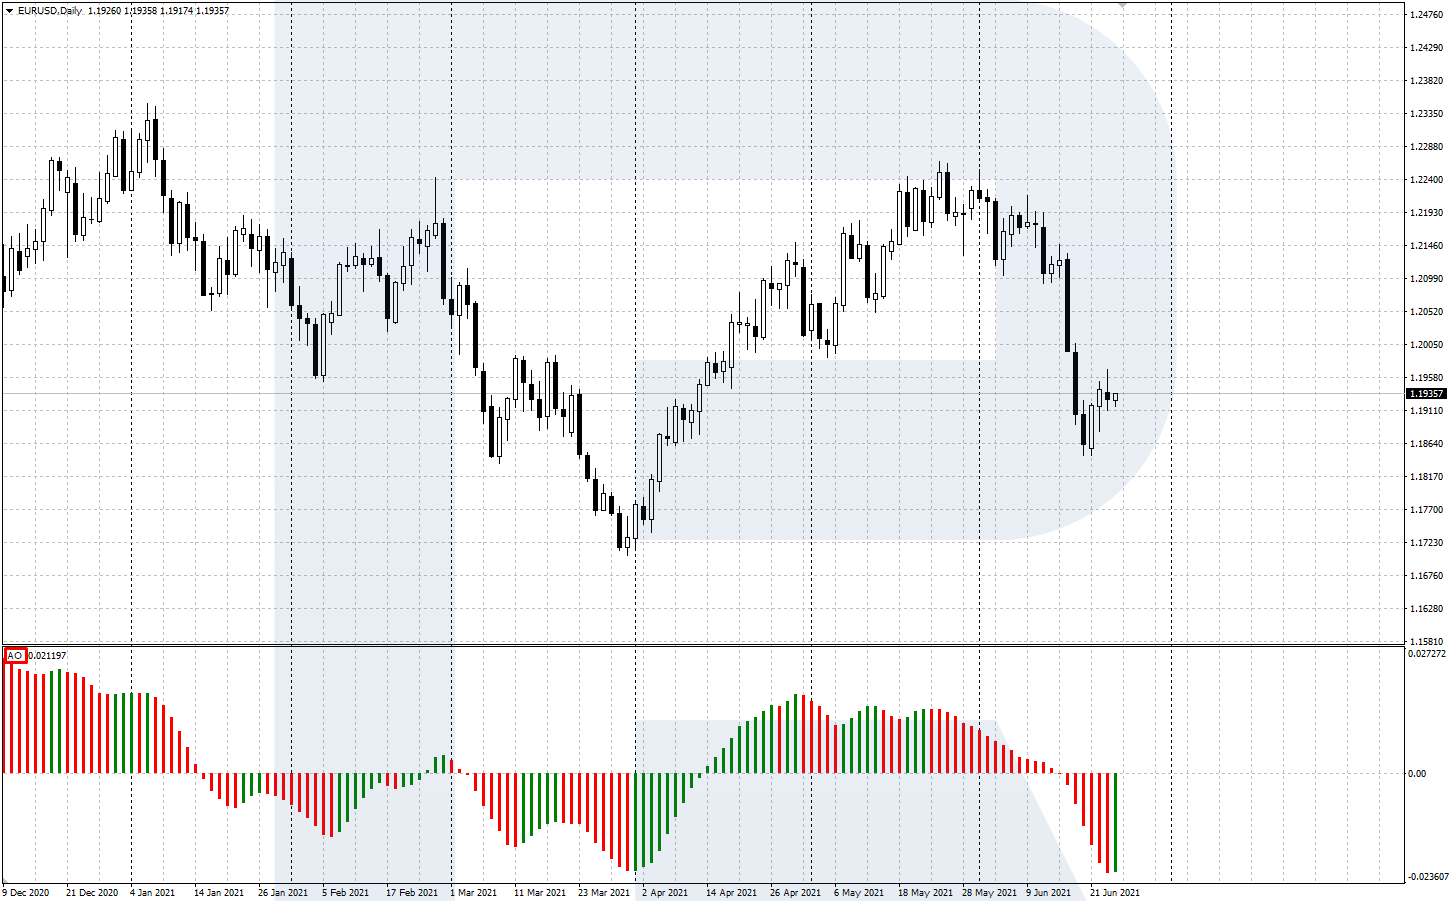
7. Awesome Oscillator
Awesome Oscillator was created by a famous market trader Bill Williams. He designed the indicator for using in his Profitunity trading system. Awesome Oscillator is based on the difference of the values of two SMAs. The indicator is displayed in a separate window under the price chart.
The evaluation of convergence/divergence of the fast and slow SMAs helps define the direction and strength of the trend and shows potential reversal points on the chart. If Awesome Oscillator is growing and showing new highs, this means the trend is ascending, and if the indicator is declining, renewing new low, the trend is descending.
Read more about the characteristics and the ways of using the indicator by the link below 👇
Closing thoughts
This article was devoted to seven most widely used oscillators for Forex, stock, and commodity markets. I recommend beginners to backtest these ones and choose most efficient of them.
Most often, traders use oscillators alongside trend indicators: the latter detects the direction of trading while the former gives opening/closing signals. Check out the most popular trend indicators in the article:


