Multipliers for Stock Analysis: Getting to Know P/S Ratio

5 minutes for reading
Before you start investing in a company, studying its chart and financial reports is vital. However, most often this is not enough, and you might need to use multipliers. One of them is the P/S ratio. This article is dedicated to the P/S ratio, describing the principle of how it works, and how it can help investors in the stock market.


What is the P/S ratio?
The P/S indicates the Price/Sales ratio. In other words, it assesses the sales volumes of a company and shows how much investors are paying per dollar of profit. It's a type of indicator that calculates the ratio of the company's revenue and other characteristics. The formula is the following:
P/S = Market Price of the company / Sales Volume
The market price of a company is the cost of the shares it has in the market, both common and privileged stocks.
The sales volume is the money generated after selling products or services.
Advantages and drawbacks of P/S
Advantages:
- The calculation does not require particular knowledge
- The net profit of the company might be revised or be negative, while revenue will be positive almost all the time. This simplifies the evaluation of the company by using this parameter
- The stock price and revenue dynamics allow evaluating the stage of the company's development (if the value is zero, the company is stagnating)
- Net profit can often be used for influencing investors, however, this seldom works with revenue
- The company's revenue demonstrates its opportunities and prospects and does not always depend on the company's fiscal policy
Drawbacks:
- The P/S cannot be used for companies that do not trade physical goods (such as insurance companies and banks)
- A company might have a large revenue and a small profit, which, in turn, makes the P/S faulty
- Even if a company is recording high revenue for several quarters in a row, it might spend it all on development or paying out dividends. Consequently, investors will have a negative attitude in the next quarter, which will lead to a drop in the stock price
- Creditors get access to the information, so that they may require payments and thus influence the P/S ratio
Example calculation of the P/S ratio
Let's take a look at examples of how the P/S is calculated.
The ABC company issued one million common and one million privileged shares. The price is 2 USD per stock, and the revenue in the reporting period amounted to five million USD. Divide market capitalisation per revenue:
2 million shares * 2 USD = 4 million USD
P/S = 4,000,000/5, 000,000 = 0.8 USD
Hence, an investor pays 0.8 USD per dollar of profit. Now, how can we use this in practice?
Normal P/S values
- A P/S value between 1 and 2 means that the market gives a balanced evaluation of the company and has no reasons for the profit to drop
- A P/S value above 2 means that the shares are overvalued, so there are no reasons for further active growth – you should probably bear this company in mind, as it might be appealing to buyers the stock price drops
- A P/S value under 1 means that the company is undervalued and has good potential for growth


Patterns of P/S
- When the sales volume increases, the value of the ratio shrinks
- When the stock price (capitalisation) rises, the P/S value increases too
In our calculation example, the P/S value of ABC is 0.8, which means the shares are undervalued and the price has the opportunity to rise. Such shares can be considered for investments. A decline in the P/S value means revenue is growing compared to capitalisation. This might mean the following:
- Investors lose confidence and optimism when revenue turns into net profit
- The shares are undervalued
P/S growth might mean that:
- Capitalisation is growing (the stock price is rising)
- Revenue is declining (if the stock price is more or less stable)
The P/S is less volatile than other indicators and reflects the state of the company's affairs more accurately.
How to use the P/S
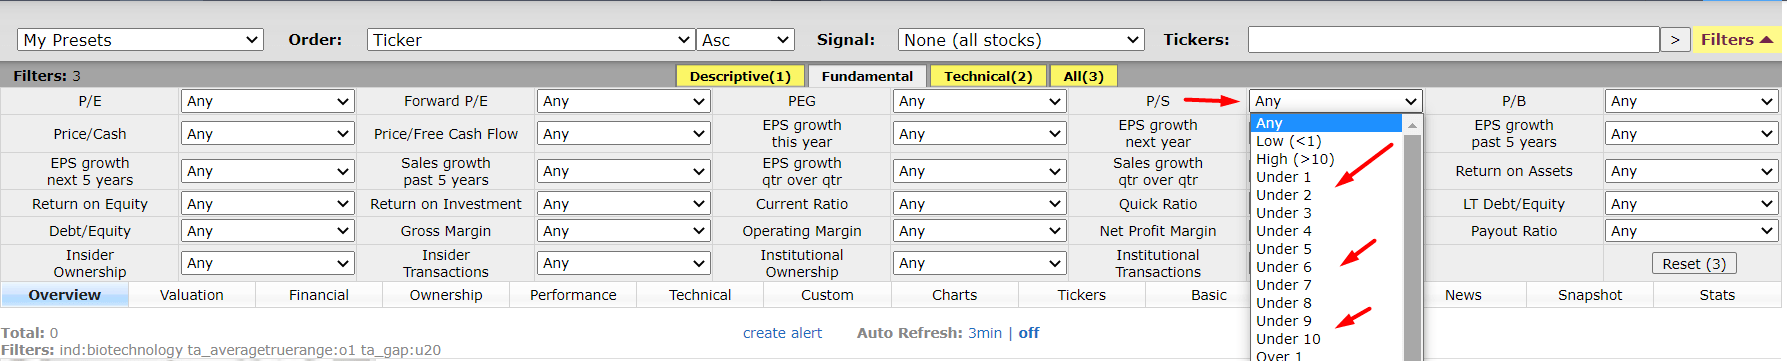
Nowadays, there is no need to calculate the P/S manually, as you can find the values in stock screeners online. In a screener on any popular resource, choose the required parameter of the multiplier and get a list of suitable companies.
There are several ways of using the indicator. First, try to evaluate the company by several reporting periods, at least for a couple of previous years.
Assessing companies from non-related sectors of the economy is irrelevant. The multiplier works only with rivals applying the same principles of business. High revenue and small profit do not mean that the company is doing badly. Quite often, companies merge with their competitors and spend money on development and updates. This worsens the P/S results but not the performance of the company.


Conclusion
A company should not be evaluated by just the P/S, as this shows biased information. As with most other multipliers, the P/S is used alongside other multipliers and financial reports. The main function of the P/S is to help you find undervalued companies and investment options.


 are complex instruments and come with a high
  of losing
  rapidly due to
  . 69,88% of retail investor accounts lose
  when trading
  with this provider. You should consider whether you understand how CFDs work and whether you can afford to take the high