Doji Pattern: Types and Trading
5 minutes for reading
This overview is devoted to the types of the Doji pattern and ways of trading it. This is a candlestick pattern that appears on price charts from time to time and signals about an upcoming correction or a reversal of the current trend
What is Doji?
Doji is a potentially reversal pattern consisting of one candlestick that gave it it's name. Doji candlesticks are extremely important tech analysis elements. It does not have a normal body because it's opening and closing prices nearly coincide, with a maximum difference of a couple of points.
When a Doji appears on the chart, it indicates a temporary balance, market uncertainty because neither bulls nor bears succeed in pushing the price this or that way
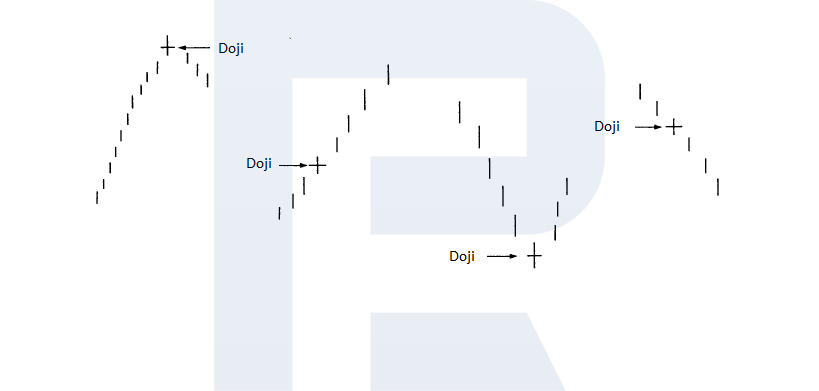
The place where a Doji forms on the chart is extremely important:
- Doji in a flat. When this pattern is in the middle of the range, it gives no trading signals. In such a case, a Doji simply reflects temporary consolidation of the quotations before a new price impulse starts.
- Doji at the market high indicates a possible reversal downwards. When this pattern appears after some growing white candlesticks, this might mean the ascending price impulse is nearly over. Setting new highs, bulls reachea a strong resistance area that they failed to break through. Now bears are ready to counterattack, provoking a descending correction or even a reversal downwards.
- Doji at the market lows signals about a potential reversal upwards. When the pattern forms after declining black candlesticks, this might means the descending impulse is nearly over. Bears reached a strong support level where they faces bulls. Now the latter ones, seeing that their rivals are weak, are trying to turn the market upwards.
All in all, a Doji appearing at the highs or lows of the chart signals about a possible reversal.
Also, a Doji candlestick might be a part of several other reversal patterns; a pattern also called Doji can later transform into some other reversal candlestick combination.
Types of Doji
There are several types of the Doji pattern. Regardless of certain difference in their appearance, the trading principle will remain the same.
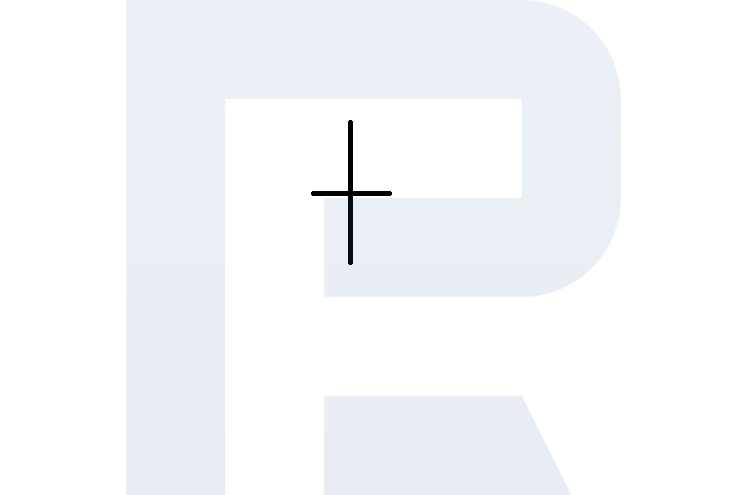
Regular Doji
The pattern has relatively small shadows of more or less the same size.
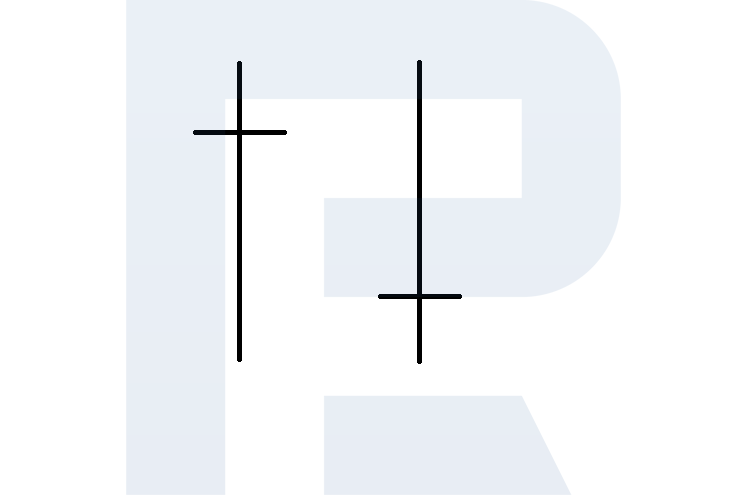
Long-legged Doji
This pattern has very pronounced shadows, while the coinciding opening and closing prices tend to lie closer to either the high or low (asymmetrically).
Rickshaw Doji
This is a type of the Long-legged Doji: its body in the middle of two equal shadows (symmetrically).
Gravestone Doji
This is, again, a type of the Long-legged Doji: it has a long upper shadow and no lower shadow at all
Dragonfly Doji
This is a type of the Long-legged Doji: it has a long low shadow and no upper shadow at all.
Four-price Doji
The closing, opening, high, and low prices fully coincide. This is a rare pattern in liquid financial instruments but characteristic of non-liquid assets.

Trading by Doji
There are, in fact, two main ways of trading by Doji: the aggressive and conservative ones.
- The aggressive way presumes that you start trading right after the pattern appears, with no additional confirmations. These tactics let you enter the trade with a good Stop/Profit ratio, yet signals are less reliable.
- The conservative way of trading requires waiting for an actual price reversal after the pattern appears. A candlestick analysis guru Steve Nixon recommends waiting for a session (candlestick) or two for them to show you the price direction.
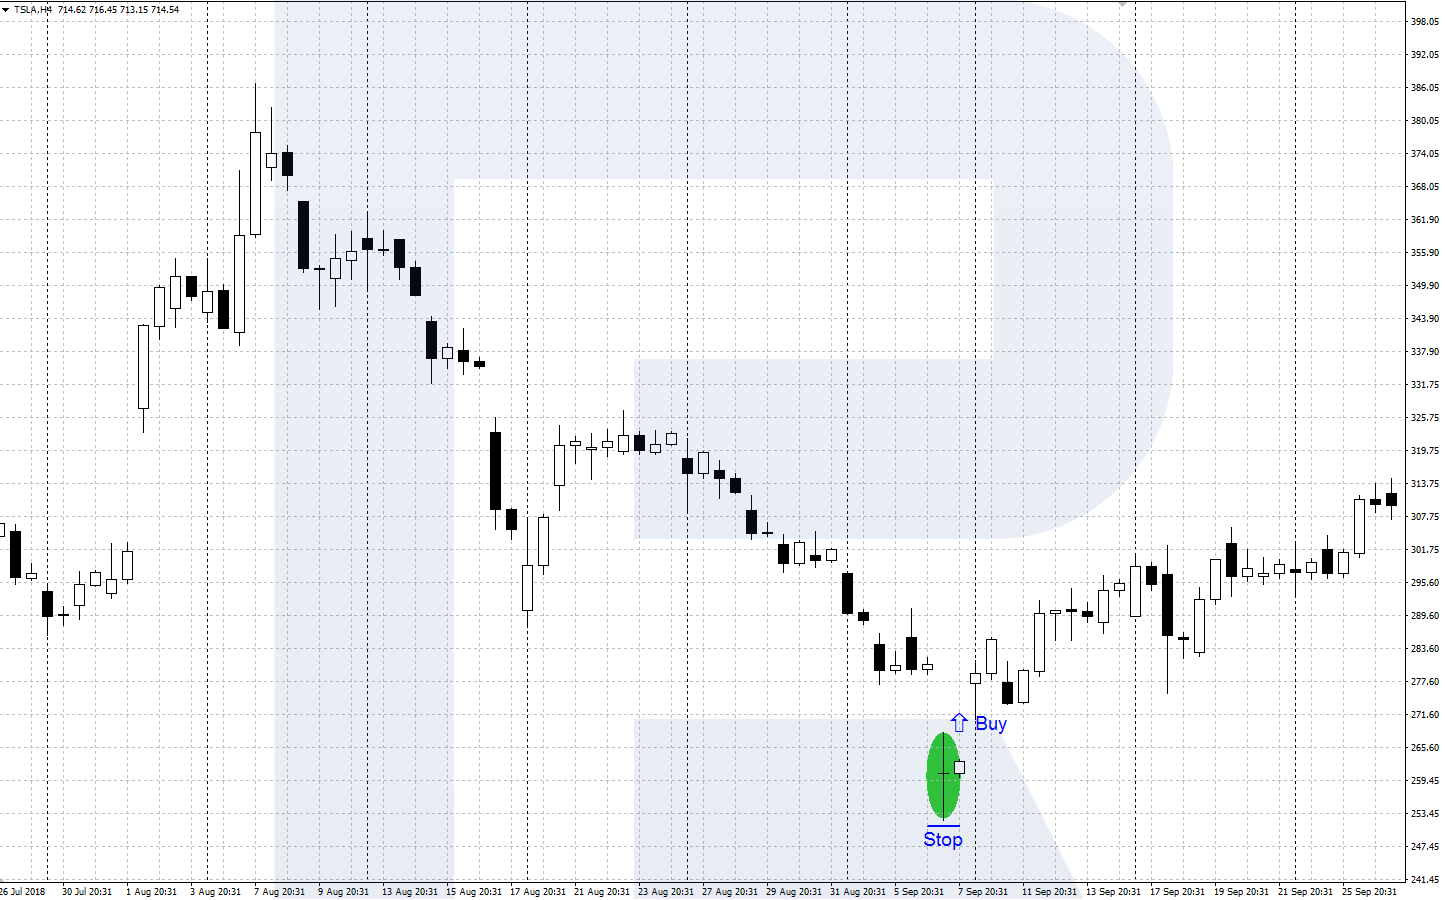
Signal to buy
A signal to buy forms at the lows of the price chart. The trading algorithm looks as follows:
- After a decline, at the local low of the price chart, there appears a Doji.
- You may open aggressive buys when the price exceeds the Doji's high. Place a Stop Loss at the low of the candlestick. In this case, the pattern is less likely to be trustworthy but the Stop/Profit ratio is better.
- Buy conservatively after a white candlestick with a large body appears — it must close above the Doji's high. In this case, the quotations are likely to keep growing but the Stop/Profit ratio is worse.
- Take the profit when the price reaches an important resistance level or shows any signs of a reversal downwards.
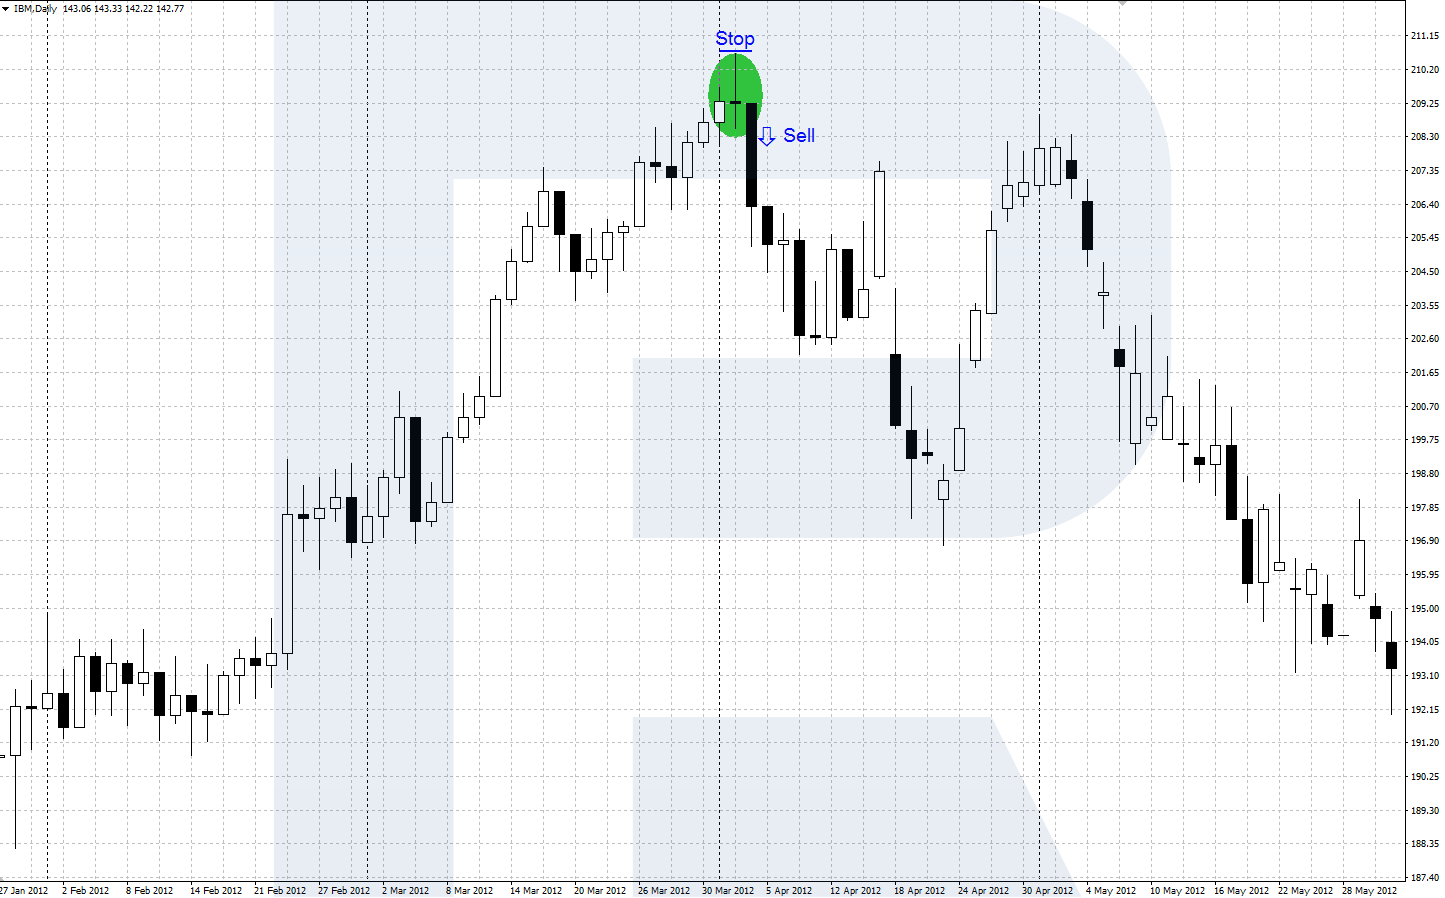
Signal to sell
A signal to sell appears at the highs of the price chart. The trading algorithm is as follows:
- In an ascending movement, a Doji forms at the local high of the price chart.
- Sell aggressively when the price drops below the low of the Doji. Place an SL behind the high of the candlestick. As with buying, it remains unclear if the pattern will work at all but the Stop/Profit ratio you get is better.
- I recommend selling conservatively after a solid black candlestick appears, closing below the low of the Doji. Place an SL behind the high of these candlesticks. In this case, the price is likely to go deeper down but the Stop/Profit ratio might be worse.
- Take the profit after the quotations reach a strong support level or some signs of a reversal appear.
Bottom line
Doji is a potentially reversal pattern of candlestick analysis that forms on the local extremes of the price chart. It can work both on its own and as a part of other reversal patterns.
Before you begin real trading, backtest you understanding of Doji and practice on a demo account.
Learn about other candlestick patterns in the article by the link:


