How to Analyse Stocks by P/B (P/BV) Ratio?

7 minutes for reading
P/B stands for Price/Book. This ratio (multiplier) represents the price of the company’s assets minus its liabilities in case the company is liquidated.
The use of the P/B (P/BV) for stock analysis is somewhat limited, as it does not suit certain sectors of the economy. This article is dedicated to the peculiarities of this ratio and gives examples of its use for stock analysis.
P/B (P/BV) values
The P/B (P/BV) coefficient reveals the cost of the assets the company owns minus its liabilities (debts, expenses), which can be sold in case the company needs to be liquidated.
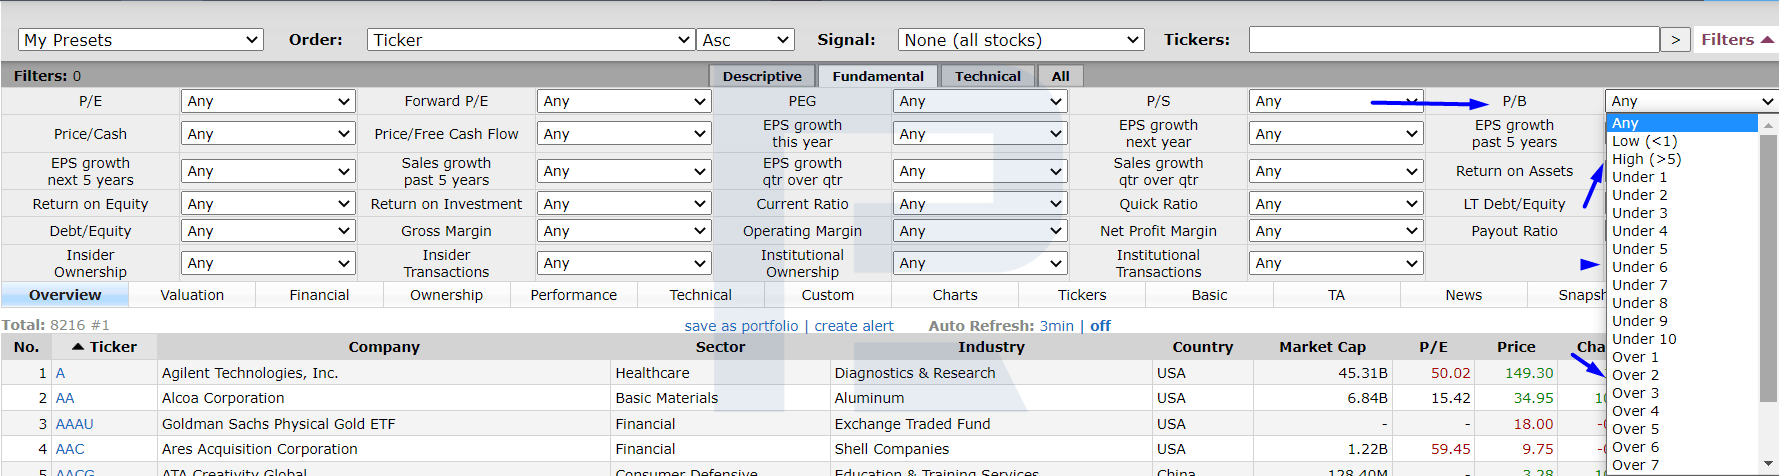
For all public companies, the P/B (P/BV) values are available in the various screeners that are normally used for choosing stocks for investments. This ratio can be used as a choice criterion, however, note that it does not let you adequately compare companies from different industries. Its values can be interpreted as follows:
- P/B (P/BV) below 1 – investors pay less than one dollar per dollar of the stock price.
- P/B (P/BV) above 5 – investors pay over five dollars per dollar of the stock price.
The same principle is used for any other value.
Theoretically, the smaller the P/B (P/BV) value, the better for investments. In practice, things are slightly more complicated.
- A negative value of the ratio (below zero) means that the company has more liabilities than assets. This might forecast bankruptcy.
- A value between zero and one means that the company is undervalued.
- If the P/B (P/BV) is one, this means the company’s assets equal its market price. This is an investor’s standard.
- A value over one demonstrates that investors are ready to pay more than the company’s real market price.
Analysing companies by the P/B (P/BV)
Let's analyse companies from the banking sector as an example. They are suitable for analysis by this indicator because the value of financial organisations in the market is real thanks to the balance of assets and liabilities.
UBS Group AG

As you can see on the screenshot above, the P/B value for the UBS investment bank is one, which means the company’s assets and liabilities are perfectly balanced. Hence, the shares of the company are likely to keep growing in the nearest future – and this is exactly what we see on the chart.

After a correction, the stock quotes kept growing and renewed the highs. Based on P/B values, you can make some preliminary conclusions about whether the stock prices will grow. However, for more precision, you need more data, such as other ratios.
Royal Bank of Canada
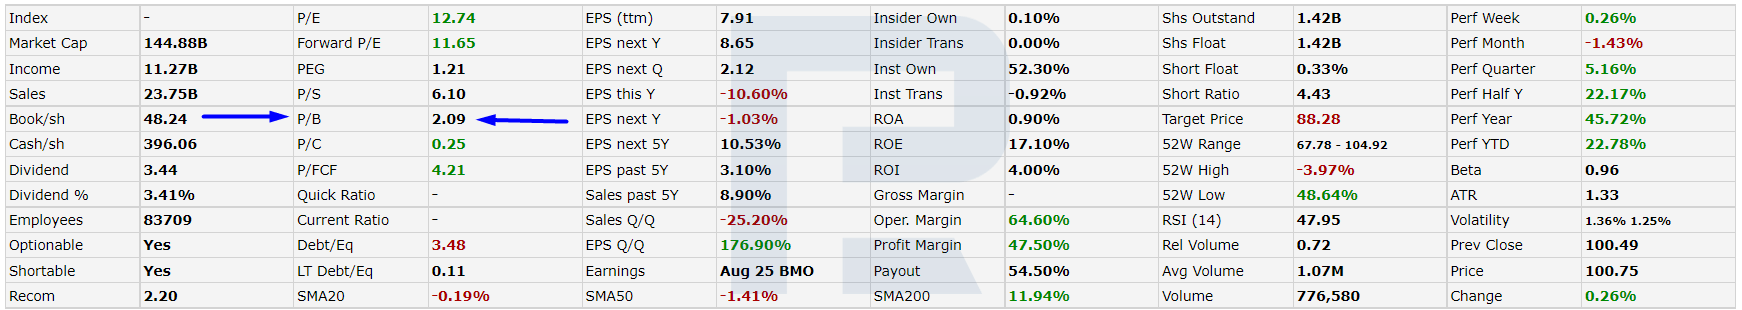
Now to the Royal Bank of Canada. On the screenshot above you see that the P/B value is 2.09, which means that investors are ready to pay more than the company's value in the market. This might be harmful in the future, as the quotations might keep on declining resulting in a fair balance of assets and liabilities.
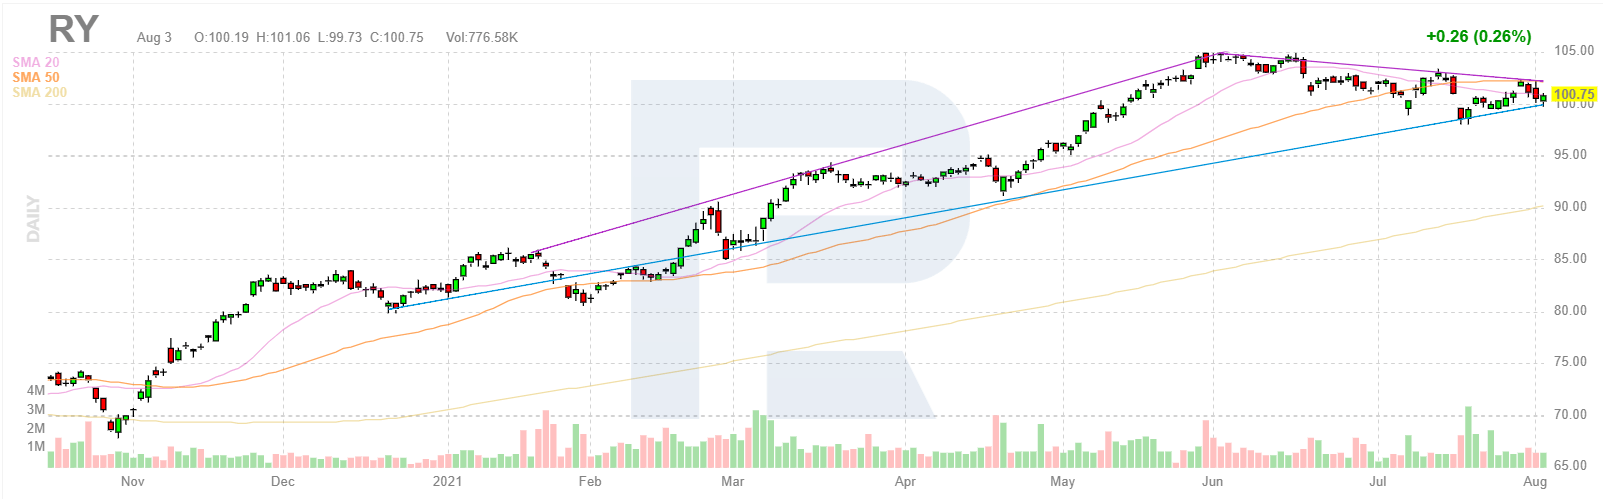
As you can see on D1, the stock price keeps declining, heading for the support area. This might be because the company is overvalued, and speculators are selling the stocks in the hope to make money in short positions. In the future, investors will become interested in the bank's stocks again when the price drops to acceptable levels. The bank will then attract new capital through purchases of stocks by market participants.
Now, let's look at an example where the P/B value does not work as well as for the banking sector.


Aspen Technology Inc

As you see above, the multiplier is 13.44, which means that the company is overvalued, and the cost of its assets is much lower that its market price.
As long as Aspen Technology Inc develops software, you simple cannot rely on P/B. The company, in fact, has very limited physical assets, the main part is made of non-material ones (patents and licenses) that are not taken into account by P/B. That is why the multiplier is useless here.
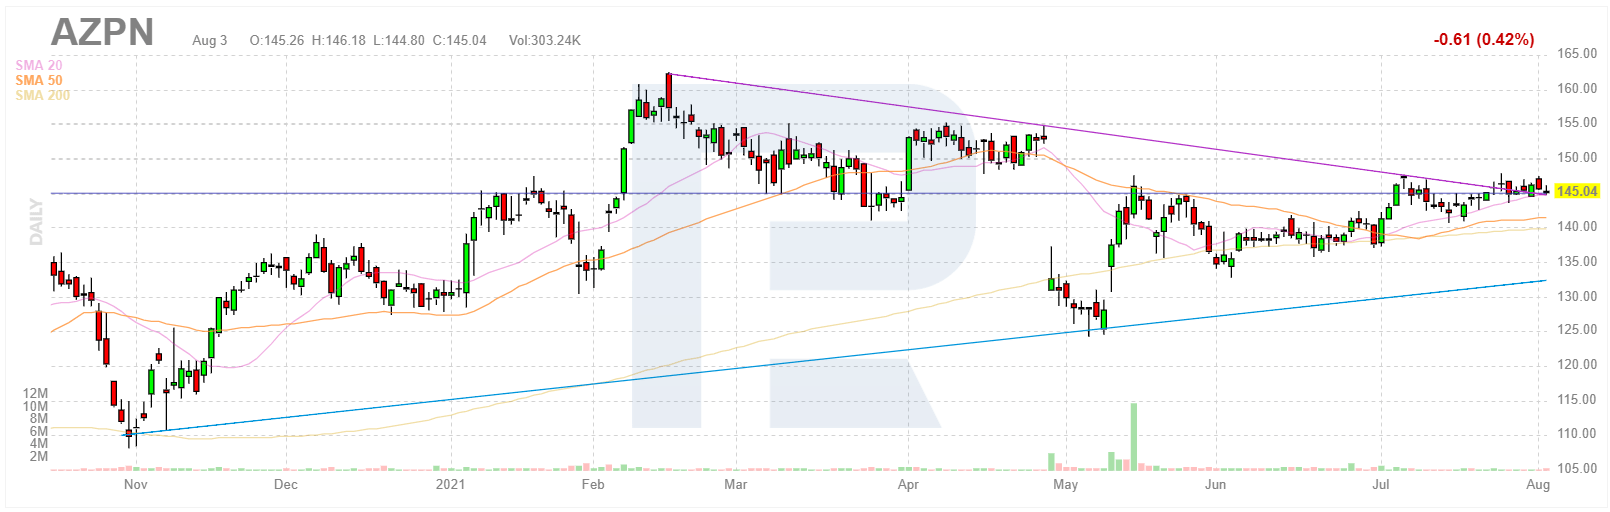
As you can see on D1, the stock quotes have been moving sideways for a short while, and the trading signals are not trustworthy. This means the company is stagnating and is not attractive for investments. On the other hand, IT and all things around it is in a leading position compared to, say, heavy industry.
Hence, analysing and comparing companies from the Information Technology and high-tech sectors by the P/B ratio is just useless.
Is the P/B (P/BV) formula worth using at all?
Having looked at the examples, let's now discuss the pros and cons of the ratio.
Advantages of the P/B
- It gives investors an idea of how much they are paying for the company’s assets.
- The P/B (P/BV) ratio is more stable than the net profit.
Drawbacks of the P/B
- The P/B formula cannot be used to evaluate companies in the IT sector.
- Only companies from the same market sector can be compared correctly.
- Companies that use different reporting forms cannot be compared adequately.
- It does not show the profitability and turnover of the capital.
Closing thoughts
The P/B (P/BV) ratio is a useful criterion for choosing companies for investments. However, you need to take into consideration the industry in which the company works before using this ratio.
When choosing a company for investment, it is more accurate to use a multi-faceted approach that includes a group of ratios, such as the P/E (Price/Earnings), the P/S (Price-to-Sales), the P/BV (Price-to-Book), fundamental values, and tech analysis.
* - Past performance does not predict future returns.


 are complex instruments and come with a high
  of losing
  rapidly due to
  . 69,88% of retail investor accounts lose
  when trading
  with this provider. You should consider whether you understand how CFDs work and whether you can afford to take the high