How to Use Accumulative Swing Index in Trading

5 minutes for reading
This article explains what Accumulative Swing Index is, what signals it gives, how it is calculated and set up in a trading terminal, and, naturally, how it is used in trading.
What Accumulative Swing Index shows
Accumulative Swing Index (ASI) was invented and made popular by a famous trader, financial analyst, and creator of several other indicators Wells Wilder. He described the work of ASI in detail in his book New Concepts in Technical Trading Systems, published in 1978.
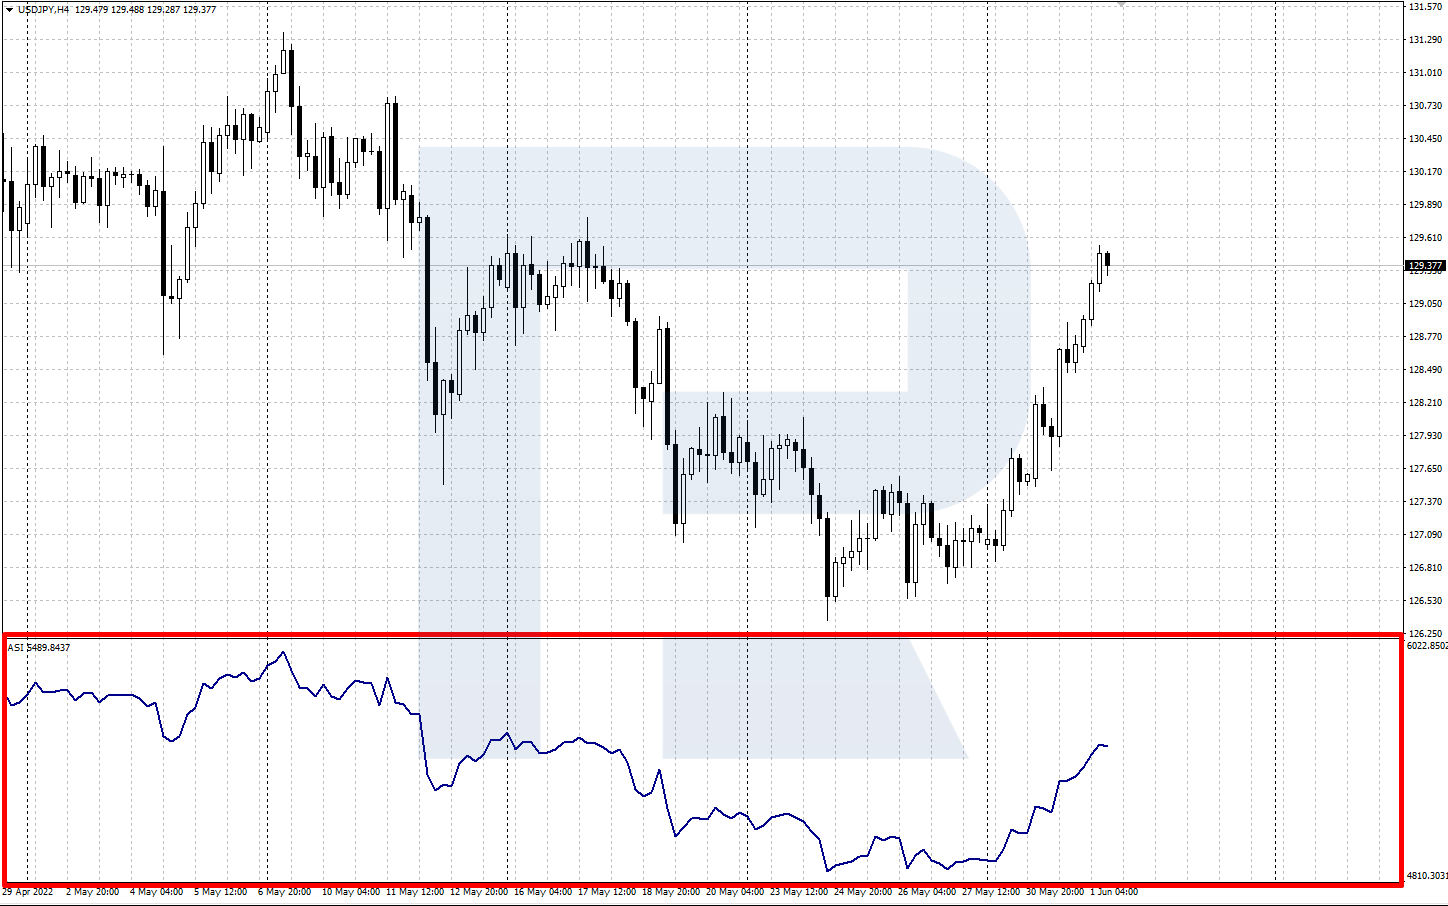
For calculating ASI, prices of the current and preceding timeframes are used – Close, Open, High, Low. The results help to assess current price dynamics of the instrument in question. The indicator appears in a separate window under the price chart and looks like one main line.
The line allows seeing the direction of the current market trend and confirms (or not) breakaways and bounces off the support/resistance levels on the chart. Growing ASI confirms an actual uptrend and falling ASI indicates a downtrend.
How to calculate Accumulative Swing Index
The indicator is caluculated by the formula:
ASI(n) = ASI(n-1) + SI(n)
SI(n) = 50 * (CLOSE(n-1) - CLOSE(n) + 0.5 * (CLOSE(n-1) - OPEN(n-1)) + 0.25 * (CLOSE(n) - OPEN(n)) / R) * (K/T)
Where:
- SI(n) is a Swing Index, the index of price changes;
- SI(n-1) is the Swing Index of the previous period;
- CLOSE(n) is the current Close price;
- CLOSE(n-1) is the Close price of the previous period;
- OPEN(n) is the current Open price;
- OPEN(n-1) is the OPEN price of the previous period;
- R is the relation of the Close price to the previous extreme;
- K is the comparison of the extremes: (HIGH(n−1) − CLOSE(n )) и (LOW(n−1) − CLOSE(n ));
- T is the maximum price change;
- ASI(n) is the Accumulative Swing Index.


How to install Accumulative Swing Index to trading terminal
Accumulative Swing Index is not among standard indicators in most trading terminals, which means to use it in MetaTrader 4, one needs to download the installation file and install the indicator. The file can be found on, for example, MetaQuotes Ltd.
This is how ASI is installed on MetaTrader 4: Main Menu – File – Open data catalogue – MQL4 – Indicators – paste the file to the folder – restart the terminal.
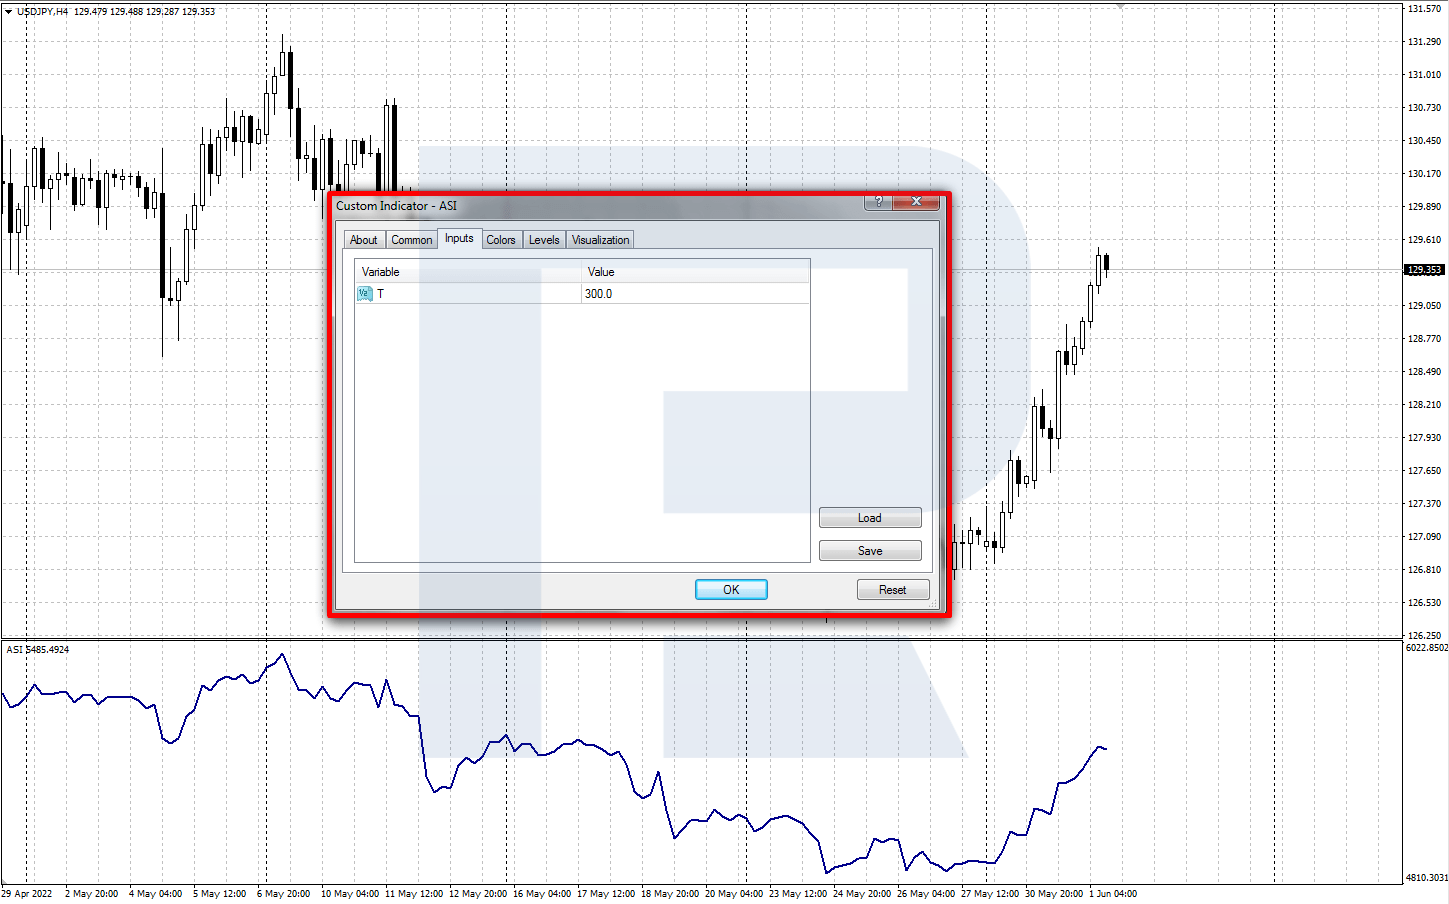
This is how ASI is added to the price chart: Main Menu – Insert – Indicators – User – ASI.
Accumulative Swing Index is normally used with preset parameters (variable T = 300).
How to trade with ASI
Signals of the indicator can be used for trading currency pairs, stocks, gold, and other highly liquid assets. According to the author, higher timeframes give more trustworthy signals. There are two main trading options of using ASI – a breakaway of the support/resistance levels and a divergence.
Confirmation of breakaways of support/resistance levels
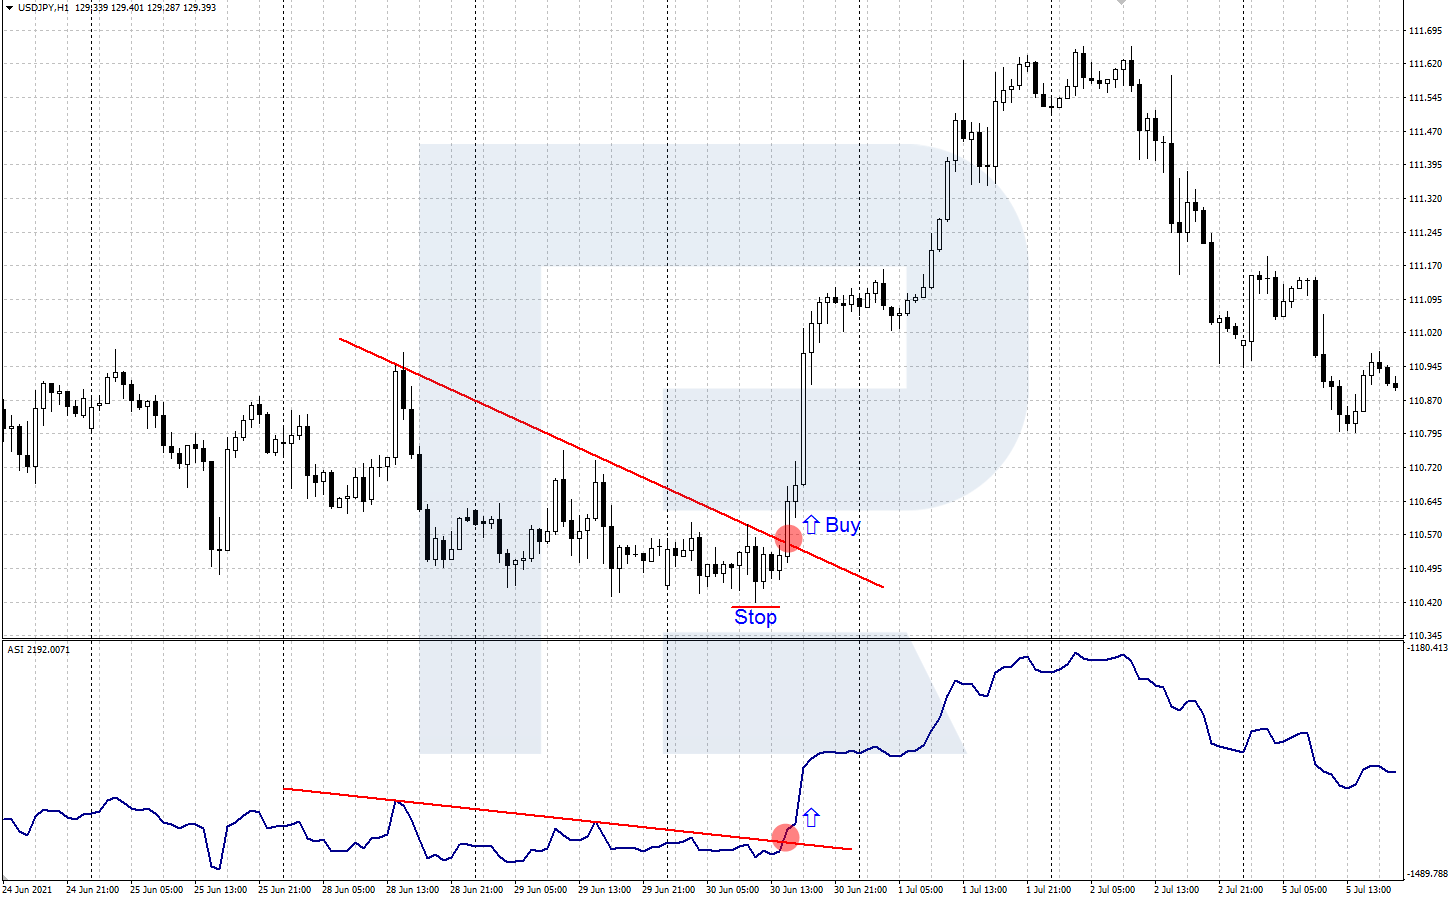
This approach uses ASI for confirming breakaways of support/resistance levels on the price chart. To get the signal, trendlines are drawn through the local highs/lows in the indicator window and on the price chart. Simultaneous breakaways of these lines in the window and on the chart are considered a signal.
- A signal to buy forms after the quotes on the price chart break through an important resistance level or line upwards. The ASI line must confirm this breakaway in the indicator window. After ASI confirms the breakaway, a position can be opened with a Stop Loss behind the local low.
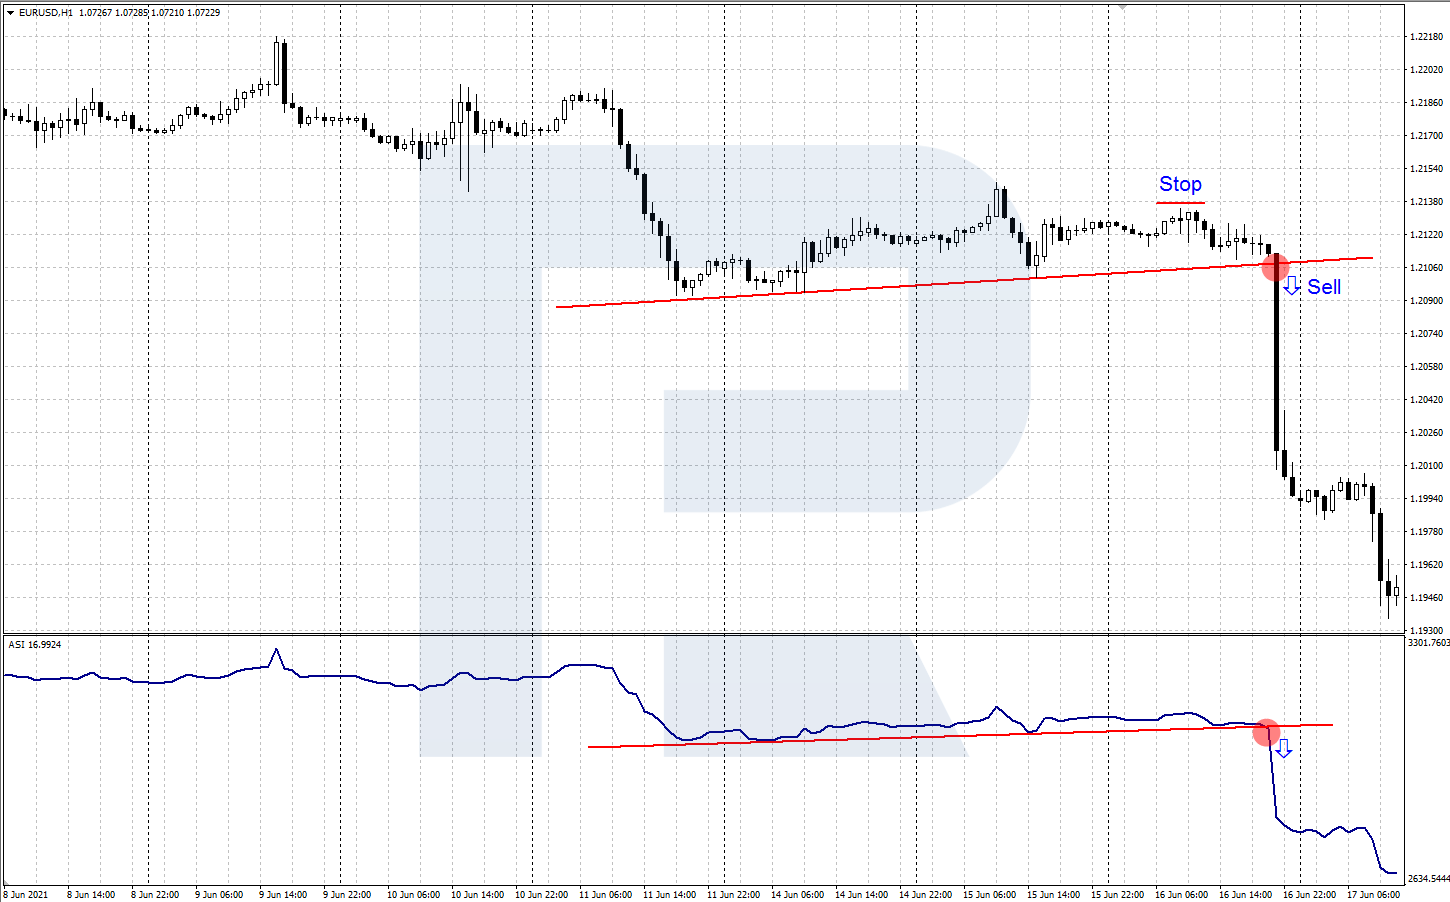
• A signal to sell appears when the price on the chart breaks through an important support level or line downwards. The ASI line must confirm this breakaway by breaking through a support line drawn on the indicator downwards. After the confirmation, a selling position can be opened with a Stop Loss behind the local high.


Divergence of ASI and price chart
Like other famous indicators, such as the MACD or RSI, ASI can warn of a possible reversal by a divergence. Under divergence basically a divergence of extremes on the price chart and in the indicator window is meant. A divergence of highs generates a signal to sell and a divergence of lows creates a signal to buy.
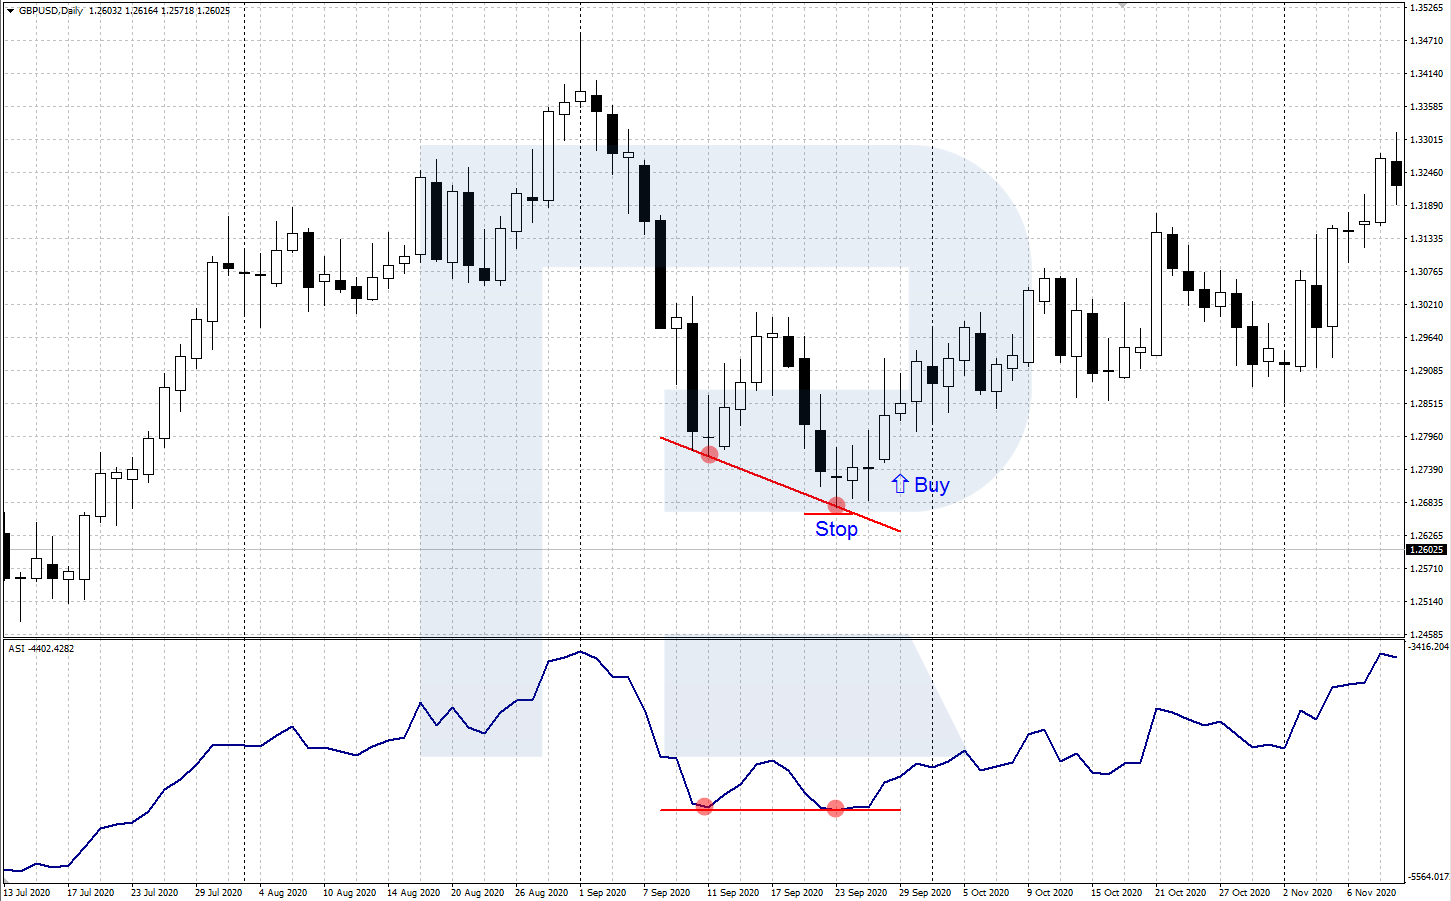
- A bullish divergence forms when on a descending price chart there forms a new low under the previous one, while the corresponding ASI low turns out to be higher than the previous one. This divergence can precede a change of the downtrend to an uptrend. After the quotes reverse, a buying position can be opened with an SL behind the last low.
• A bearish divergence appears when on a growing price chart there forms a high above the previous one, while the corresponding high on ASI turns out to be lower than or on the same level as the previous one. This divergence can be followed by a downward reversal. After it happens, a selling position can be opened with an SL behind the local high.

Closing thoughts
Accumulative Swing Index is a price change indicator created by a famous market guru Wells Wilder. ASI helps to determine the direction of the current market trend and can become a good support to complex technical analysis.
For trading with the indicator, divergences and confirmations of support/resistance lines breakaways can be used. Before applying the signals for real, practising on a demo account is highly advisable.


