How to Use the Rate of Change (ROC) Indicator in Trading

5 minutes for reading
In this material, we will introduce you to the Rate of Change trading indicator. We will consider the peculiarities of its work, the formula for its calculation, and the signals that can be used in trading.
What the Rate of Change indicator shows
Rate of Change is a technical indicator showing the magnitude and speed of price change over a specific period. It compares the quotation of the current time period with the past ones, indicating the percentage of change in the price. The obtained data helps to evaluate the current dynamics of the selected financial instrument. Rate of Change is like the popular Momentum indicator.
ROC helps to determine what kind of trend the market is currently in and whether it is accelerating or slowing down. The greater the growth of the indicator, the stronger the optimism of the market crowd and the higher the probability that prices will continue to rise. A drop in the indicator value indicates an increase in pessimism in the market and the likelihood that prices will continue to fall.
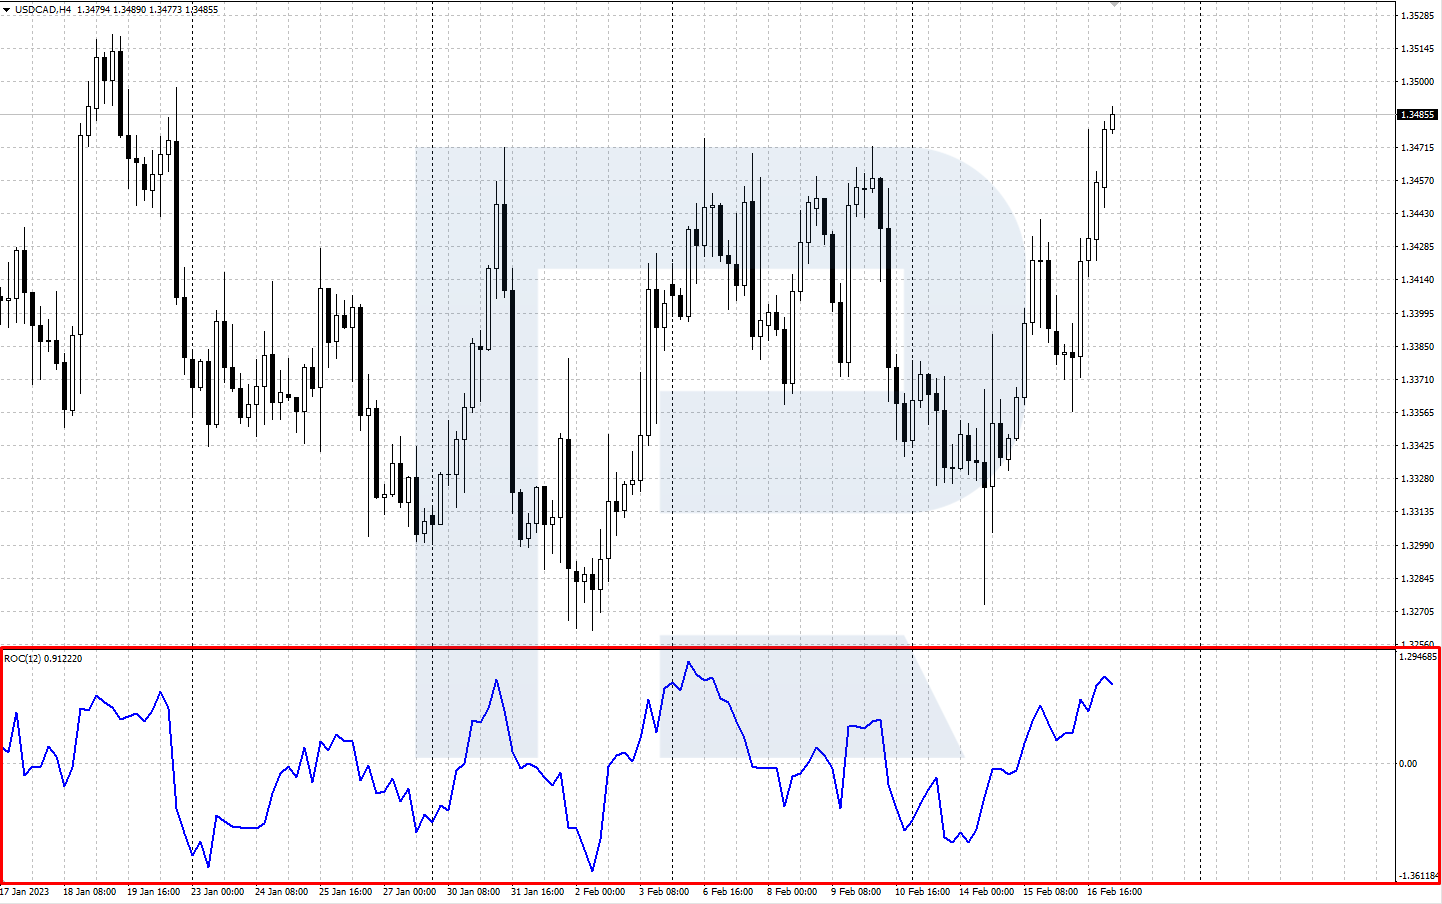
Rate of Change is plotted in a separate window below the price chart and is represented as one main calculation line and a horizontal 0 level. The ROC line confirms (or does not confirm) the breakdown and rebounds from the support and resistance lines on the price chart, and helps determine the direction of the current market trend:
- A rising ROC above 0 confirms that an upward trend is in force
- A below 0 and falling ROC confirms the presence of an active downtrend
The formula for calculating the Rate of Change
ROC = (Close(i) - Close(i-n)) / Close(i-n) * 100%
Where:
- Close(i) - the last closing price.
- Close(i-n) - closing price of n periods ago.
- n - is the period of the indicator.
This indicator in its classic version is used with a default period of twelve. It is always possible to experiment, evaluate its work with other periods on historical data, and choose the most suitable one for your trading.
Installing Rate of Change in the trading terminal
Rate of Change is not a pre-installed indicator, so to use it in the popular MetaTrader 4 terminal, you need to download and install the indicator file. The file can be found on the Internet or on the website of MetaQuotes Ltd.
To install the indicator in the MetaTrader 4 main menu, go to File, select Open Data Folder → MQL4 → Indicators, and copy the file to this folder. After restarting the terminal, ROC will be installed in the Custom Indicators folder.
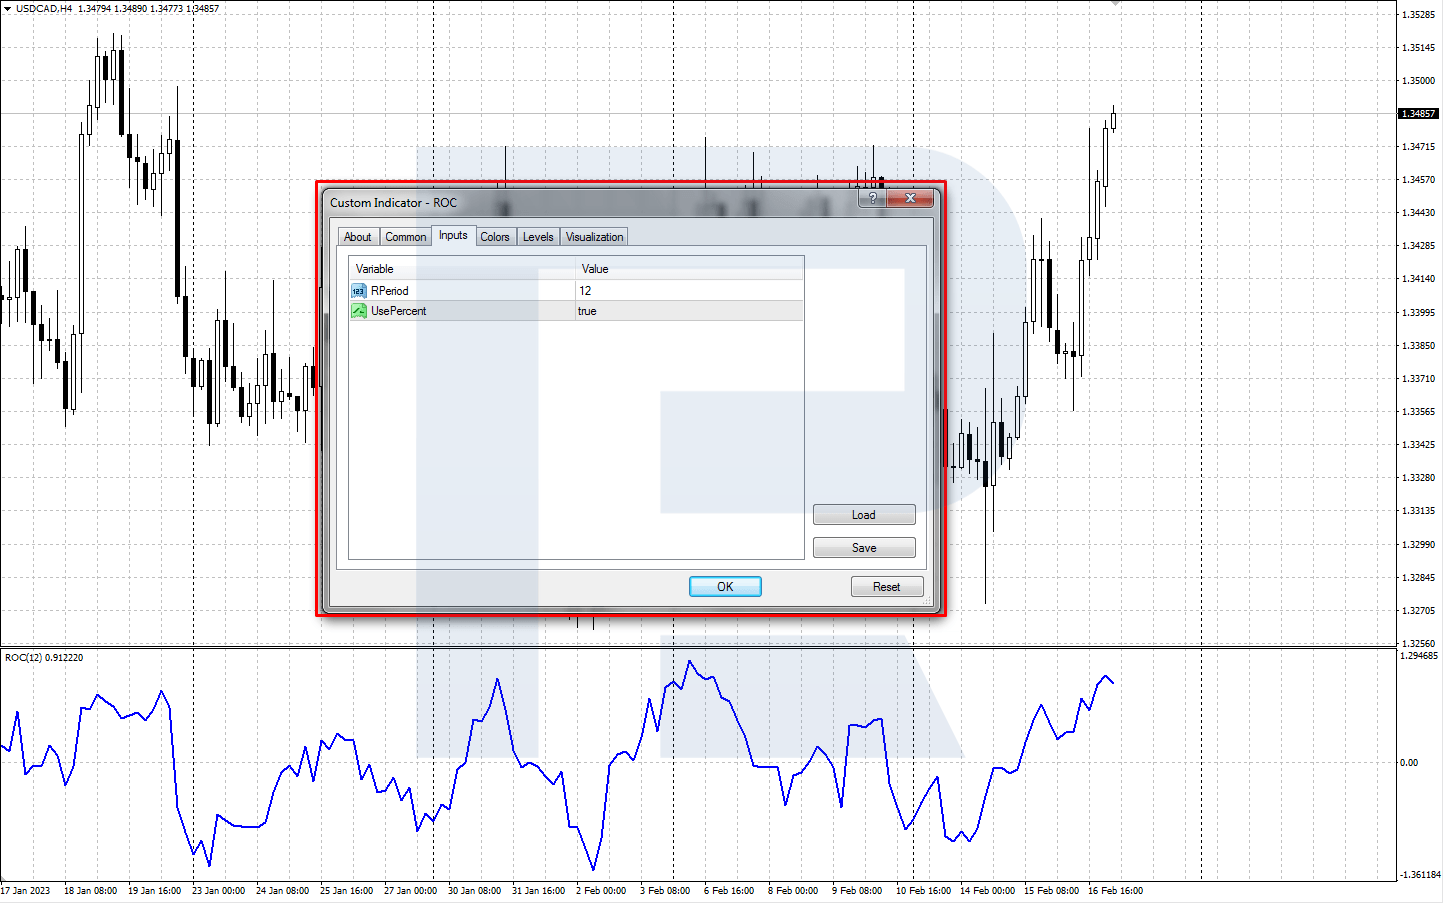
Next, install it on the chart of the desired instrument through the main menu of the programme: Insert → Indicators → Custom → ROC. It is usually used with default settings (Rperiod=12), you can customise the colour and style of the main line.
Rate of Change trading signals
You can use currency pairs, stocks, gold, and other highly liquid assets to trade on the signals of the indicator. Let's consider two main trading options using ROC - level 0 crossing and divergence.
The centre of the ROC indicator, relative to which it moves, is the 0 level. This level is trendsetting: a rise above 0 indicates an upward trend, and a fall below 0 indicates a downward trend.
Like other popular indicators (MACD, RSI), Rate of Change can warn about a possible reversal by the occurrence of divergence. Recall that this is a divergence of extremums on the price chart and extremums of the indicator line. The divergence of highs will generate a sell signal and lows a buy signal.
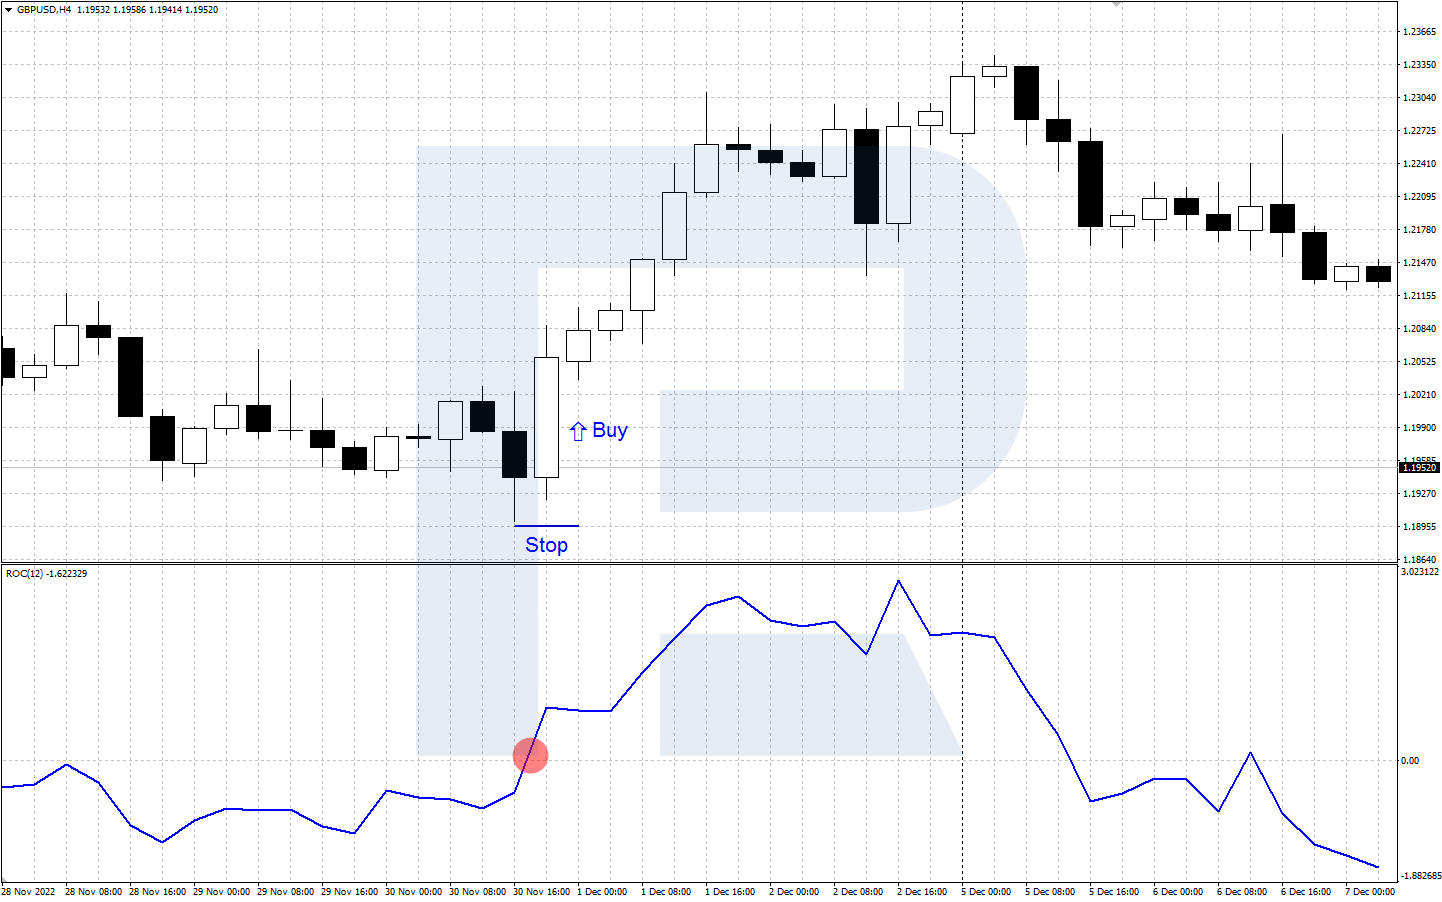
Crossing level 0: buy signal
- This signal occurs when the indicator line crosses the central 0 level from bottom to top
- Once the Rate of Change is above 0, a Buy position can be initiated
- Stop Loss is set at the nearest local low
- A Take Profit can be taken when the price reaches a strong resistance level
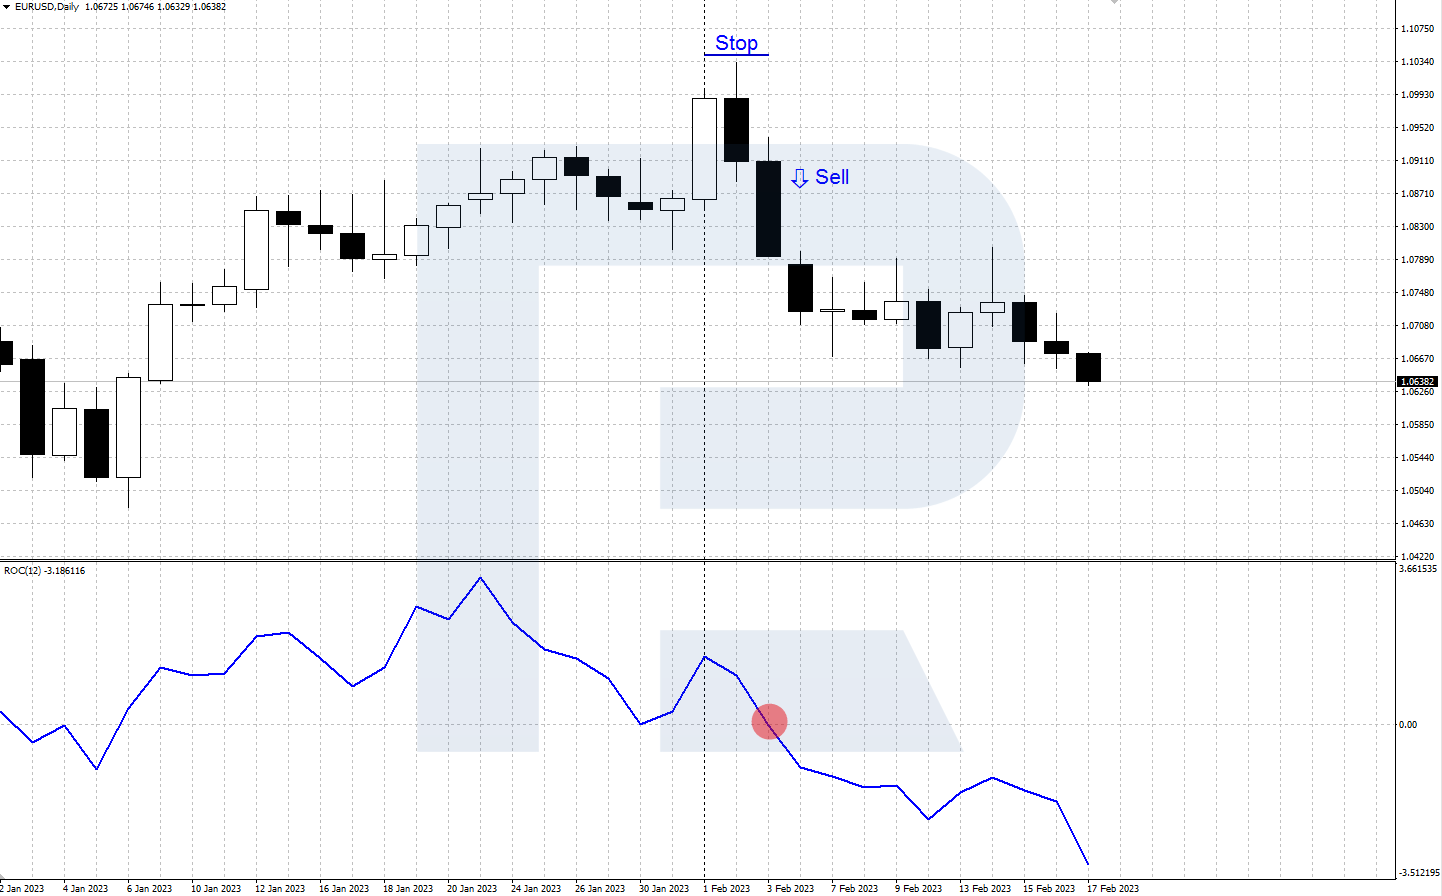
Crossing level 0: signal to sell
- This signal appears when the ROC line crosses the central 0-axis from top to bottom
- Once the indicator is below 0, a sell position can be opened
- The stop loss is set at the nearest local maximum
- A Take Profit can be taken when the price approaches a strong support level
Divergence: a buy signal
- A bullish divergence is formed when a new low, which is lower than the previous one, is formed on the price chart during the decline, and the corresponding low of the ROC line is at or above the previous one. The divergence that arises signals a change from a downward movement to an upward one
- Once the price reverses upwards, a buy position can be opened, with the Stop Loss set at the last low

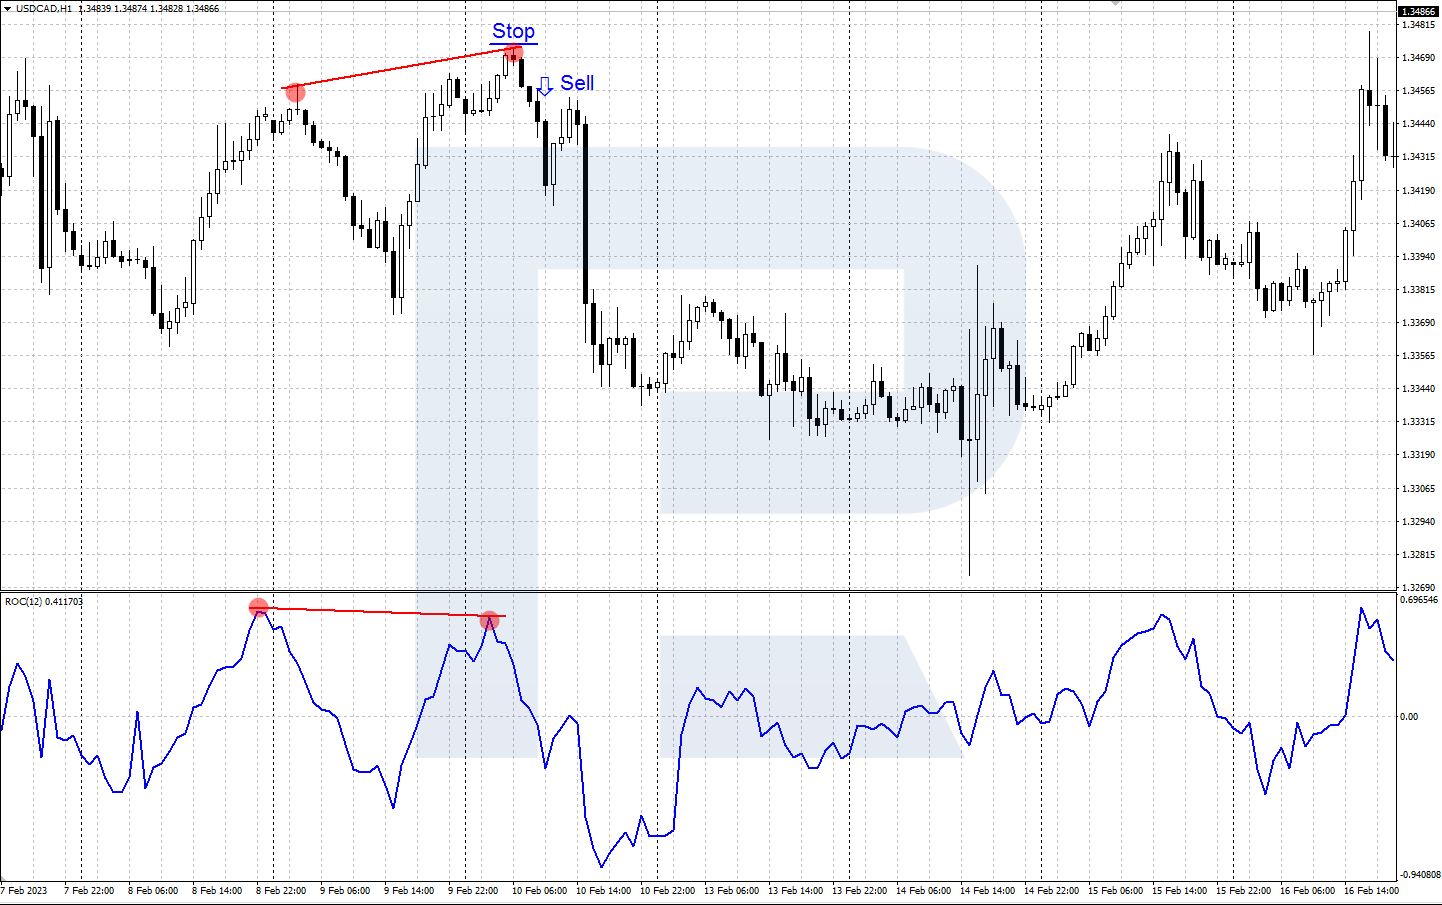
Divergence: a signal to sell
- A bearish divergence occurs when a new maximum, which is higher than the previous one, appears on the price chart during an upward movement, and the corresponding maximum of the ROC line remains at or below the previous one. The divergence that arises can be followed by a reversal downwards
- After a downwards reversal, a sell position can be opened and the Stop Loss is set at the nearest maximum
Conclusion
Rate of Change is an indicator of price changes that helps to determine the direction of the current market movement and find promising points to open transactions. It is recommended to use it in trading together with other tools, such as other indicators, technical analysis tools and candlestick patterns. Before you start trading, you should get positive trading statistics on your demo account.


