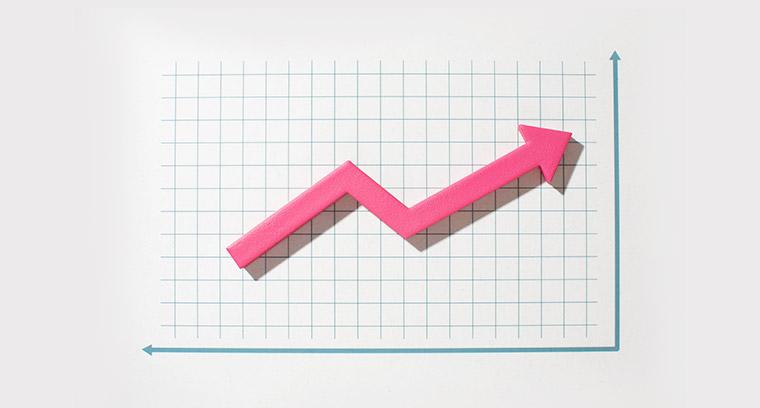
Trend
A trend is a direction in which the market or the price of an instrument is moving. Trends can be upward, downward or sideways and are common to all types of markets.
4 minutes for reading
What is a trend
A trend is a stock market term for the direction of the market. In technical analysis, traders determine direction using trend lines or the position of highs and lows on a price chart.
Rising price peaks characterise a bullish trend: as the trend progresses, they form higher than the previous ones. Falling price peaks characterise a bearish trend: as the trend develops, they form lower than the previous ones.
Experienced investors recommend working in the direction of the prevailing trend in the market: it is easier for the price to move in that direction. But some traders look for trend reversals using graphic patterns because any trend ends sooner or later.
How to identify a trend
Traders use various tools to identify the trend on a price chart. One of the simplest is the Moving Average. This is a line plotted against closing prices.
If the price is above the Moving Average, the trend is upward, and traders are looking for buying signals to use the opportunity to open long positions.
If the price is below the Moving Average, the trend is downward, and traders are looking for sell signals, trying to use the opportunity to open short positions.
How the trend is developing
There is a general rise in price in an upward trend: highs are updated more frequently, and new lows are fewer and fewer. It is important to understand that a trend is a succession of ups and downs which turn out to be higher or lower than the previous ones. According to Dow's theory, a trend is in effect until it reverses.
The reversal of a bullish trend can be identified by declining highs: the price at some point cannot move higher, and lows and new highs, which are already lower than the previous highs, begin to form. This is the beginning of a downtrend.
A period when all highs and lows are roughly in line is called a flat or sideways market. Price moves in a range with clear upper and lower boundaries. Breaking one of them can signal the start of a bullish or bearish trend, depending on the direction of the breakdown.
Trend line
Drawing trend lines on a graph is the easiest way to determine the trend. In a bullish trend, the line is drawn through the lowest points on the chart, for which two declines are sufficient. In addition to demonstrating the direction of the trend, the line acts as support, so the next test of it may trigger an upward price rebound. Traders can tell the strength of the trend by the angle of the line: the greater the angle, the stronger the current trend.
In a bearish trend, the line is drawn through the highest points on the chart. Two peaks are enough to construct a downtrend line. In addition to demonstrating the direction of the trend, the line acts as resistance, so the next test of this line may provoke a pullback of the price downwards.
There are also significant disadvantages to trend lines: they often have to be redrawn as prices change. For example, in a bullish trend, prices may fall below the line, then quickly return and continue to rise. However, you will already have to draw another line through the new low to account for price behaviour.
Popular reversal patterns
The most popular patterns used by traders to identify market reversals:
- Double tops and bottoms are like the letters M and W. The M-top is the end of a bullish trend. The W-top is the end of a bearish trend.
- Head & Shoulders - formed at the end of a bullish trend and reflecting the failure of the bulls to renew the maximum, followed by a fall in price and a change in trend.
- The Triple Top and Bottom - patterns are similar to M- and W-type price structures. Only, instead of two-level tests, market participants make three. After an unsuccessful breakout attempt, a trend reversal occurs.
- V-shaped top - formed as a result of rapid price growth, but buyers need more strength to sustain such a rapid movement. Therefore, after a breakdown of the trend line, the price declines to previous levels.