How to Use Moving Average Indicator: Description and Trading

8 minutes for reading
What is a Moving Average (MA) indicator?
One of the most popular indicators (and, perhaps, the one that a trader first comes across starting their way on Forex) is the Moving Average (MA). The Moving Average belongs to the group of trend indicators and shows the average price of the chosen currency during a certain period of time.
With the help of the Moving Average a trader can detect the trend direction, receive a signal for opening a trade and filter noise, i.e. insignificant price fluctuations. The Moving Average is placed on the price chart, and depending on its position in relation with the price trading decisions are made.
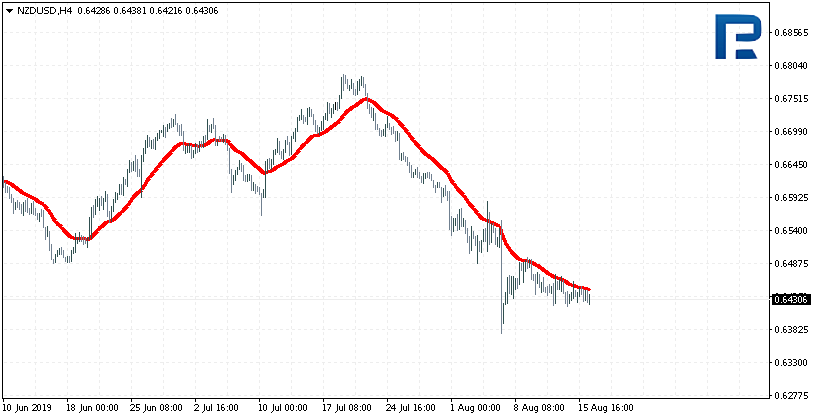
An example of a MA looks as follows:

One of the main parameters of the indicator is the length of the period. A period is a time indicator. For example, if on H1 you place period 26, the Average will be calculated for the last 26 hours. However, if you switch the same chart to H4, the last 26 of 4-hour candlesticks will be taken into account.
The Moving Average is called long if it is placed on a price chart with a long calculation period. In this case it shows the price reversal and the change in the trend direction with a bigger retardation, but at the same time it generates less false signals. If the period is rather short, the Moving Average is also called short, and the closer it is to the price, the more false signals it generates.
What is more, the Moving Average can be moved a certain amount of candlesticks to the right. Then visually it will go ahead of the price chart.
The MAs calculations
The Moving Average may be designed by several formulae, that is why we single out certain types of the MA:
- Simple Moving Average (SMA)
- Exponential Moving Average (EMA)
- Smoothed Moving Average (SMMA)
- Linear Weighted Moving Average (LWMA)
Formula for Simple Moving Average (SMA) calculation
The Simple Moving Average (SMA) is calculated as the sum of closing prices of all candlesticks during a certain amount of periods (say, 26 hours, as in our example) divided by the number of periods.
SMA = SUM (CLOSE (i), N) / N
Where:
- SUM is the sum
- CLOSE (i) is the closing price of the current period
- N is the number of periods.
The SMA equals the prices of every day (4 hours, 1 hour etc. depending on the chosen period). This means that to each next value we ascribe the same importance.
So, if during the calculation period there have been significant price surges, the SMA will take them into account together with the normal price movements.
Formula for Exponential Moving Average (EMA) calculation
The Exponential Moving Average (EMA) is calculated by adding to the previous average value the part of the closing price, actual at the moment of calculation.
Thus the biggest importanc belongs to the last values on the chart.
EMA = (CLOSE (i) * P) + (EMA (i - 1) * (100 - P))
Where:
- CLOSE (i) is the closing price of the current period
- EMA (i - 1) is the value of the Moving Average in the previous period
- P is the part of the price value.
The EMA is the most popular type of Moving Average for practical use and compensates for the drawbacks of the SMA, reflecting the current market situation clearly.
Formula for Smoothed Moving Average (SMMA) calculation
SMMA (i) = (SMMA (i - 1) * (N - 1) + CLOSE (i)) / N
Where:
- SMMA (i - 1) is the SMMA of the previous candlestick
- CLOSE (i) is the current closing price
- N is the period of smoothing.
Formula for Linear Weighted Moving Average (LWMA) calculation
The Linear Weighted Moving Average (LWMA) is calculated as each closing price of the chosen period multiplied for the importance coefficient, giving the biggest value to the nearest prices.
The formula looks as follows:
LWMA = SUM (CLOSE (i) * i, N) / SUM (i, N)
Where:
- SUM is the sum
- CLOSE (i) is the current closing price
- SUM (i, N) is the sum of the importance coefficients
- N is the period.
The LWMA and SMMA also solve the problem of equaling the price significance during the calculation period.
Calculation of the MA may base on the closing prices, opening prices, maximal or minimal prices, or weighted average prices. The most widespread way is use of closing prices, because they are the most important ones.
Trading signals of a Moving Average
When the price crosses the Moving Average, it signals to enter the market, and the shorter the period of the average, the earlier signal the trader receives. At the same time, it is worth remembering that the closer the average to the price, the more frequently the trader will receive false signals.
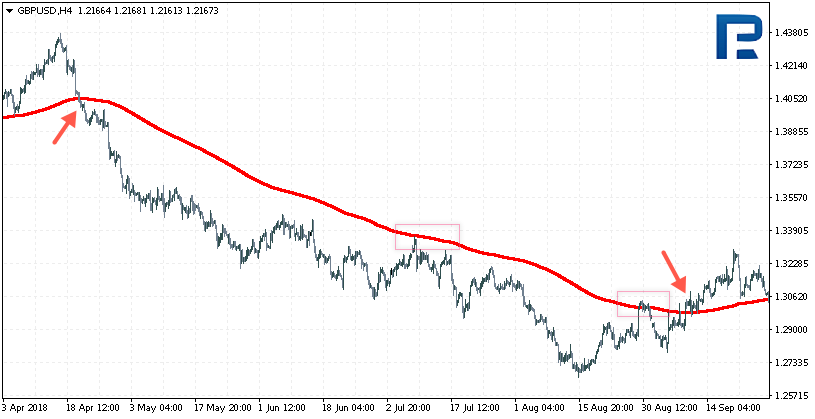
An example of entering the market upon crossing the Moving Average by the price looks as follows:

Interpreting entrance signals is rather easy: if the price has crossed the average top down, this is a selling signal. If it goes upwards, selling positions should be closed and, perhaps, some buying positions opened.
What is more, the Moving Average may act as support in an ascending trend and as resistance in a descending one.
If in a downtrend the price approaches the Moving Average from below, the trader may look for a selling trade or fill up the existing selling trades. Conversely, if in an uptrend the price approaches the average line from above, the trader may look for buying trades or fill up the existing ones.
The open selling and buying trades close as soon as the Moving Average gives a reverse signal. In other words, we close selling trades when the price crosses the MA from below and the candlestick that has broken through the MA, closes above it (keep in mind the timeframe: if you are working on an H1, the candlestick should be on H1 as well). We close buying trades when the price crosses the MA from above, while the breaking candlestick closes below the line.
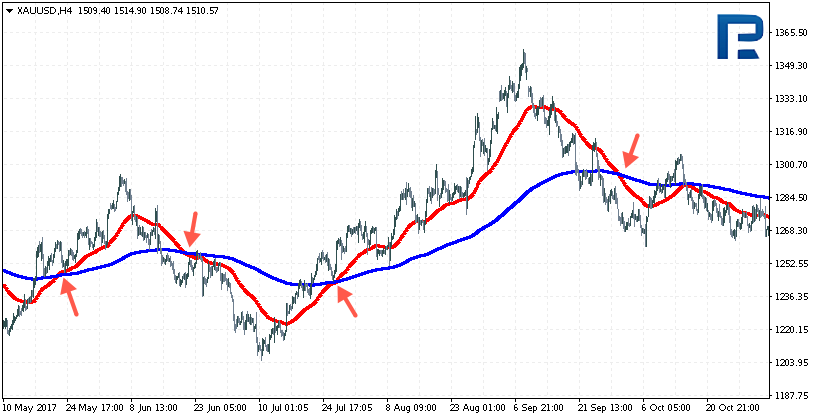
In addition, traders practice using combinations of several Moving Averages on different periods. In order to cut down on the number of false signals, they enter the market upon crossing of two averages. The MA with a shorter period is more mobile and reacts on price changes faster, while the MA with a longer period is slower, dragging behind the price. So, if a short Moving Average crosses the long one from above, it signals buying. The buying trade closes upon receiving a reverse signal, i.e. when the short MA crosses the long one from below. For selling the conditions are exactly vice versa: when the short Moving Average crosses the longer one from above, we open selling trades. On a reverse signal the trades close.
This is what entering the market upon crossing of the two Moving Averages looks like:

The Moving Average has become widespread not only in the "pure" price chart analysis but also as the basis of other technical indicators. The MA can both be used on price charts and on a separate window of another indicator; so to say, it can be used for smoothing the values of other indicator, which helps receive additional signals in the points where the Moving Average crosses the lines in the other indicator.
It is worth stating that one should not rely solely upon Moving Averages. They are to be used together with other indicators and methods of graphic analysis, in order to get several confirmations of received signals.


