Top 10 Forex Indicators That Every Trader Needs
7 minutes for reading
Forex Indicators have long been introduced to the trading systems of many traders. As a minimum, they are of good help in chart analysis, as a maximum, they are the base of the whole trading system. Algorithmic trading, which means automatizing the work and creating Expert Advisors or trading robots, is also mostly based on the signals of various indicators.
In this article, we will review the ten most popular indicators for the analysis of and trading on financial markets.
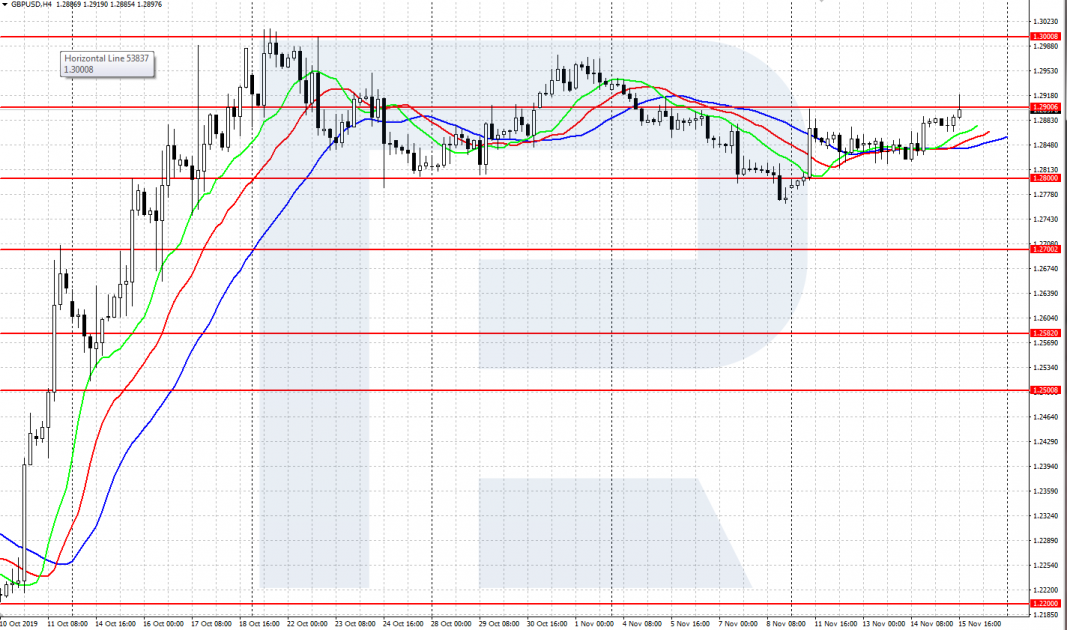
Moving Average indicator
It will hardly be too bold to say that the Moving Average is the queen of all indicators, as it is among the simplest and the most popular ones. Apart from the immediate use, it serves as the base for some more complicated indicators.
The Moving Average is the average price indicator for a certain period. There are several types of Moving Averages: the simple, exponential, smoothed, linear weighted ones. They are slightly different in terms of calculating but their essence remains the same: they demonstrate the dynamics of the averaged price during a certain period.
A Moving Average is represented as a line directly on the price chart. It shows the direction of the trend well: a declining MA indicates a downtrend, while a growing MA means an uptrend. To get trading signals, we normally use two or more Mas for different periods.
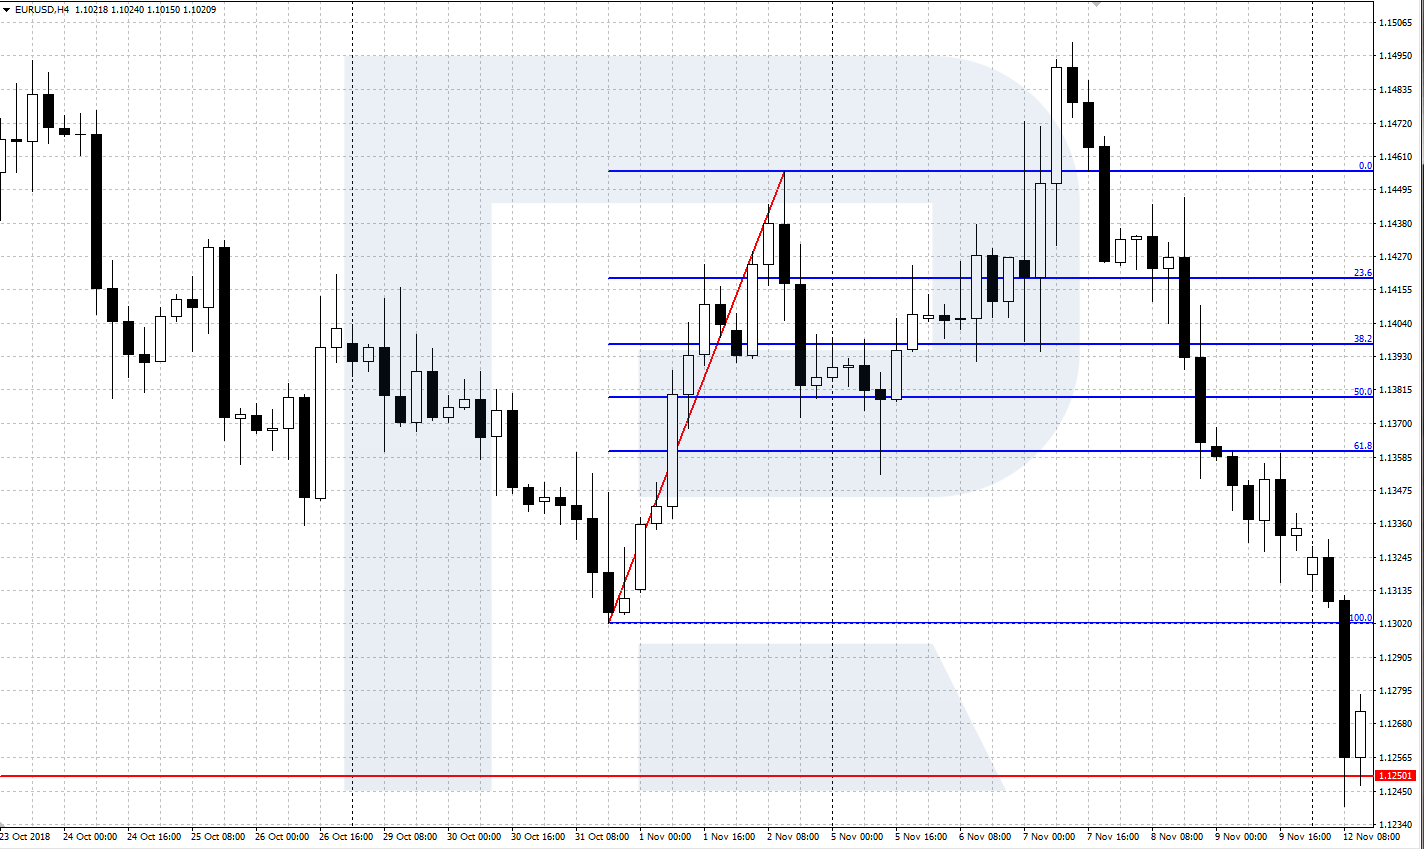
Fibonacci indicator
The indicator is based on the well-known sequence of numbers of an Italian mathematician Fibonacci (Leonardo of Pisa). It uses the relations of the numbers in the sequence: 23.6, 38.2, 50.0, 61.8, 76.4 – to detect the presumed correctional levels. The strongest correctional levels are considered to be 38.2, 50.0, 61.8.
The Fibonacci indicator is a grid of several levels of correction applied on the price chart. We choose a strong complete price impulse on which we apply the Fibo levels. Then we wait for the correctional movement to end on one of the levels and enter the trade in the direction of the initial impulse.
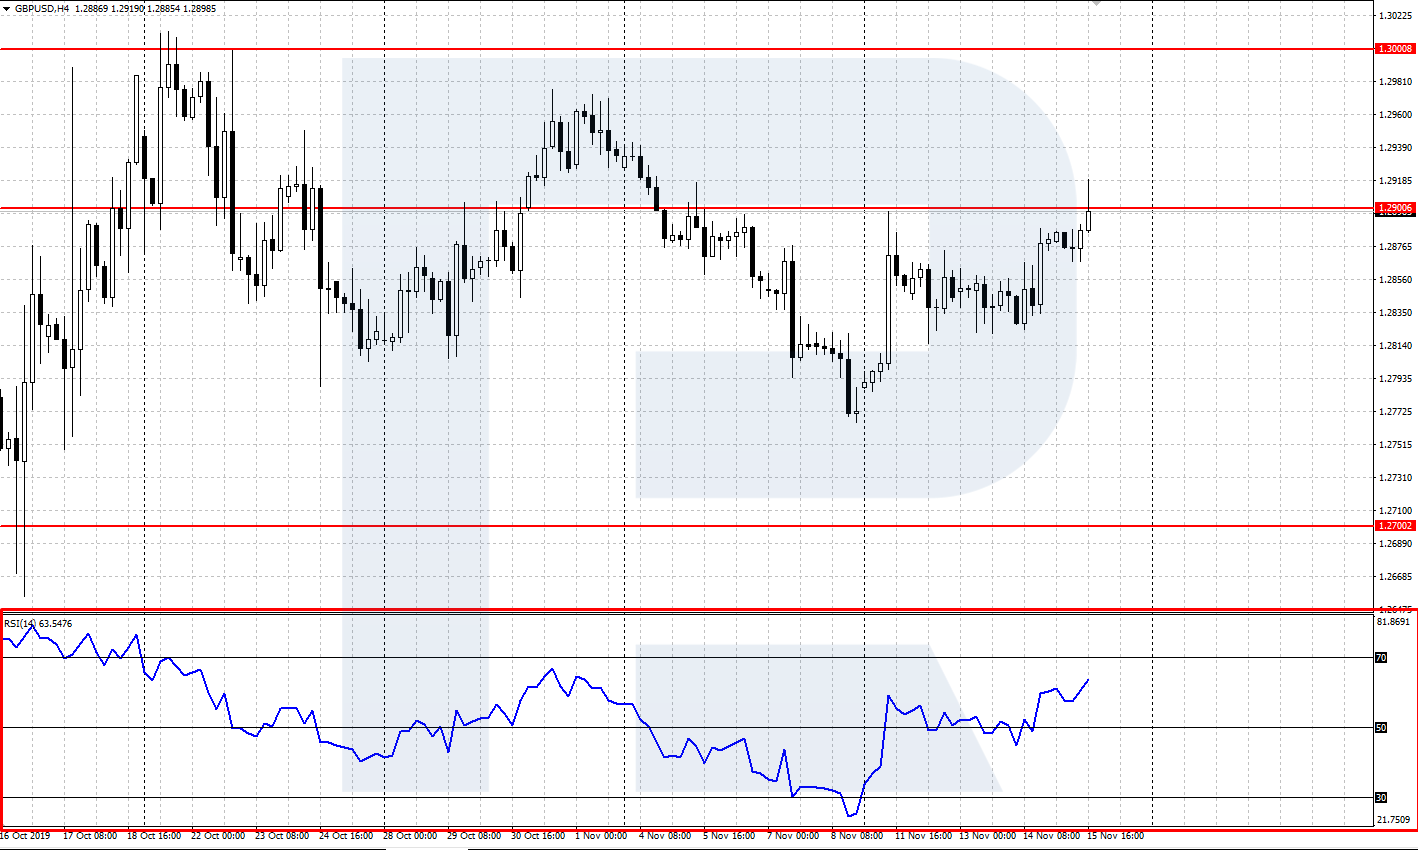
Relative Strength Index (RSI) indicator
The RSI indicator pertains to the group of oscillators. The author and advocate of this indicator is J. Welles Wilder. The RSI shows the position of the price in comparison to the previous period. It gives the best signals in a flat, showing how far the price has fluctuated from the average values.
The RSI indicator is calculated in a separate window under the price chart. For tracking the trading signals, the levels of 30, 50, and 70 are singled out. The area above 70 is called overbought, and there, selling is recommended. The area below 30 is called oversold, and there we search for the opportunities to buy. If there is a clear trend on the market, it is recommended to take only the signals along with the trend from the RSI.
Bollinger Bands indicator
The Bollinger Bands indicator was created in 1984 by John Bollinger. It is a trend indicator based in the Moving Average. It consists of three lines: the middle one is a classical MA, the remaining two are standard deviations up- and downwards. These three MA's make the Bollinger Bands indicator very easy-to-understand.
The Bollonger Bands indicator is represented immediately on the price chart. The upper and the lower lines of the indicator create some sort of a price channel, which the quotations move in. For trading, we use a bounce off the indicator lines or an escape from its boundaries. The Bollinger Bands show the beginning of an impulse movement after the price escapes a narrow concentration area.

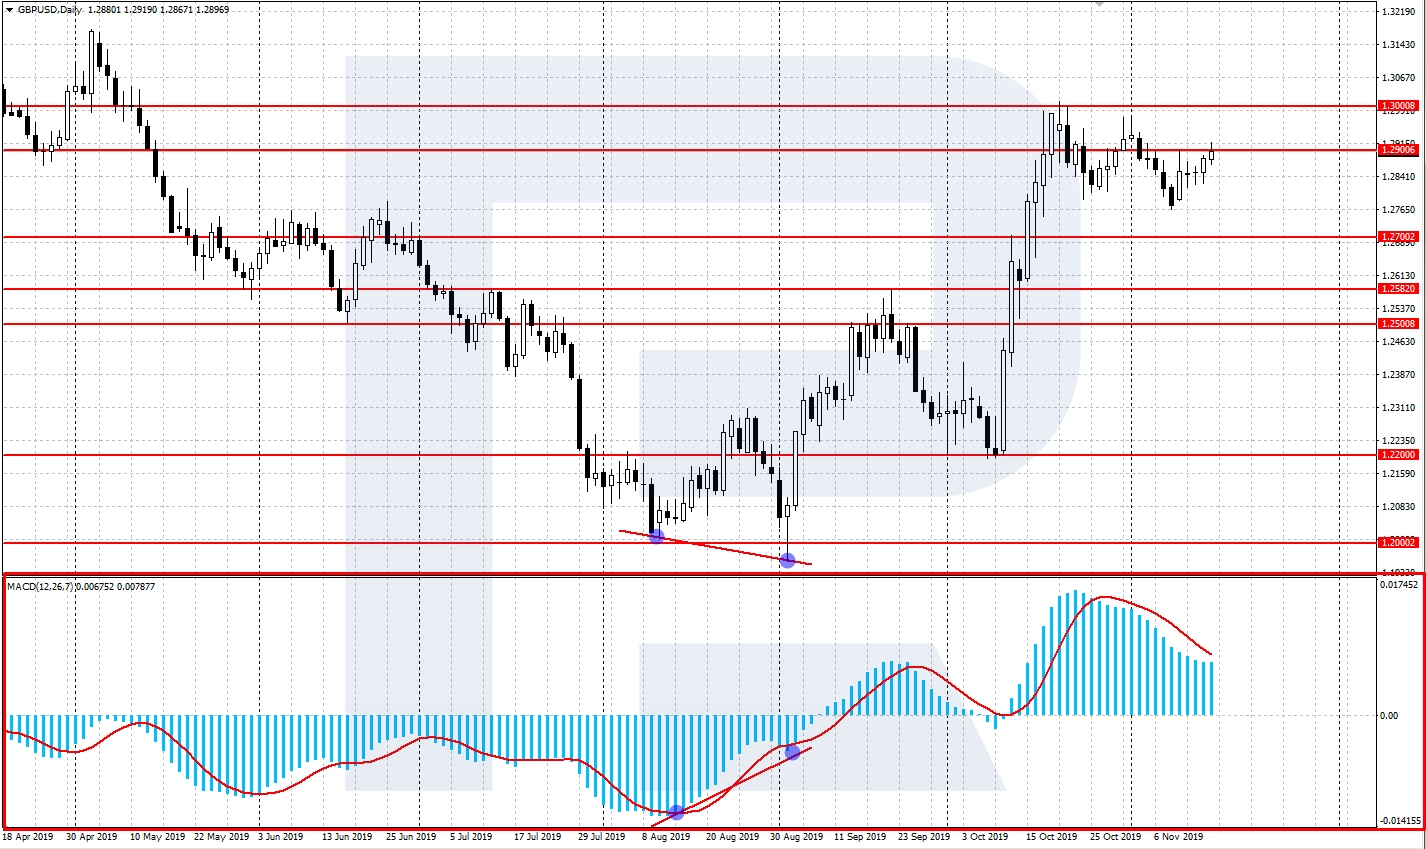
MACD indicator/ Moving Average Convergence/Divergence
MACD is very popular indicator was designed in 1979 by Gerald Appel. As we may see from the name, the indicator is based on the Moving Average together with other parameters. Though it conditionally pertains to the oscillator group, it is much more universal.
MACD is represented in a separate window under the price chart. It consists of two lines, one being a histogram. One of the strongest signals of the indicator is a divergence of the extreme values (maximums/minimums) of the price chart and the indicator. Such a signal may forecast the end of a price movement and the beginning of a correction or even a market reversal.
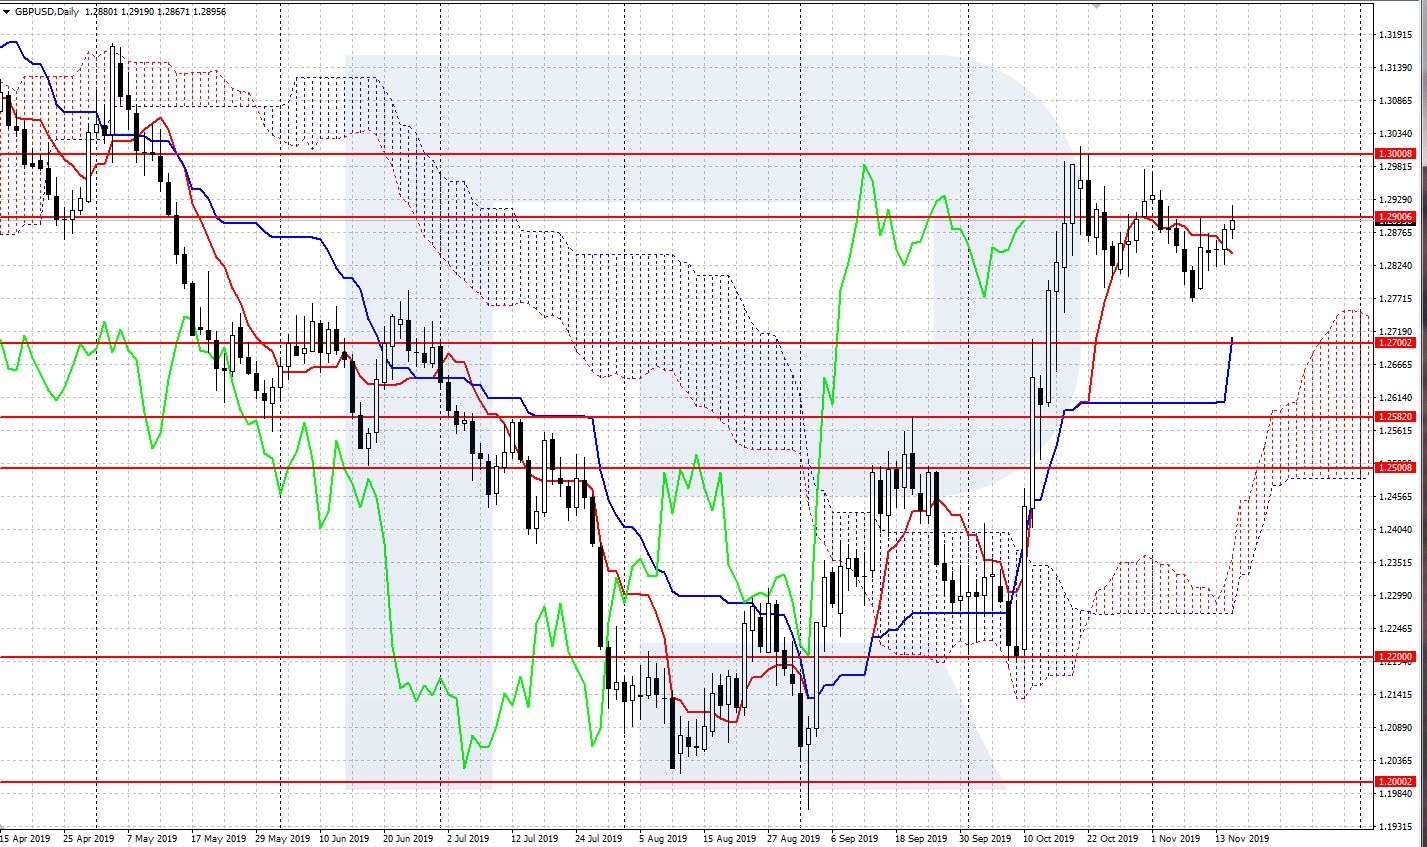
Ichimoku Kinko Hyo indicator
This is a supreme indicator from Japan, created in 1926 by Goichi Hosoda also known under his pen name Ichimoku. It consists of five lines with different calculation formulae, two of them constituting a so-called Ichimoku Cloud. Conditionally pertains to trend indicators, tracks the direction and the potential of the current trend very well.
Ichimoku is drawn directly on the price chart. The main trading signals are crossings of the lines Tenkan-sen and Kijun-sen, as well as a breakout/bounce off the boundary of the Cloud created by the lines Senkou Span A and Senkou Span B. To enhance your trading, the Ichimoku indicator is recommended for use with the candlestick analysis.
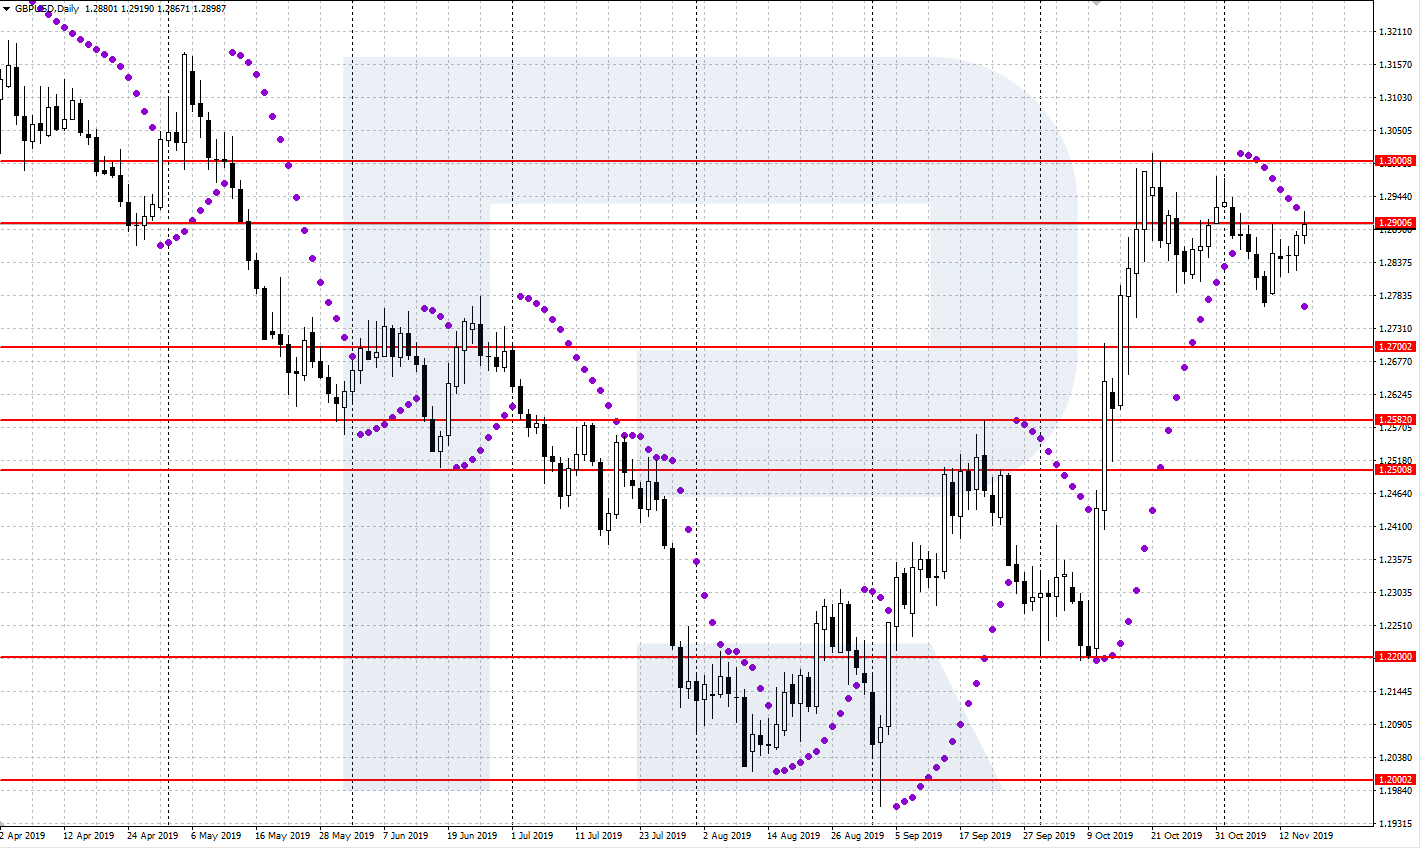
Parabolic Sar indicator
The Parabolic Sar indicator was invented by J. Welles Wilder in 1976. The indicator n the chart reminds of a parabola, while SAR stands for “Stop And Reverse”. The indicator belongs to the trend group, it tracks trend movements very well and gives good signals for the end of the trend.
The Parabolic Sar looks like a group of dots on the chart. If the price is below the dots, the trend is descending; if it is above the dots, the trend is ascending. The Parabolic dots may be used as landmarks for Stop Losses. If the position is open along with the trend, the stop order can be gradually moved with the dots until the trend reverses and the position closes.
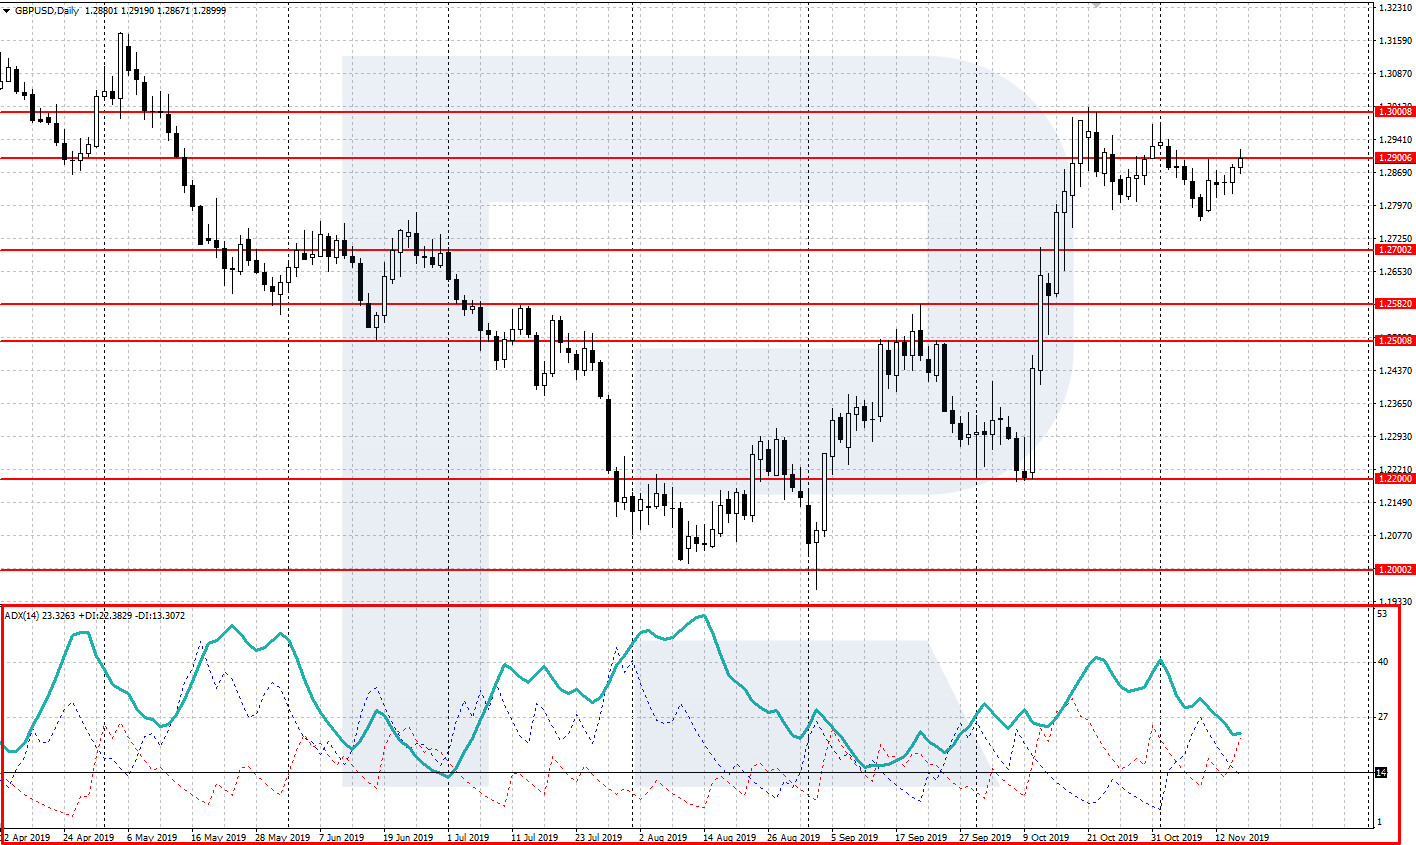
ADX indicator/ Average Directional Movement Index
This indicator was also created by J. Welles Wilder. The ADX belongs to the group of trend indicators and consists of three lines: ADX is the main line, +Dl is the index of the positive movement, and -Dl is the index of the negative movement.
The ADX indicator is calculated in a separate window under the price chart. The main signal is an upward movement of the ADX line and crossing of the +Dl and -Dl lines. The growth of the ADX line indicates a strong trend, while the remaining two lines show its direction. If +Dl is above -Dl, the trend is ascending, and vice versa: if -Dl is above +Dl, the trend is descending.
Pivot Points indicator
The author and advocate of this indicator is a trader and mathematician Henry Chase. The name Pivot Points can be understood as “reversal points”. The indicator calculates certain price levels based on price changes during the previous trading periods (day, week). It consists of the main Pivot level and supplementary support and resistance levels.
The Pivot Points indicator is calculated on the price chart as a grid of various price levels: the main Pivot level, support levels S1, S2, S3, and resistance levels R1, R2, R3. The main trading signal is a bounce off one of the support/resistance levels. After that, a return of the quotations to the main Pivot level is expected.

Alligator indicator
The Alligator indicator was created by the king of exchange trading Bill Williams. The indicator is based on three SMAs. Each of the Mas symbolizes the jaw, teeth, and lips of an alligator. It belongs to the group of trend indicators and gives clear signals of the beginning of a new trend on the market.
The Alligator indicator is situated right on the price chart. Three Mas, colored in three different shades, forms the main signal about the beginning of a new trend. After the consolidation of the price in a small range, a new movement begins, the alligator opens its mouth: the three lines cross one another and then start moving along the new trend.
Summary
Above, we have discussed some of the most popular Forex indicators. It is up to you to decide which ones to add to your system. I prefer the Moving Average, Fibo, MACD, Ichimoku, RSI. For me, the indicators are helpers giving good signals in addition to tech and fundamental analysis.