How Can ADX Help a Trader?

6 minutes for reading
This instrument has been created by J. Welles Wilder and described in detail in his book "New Concepts in Technical Trading Systems", as well as many other indicators like the RSI or the Parabolic Sar.
However, the ADX, or the Average Directional Movement Index, has not become as widespread as, say, the RSI. It is most likely due to the complexity of its formula; what is more, it is more of a trend indicator, and a beginner is seldom ready to trade large movements with large Stop Losses.
In this post you can find information about:
Indicator peculiarities
Big money is said to be made right at the moments of strong trends, while flats mostly bring small losses. The ADX indicator will help define whether there is a trend or a range on the market.
Unfortunately, it cannot show the direction of the trend, as the Moving Average would do; it only shows whether the trend is strong, or weak, or lacking. Well, the main task of a trader on the market is to find a trend and follow it; and as the author of the ADX admits, this indicator might be one of the best of his research from the book.
Forming the ADX indicator
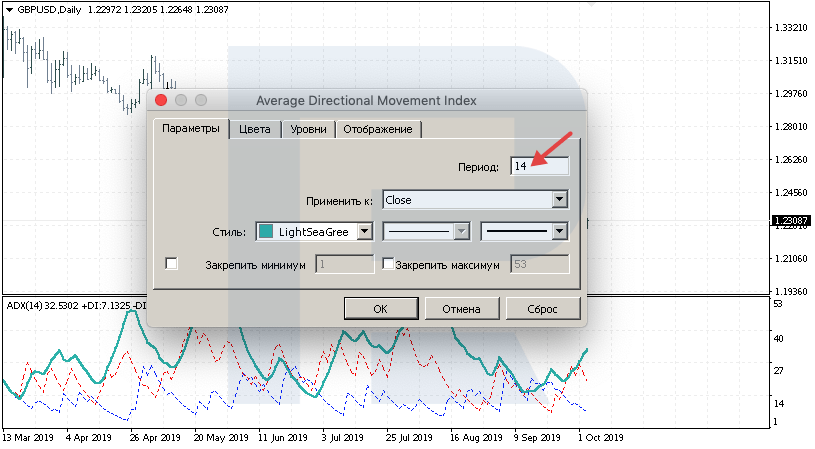
The indicator is based on two other indicators: +DI and -DI. They are displayed on the indicator chart as two dotted lines. The +DI measures the strength of ascending movements, while the -DI indicator does so with descending ones. The period suggested by the author is 14; he pays special attention to it, like in the RSI, for example.
When calculating the DI, it is supposed that if there is a bullish trend, today's peak should be higher than yesterday's one. And if there is a bearish trend, then today's minimum should be lower than yesterday's one. The difference between today's and yesterday's maximums is +DI and the difference between today's and yesterday's minimums is - DI. If the market failed to renew the maximum or minimum, the movement is simply ignored. Then the positive and negative DIs are averaged and divided by the average True Range (TR).
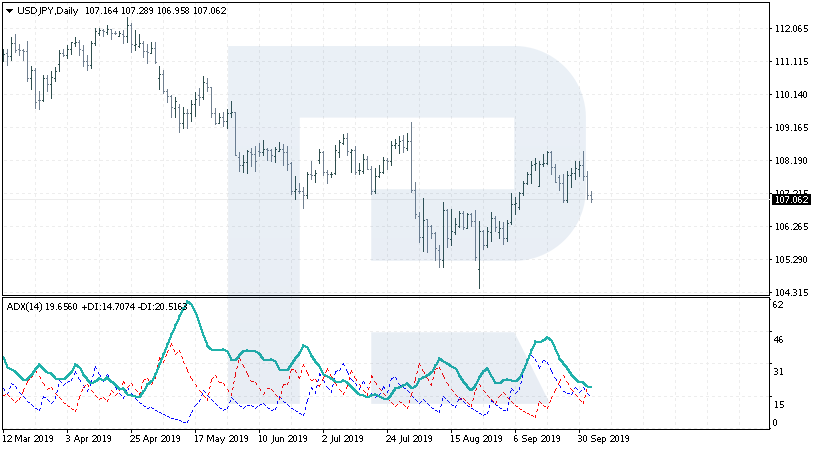
The ADX itself is calculated on the basis of +DI and -DI and can measure the strength of the trend. The bigger the ADX value, the stronger the average trend is. If the ADX line lies low, we can say that the market movement has no specific direction.
Apart from being a trend indicator, the ADX is also an oscillator with a minimum at 0 and a maximum at 100. However, its values going above 60 is a rare thing to see; at the same time, on volatile markets, the values may be 70-80.
It is considered that in case the values decline below 20, there is a weak trend on the market, while if they rise above 40-60, the current trend may be very strong. It is important to remember that the growth above 40 does not imply the trend being bullish, it only means that the trend is very strong, be it an uptrend or downtrend.
Use of the ADX
The author supposed that such signals form at the moment of +DI and - DI crossing. If +DI crosses -DI bottom-up, we may regard it as a signal to buy, while if +DI crosses -DI top-down, the signal is to sell. However, in a flat the trader may get lots of such crossings, all being false.
Let us have a look at an example with the EUR/USD currency pair. As we may see, at tge moment of strong growth the ADX values rose to 61, after which the trend reversed to a flat. At that moment, the values fell below 20, which means low volatility and a lack of direction in the movement.
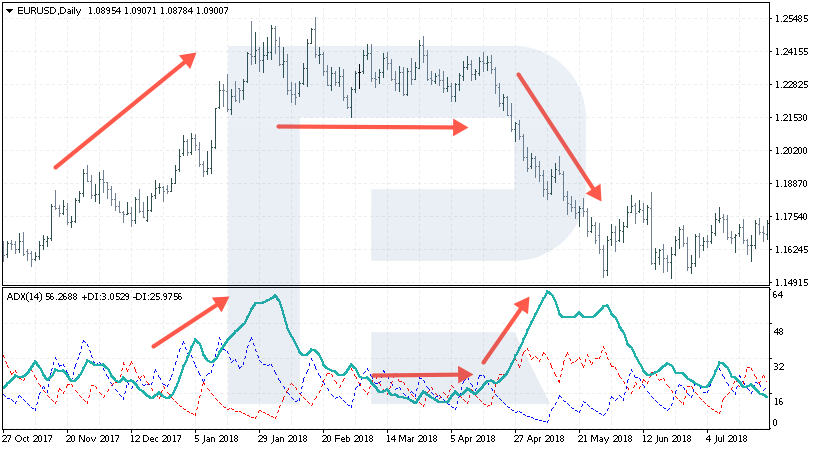
Then, the ADX values rise steeply again, but the prices do not grow, conversely, they demonstrate a decline. Here, we should pay attention to the fact that a reversal (or a simple bounce) again happened when the indicator values reached 60-61.
Judging by the above mentioned, we may conclude that when the indicator values test 60, the potential for trend continuation is minimal, so we should most likely expect a correction. As soon as the correction on the indicator happens, we may speak about the probability of trend continuation. However, full-scale use of this approach require certain experience.
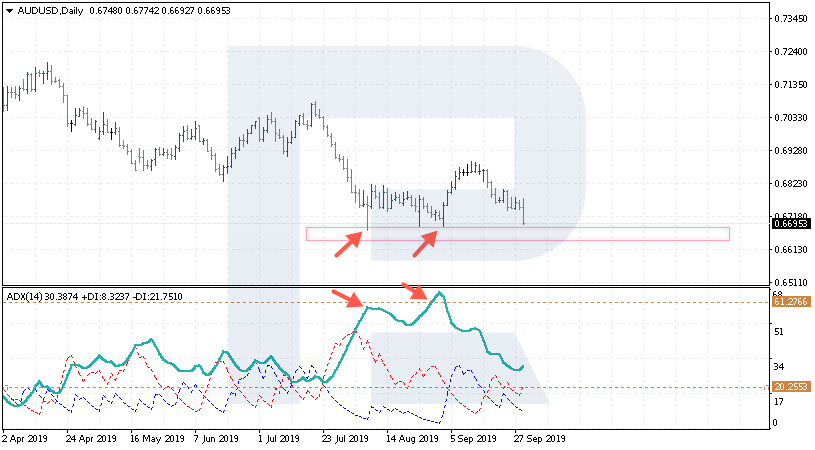
Let us have a look at an example with the AUD/USD. On D1, at the moment of testing the support level near 0.6680, the ADX values were testing 60,which potentially signified a correction. Even now, we can see the price drop, but the indicator values are much below 60 and still, higher thatn 20, which suggests the continuation of the current trend and a breakaway of the support area around 0.6680, which the market had failed to break through before.
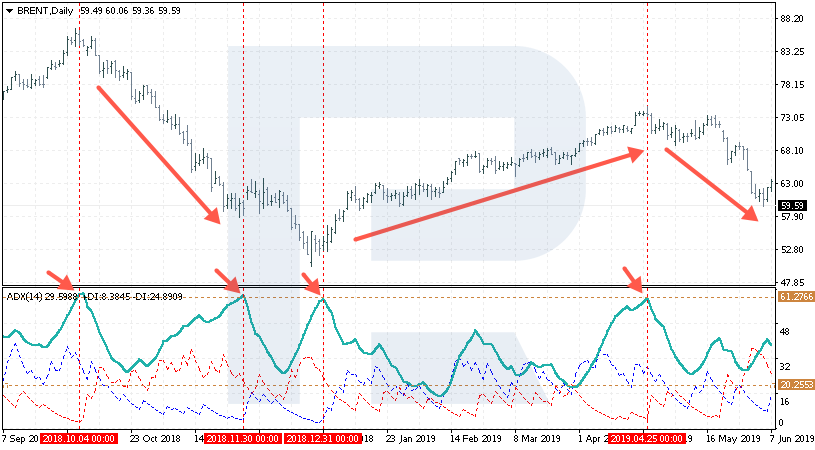
The daily chart of Brent also looks curious. There was a strong downtrend there, and then a bullish trend began. As soon as the indicator values rose over 60, the trend made a reversal or corrected. However, crossings of the +DI and -DI were not efficient here either.
Pros and cons of the ADX
As with the Moving Averages, we can combine several timeframes and follow the trend on the smaller ones. However, crossings of the +DI and -DI lines do not always give good signals, and the author himself gave such examples when he had to wait for long movements against him to end. The difficulty of the ADX is mostly in the fact that it requires experience and long-time following the indicator along different stages of the market.
On the other hand, its huge advantage is that it helps determine when the trend slows down, which might mean a reversal or the beginning of a strong correction. As we may see in the examples, growth over 60 most often signifies a serious decrease in the trend power. With this instrument, we can also quickly define good trends on the market and the potential development of these movements. If the values are below 20, the movements in a flat, so we can start using a suitable strategy. As soon as the values reach 40, there appears a trend on the market, and we better follow it than look for a reversal.
However, the ADX is very good at finding reversals; they might not be signaling to sell or to buy, but the trader will understand that the market is unlikely to move further, so they can lock in profit.