How to Use Awesome Oscillator in Trading: Main Signals
5 minutes for reading
In this article, we will discuss an interesting indicator called Awesome Oscillator. It was created and initially added to his trading strategy by a famous trading expert Bill Williams.
How does Awesome Oscillator work?
The author of Awesome Oscillator (AO) Bill Williams created it for his well-known trading system Profitunity. Judging by the name and the feedback of the author, he was quite happy with the indicator.
Awesome Oscillator is based on the difference between the two Simple Moving Averages (SMA). The convergence and divergence of the fast SMA (5) and the slow SMA (34) allows defining the direction and the strength of the movement and finding reversal points on the chart. The principle of the Awesome Oscillator work is quite similar to that of the popular MACD indicator.
Awesome Oscillator gives an idea of the direction in which the market is moving. If it rises above 0 and demonstrates highs, there is an uptrend on the market. If the indicator is below 0, renewing local lows, the market trend is descending. A divergence signals an upcoming reversal or correction.
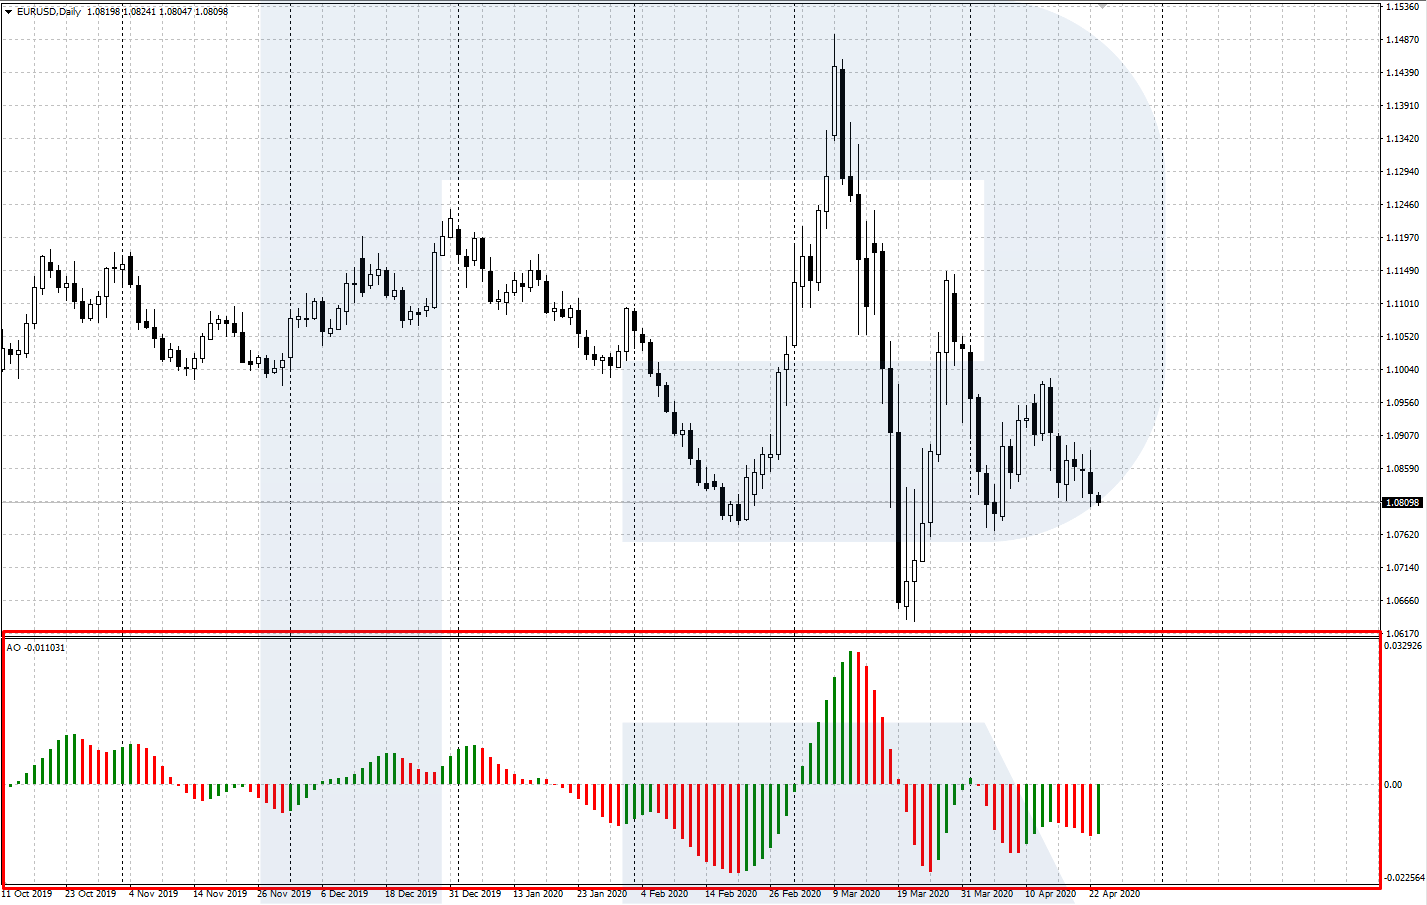
Awesome Oscillator is represented in a separate window under the price chart as a colored bar histogram. The growing bars of the histogram are colored green and the descending ones - red. The indicator values are not fixed, the central axis is 0. Awesome Oscillator is included in most of the popular trading terminals, MT4 and MT5 among them.


Awesome Oscillator characteristics and settings
To add the Awesome Oscillator to the instrument chart in MetaTrader 4 and 5, open the Main Menu: Insert - Indicators - Bill Williams - Awesome Oscillator.
The calculation formula of the indicator is the difference between the values of the two SMA (periods 5 and 34) at the average price:
AO = SMA (MEDIAN PRICE, 5) - SMA (MEDIAN PRICE, 34)
MEDIAN PRICE = (HIGH + LOW) / 2
Where:
- MEDIAN PRICE is the average price of the period
- HIGH is the maximal price of the candlestick
- LOW is the minimal price of the candlestick
- SMA is a Simple Moving Average.
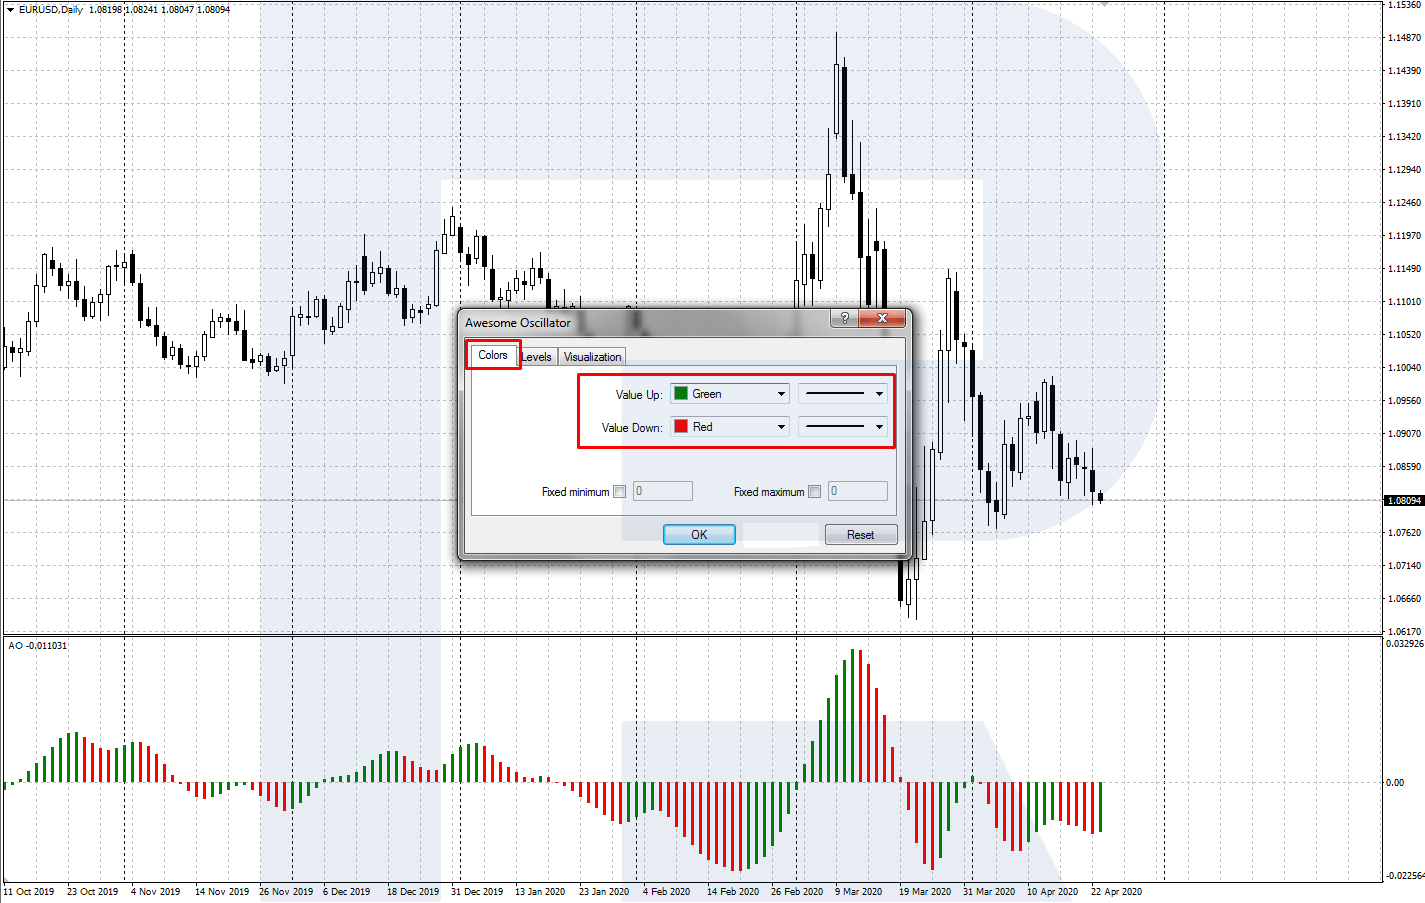
When installing Awesome Oscillator, you may set the color and width of the growing and descending bars. Other parameters are set by default and may not be changed.


Awesome Oscillator trading signals
Let us discuss the three main signals given by the Awesome oscillator.
Saucer
The Saucer signal forms when on the Awesome Oscillator histogram appears a cavity looking like a saucer bottom up or down. Saucer means that the correction is coming to its end, and the price will head in the direction of the main trend.
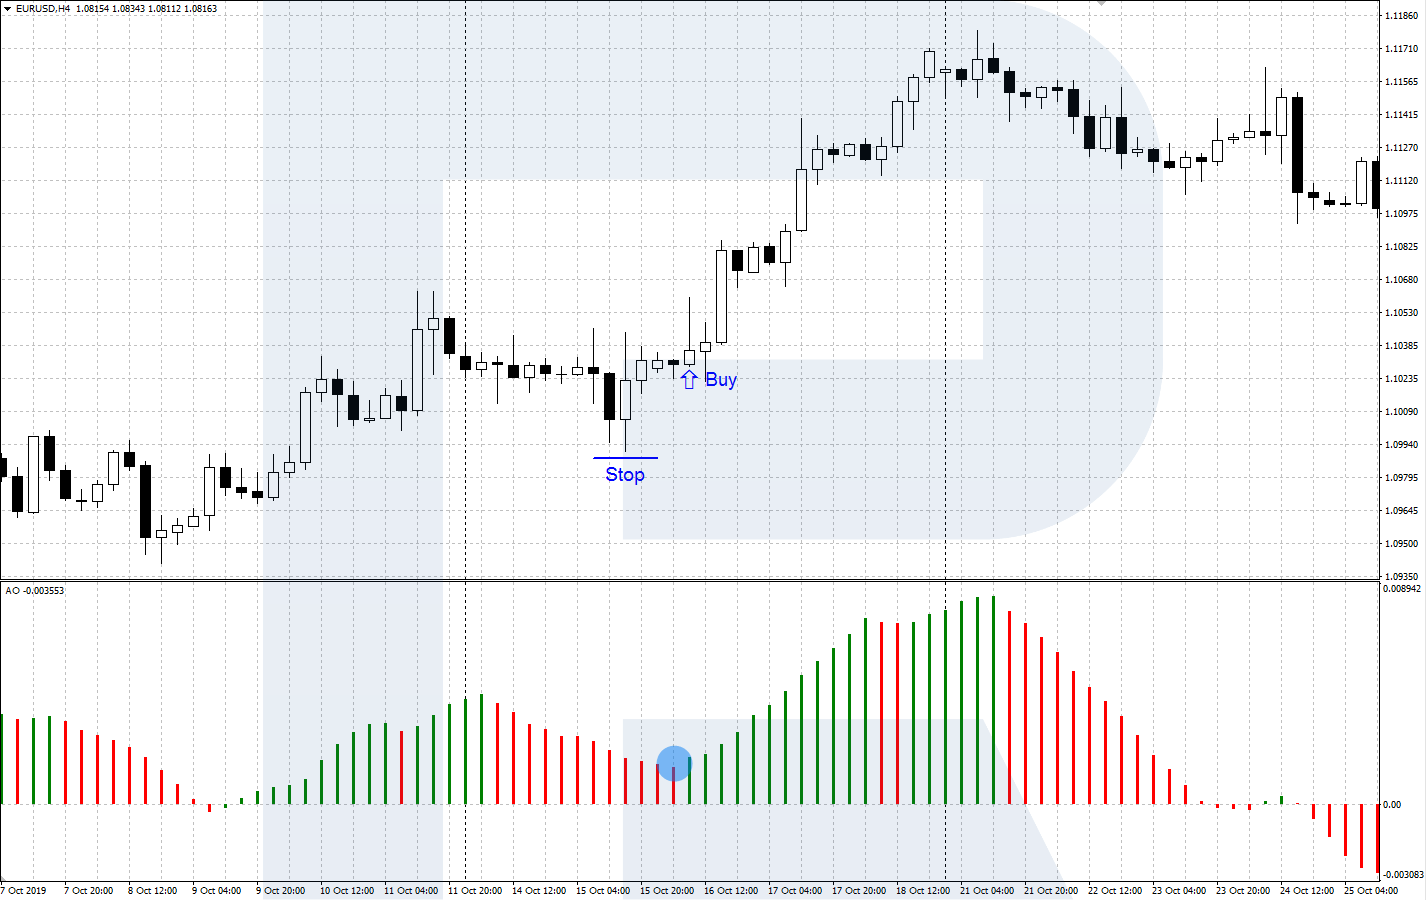
A signal to buy
It appears in an uptrend when the Awesome Oscillator histogram is above 0. After another high, the bars start declining and turn red.
If the histogram does not go below 0 and reverses upwards, there appears a green bar, forming a Saucer. Open a buying trade with a Stop Loss behind the local low.
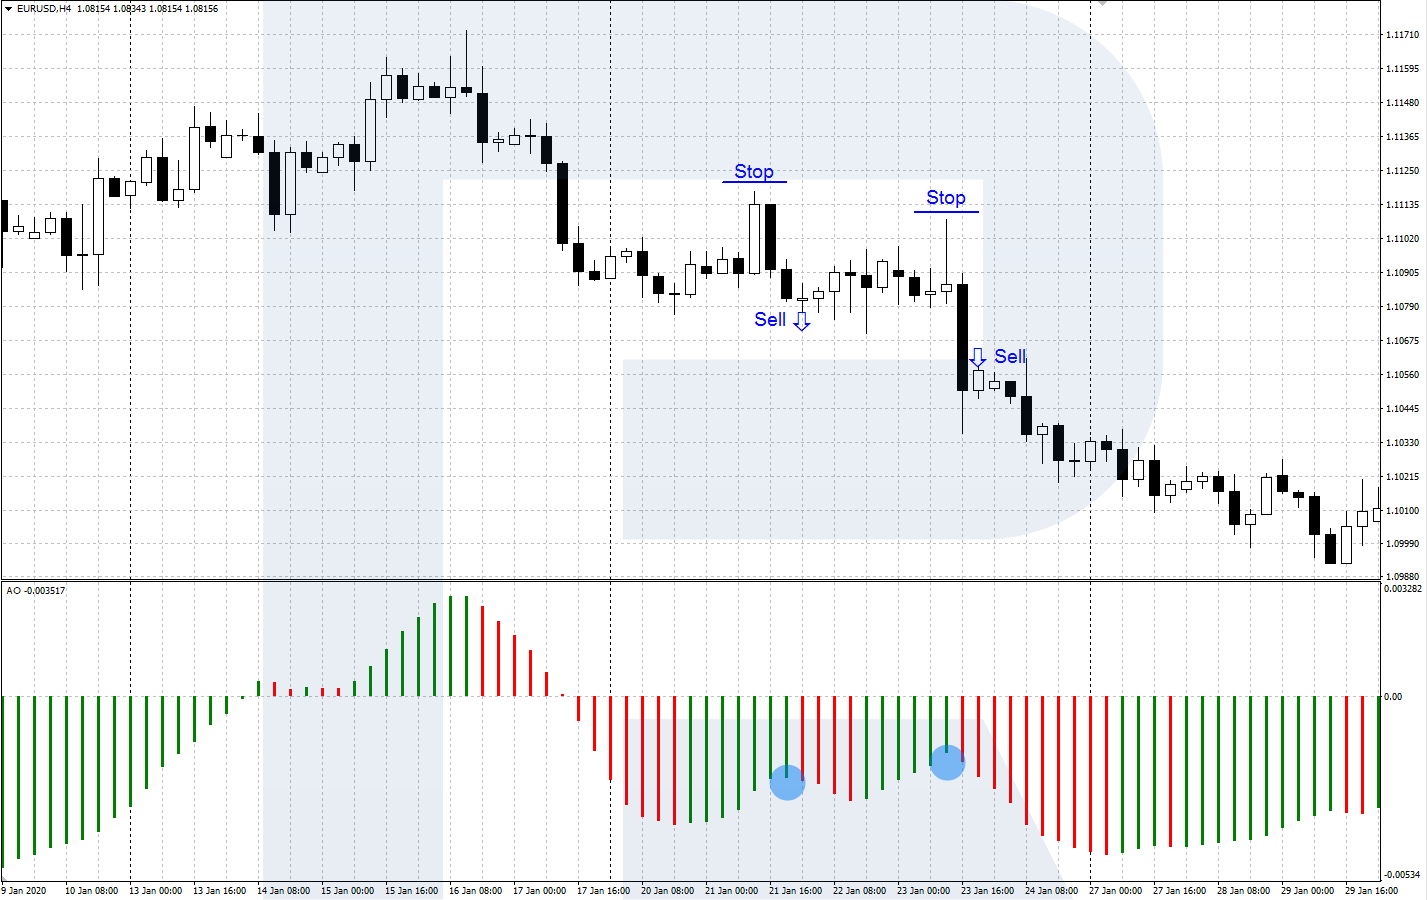
A signal to sell
It appears in a downtrend when the Awesome Oscillator histogram is below 0. After another low, the bars start growing and turn green.
If the histogram does not go above 0 and reverses downwards, there appears a red bar, forming a Saucer. Open a selling trade with a Stop Loss behind the local high.
The crossing of the zero line
The central axis of the Awesome Oscillator is 0. If the histogram crosses this level upwards or downwards, it signals to enter in the direction of the current impulse.
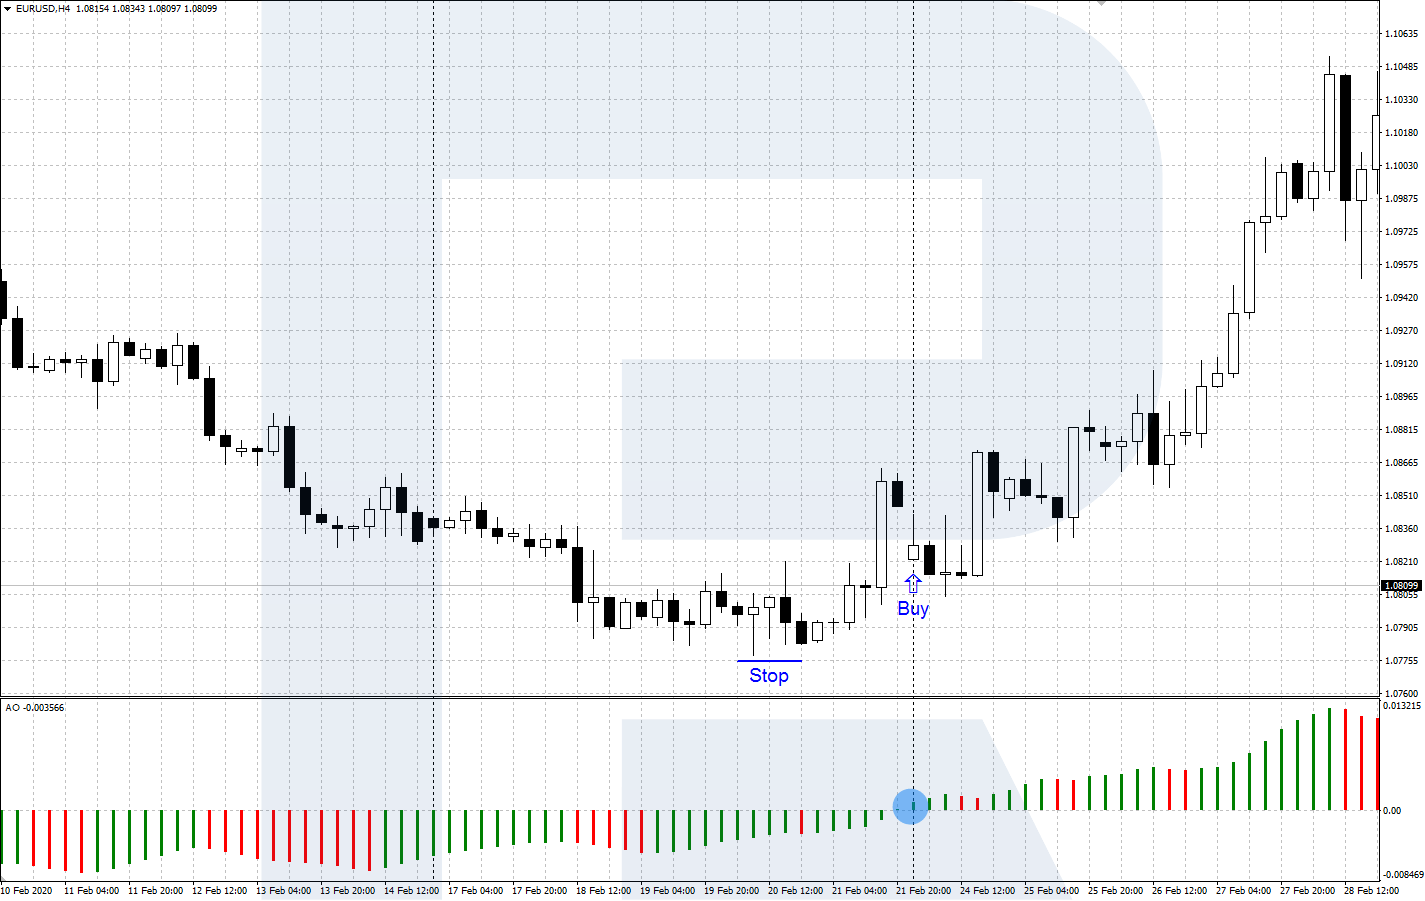
A signal to buy
If the histogram crosses level 0 from below, it signals to buy. There is an ascending movement on the market, the bulls demonstrate their vigor, and we should join them.
After a histogram bar closes above 0, open a buying position with an SL behind the local price low.
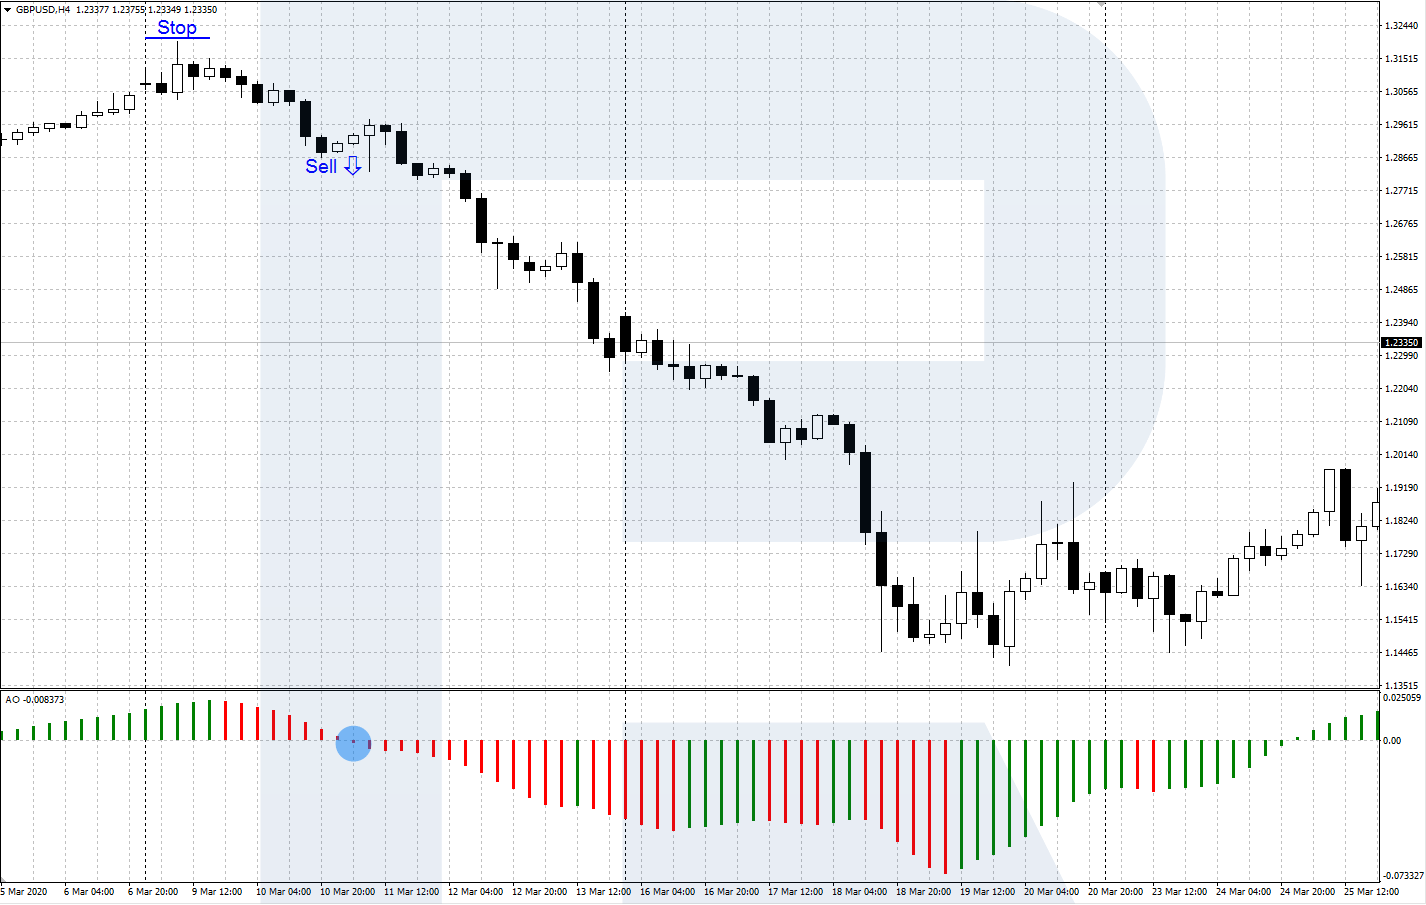
A signal to sell
If the histogram crosses level 0 from above, it signals to sell. There is a descending momentum on the market, the bears dominate, and we should be with them.
After a histogram bar closes below 0, open a selling position with an SL behind the local price high.

The divergence of Awesome Oscillator and the price chart
The divergence of the Awesome Oscillator and price charts signals a probable correction or even a reversal of the current trend.
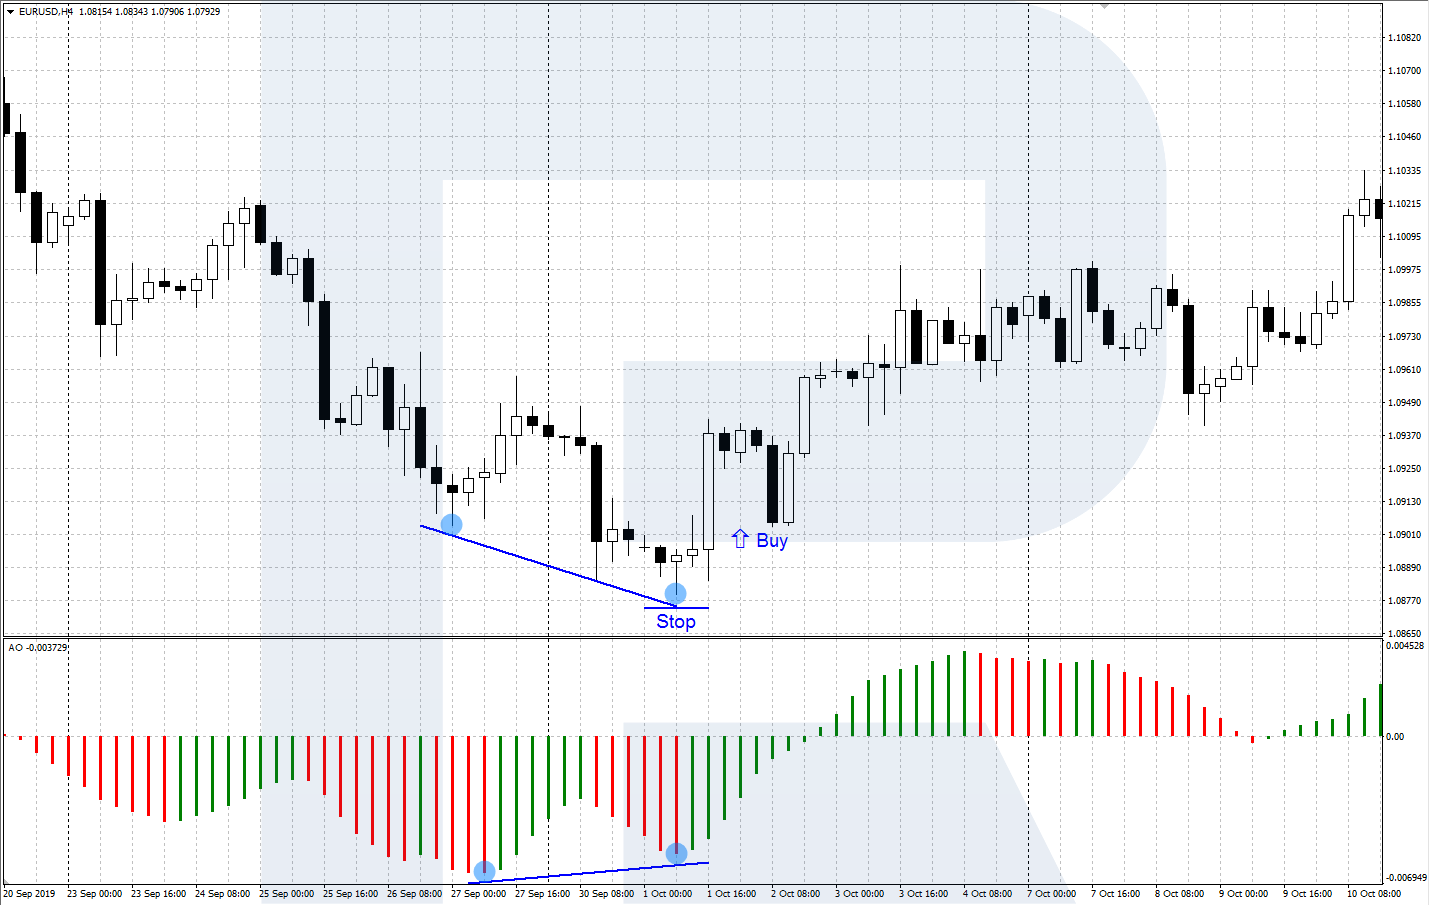
A signal to buy
A divergence signals to buy when the price chart forms a low below the previous one but the low on the Awesome Oscillator chart is above the preceding one. This means the bears are getting weaker, so the bulls may fight back. After the price chart reverses upwards, open a selling position with an SL behind the local low.
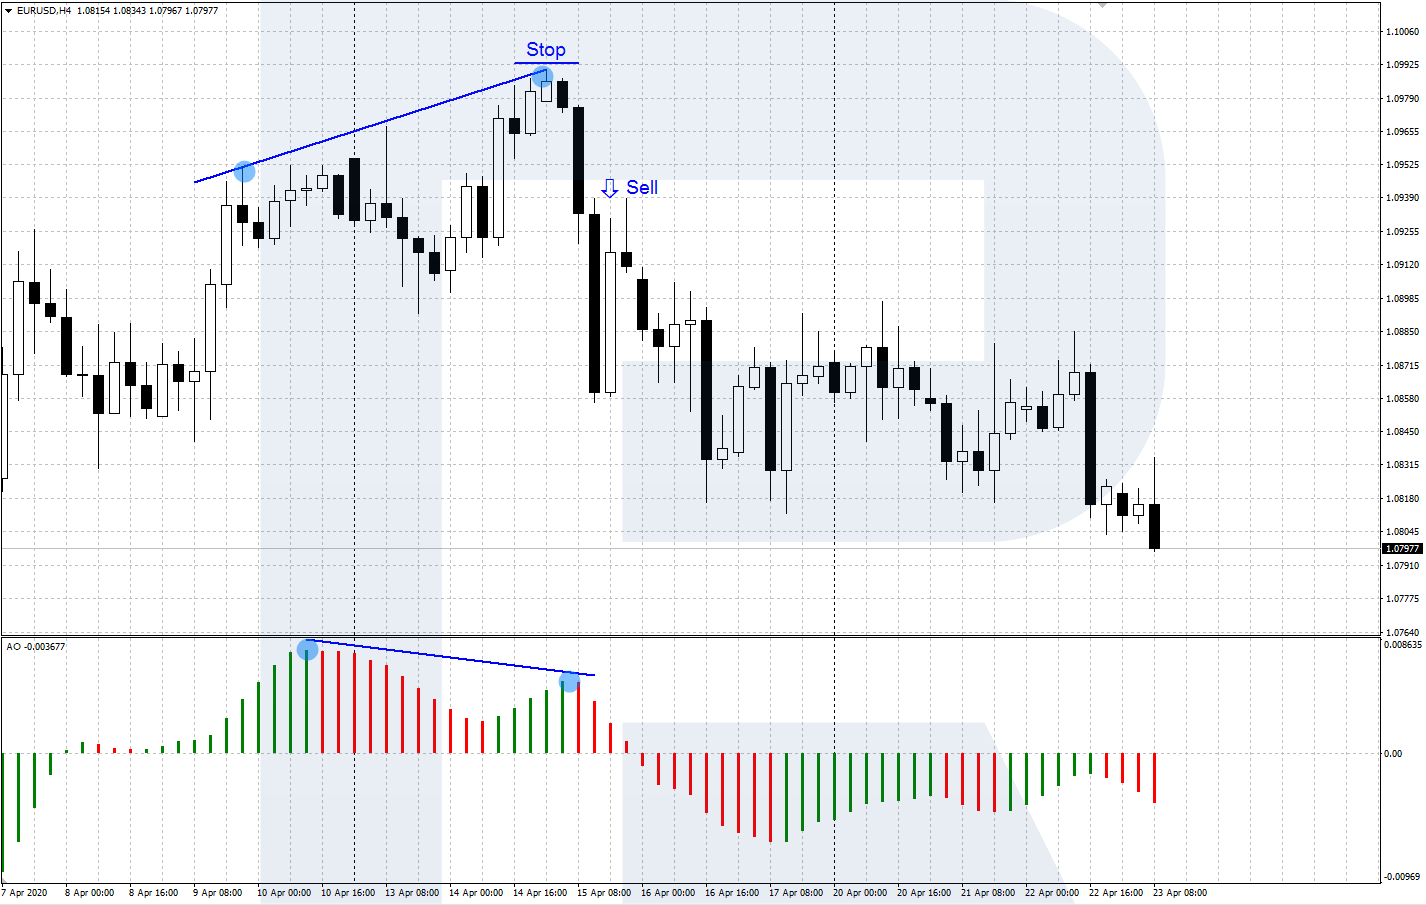
A signal to sell
A divergence signals to sell when the price chart forms a high above the previous one but the high on the Awesome Oscillator chart is below the preceding one. This means the bulls are losing strength, and the bears are trying to reverse the price downwards. When the price does reverse, open a selling position with an SL behind the local high.
Bottom line
Awesome Oscillator appeared and grew popular thanks to a famous exchange expert Bill Williams. It helps to detect the beginning of a movement on the chart, track a correction coming to an end and warns of a possible reversal. I think it may perfectly supplement almost any trading system.


