Momentum: Efficient Oscillator or Trend Indicator?

6 minutes for reading
Momentum is one of the simplest and most popular indicators among traders. As its creator, certain sources name a French mathematician Paul Émile Appell. This indicator helps define the trend direction and the speed of the price change.
Description of Momentum
Momentum is an oscillator type indicator that compares the closing price of the current timeframe with that of the set interval. We may say that Momentum shows the speed (rate) and the direction of the price change.
The popularity of Momentum is mostly explained by its simplicity, its universal character, and the ability to give leading signals from time to time. Momentum not only shows the direction of the price movement but also, evaluating the speed of the quotation change, may show the points of reversion on the chart.
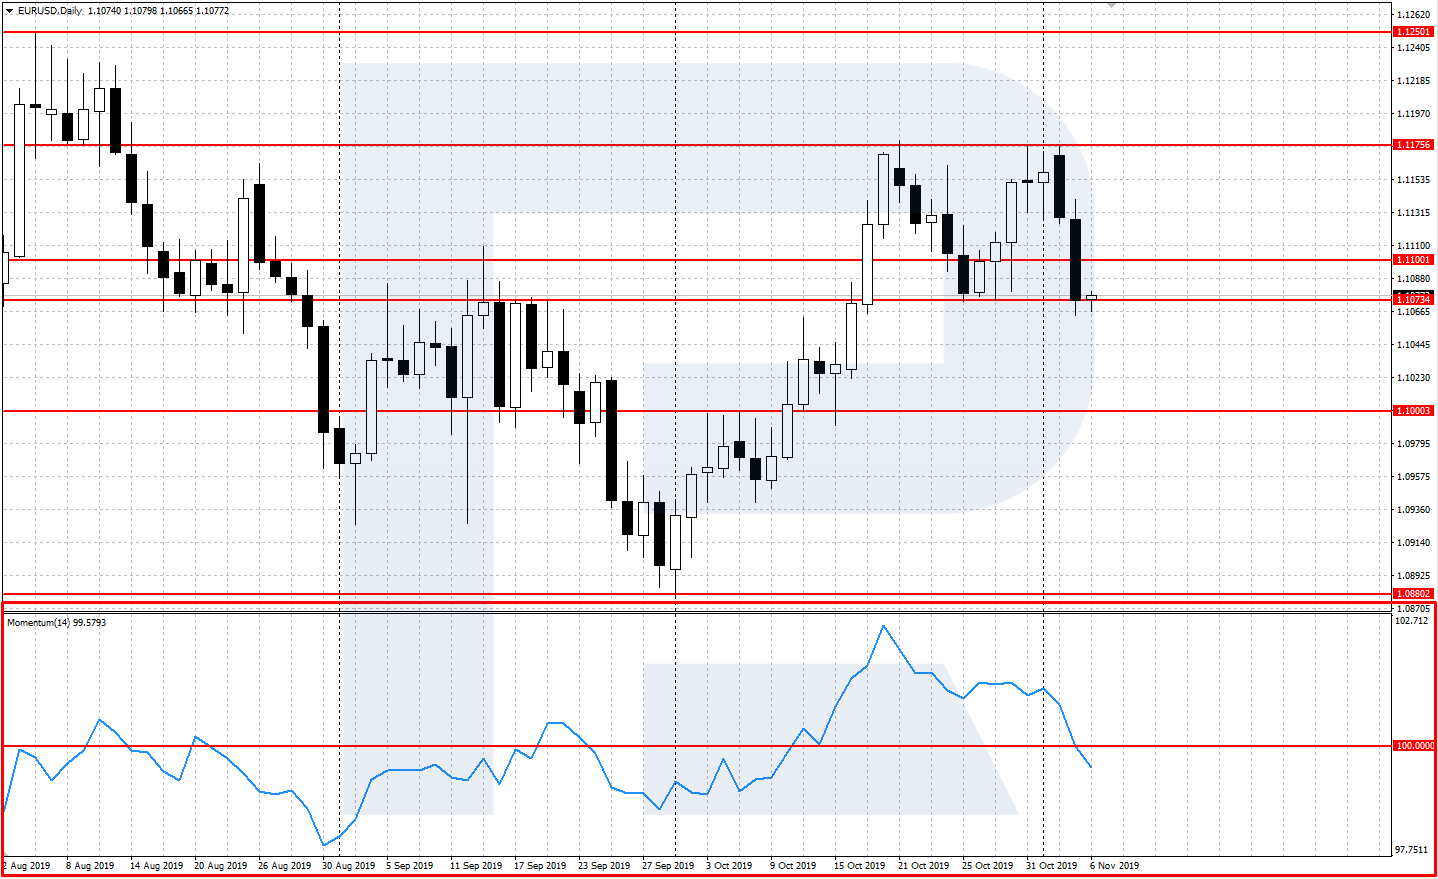
Momentum helps define whether the trend is speeding up or slowing down. When the indicator reaches a new maximum, it means that the optimism of the market crowd is growing, and the prices are likely to go on growing. When Momentum falls to a new minimum, it indicates an increase in the market pessimism and a high probability of further falling of the prices. The indicator is calculated in a separate window under the price chart.
The formula, characteristics, and settings
Momentum consists of one main line that compares the current price position to that of the previous period.
Initially, the formula for Momentum looked as follows:
Momentum = Close(i) - Close(i-n)
Where:
- Close(i) is the last closing price
- Close(i-n) is the closing price n periods ago
- n is the period of Momentum
Later, the formula was slightly changed, and the difference of the prices was replaced by their quotient so that now the formula looks like this:
Momentum = Close / Close(i-n) * 100
For the indicator, we should set up the following parameters:
- Period is the period for the calculation of the main line. The standard value is 14.
- Apply to: choose the required price parameter, normally it is the closing price (Close).
- Style: customize the style, color, and width of the line.
- Fix maximum and minimum: fixes the indicator window in the set borders
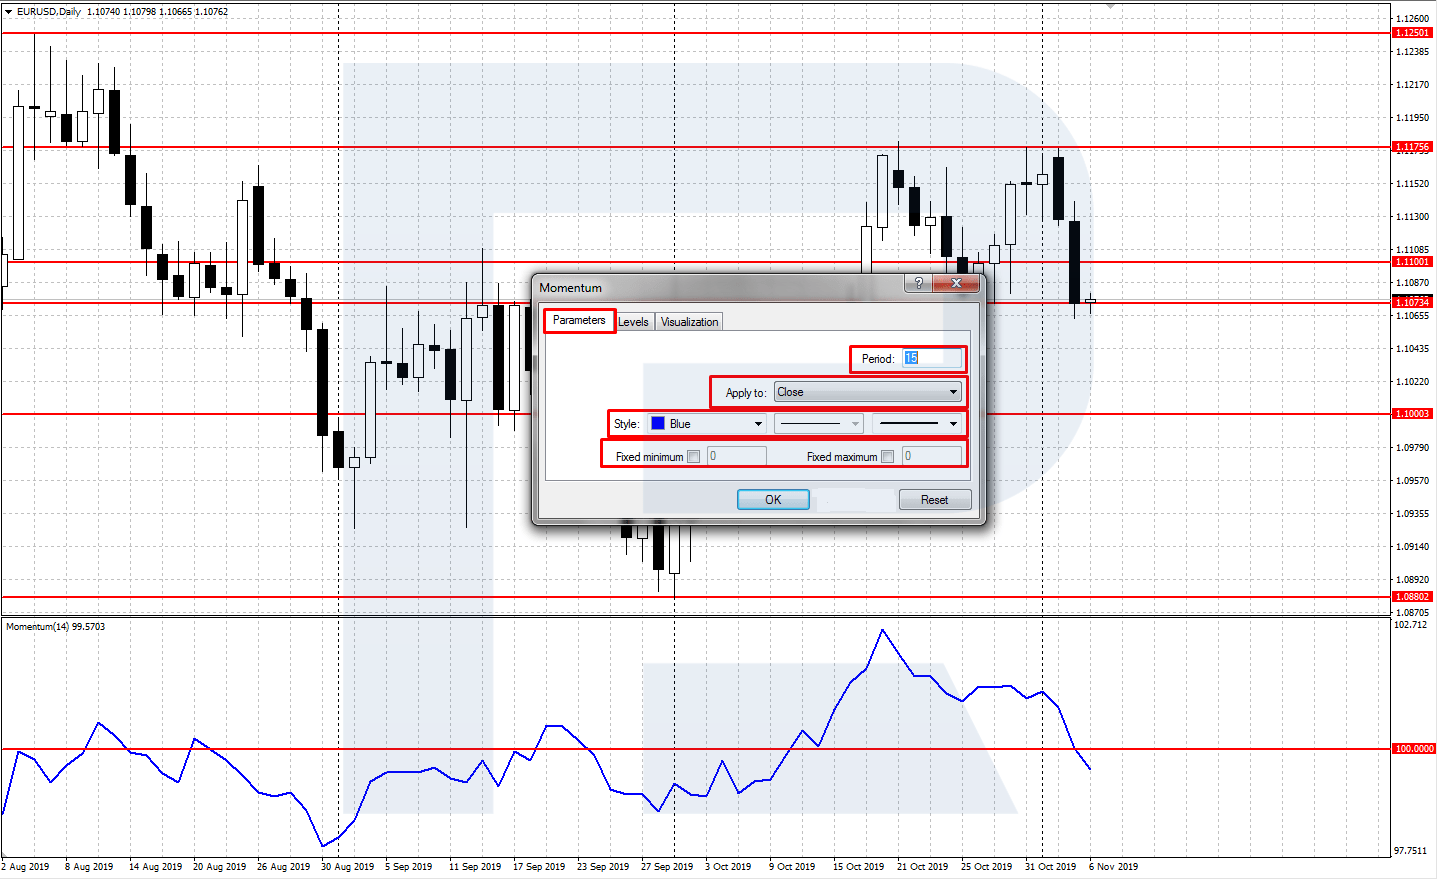
The classic use of Momentum suggests the period set as 14. However, there is always room for experimenting; you can evaluate the work of the indicator on other timeframes historically and choose the one that suits you best.
In the Momentum window, the level of 100 is drawn. This is the central line of the indicator, in relation to which it is moving. When the indicator is above this line, it indicated an uptrend, when it is below 100 - vice versa.
Use of Momentum with other indicators
Momentum belongs to the oscillator group of indicators. It shows fluctuations of the price from the so-called normal values (100, in this case), i.e. signals the overbought or oversold state of the price. Such indicators as Williams %Range, Stochastic Oscillator, RSI (Relative Strength Index), and CCI (Commodity Channel Index) are more or less close to Momentum.
Momentum and Moving Averages
To filter losing trades, we may use trend indicators, such as Moving Averages, together with Momentum. If the MA of the larger timeframe is growing, we only use the Momentum signals to buy on the smaller timeframe. And vice verse, if the MA of the larger timeframe is declining, we only use the MOmentum signals to sell on the smaller timeframe.
Momentum and the Stochastic Oscillator
Momentum can be used together with a classical normalized oscillator, such as the Stochastic Oscillator. Then, we may use the Stochastic signals to buy when Momentum is above 100 and growing and the STochastic signals to sell when Momentum is below 100 and falling. Also, divergences between the maximums/minimums on Momentum and Stochastic may be effective.
Classical trading with Momentum
Let us have a look at the two main trading signals of Momentum.
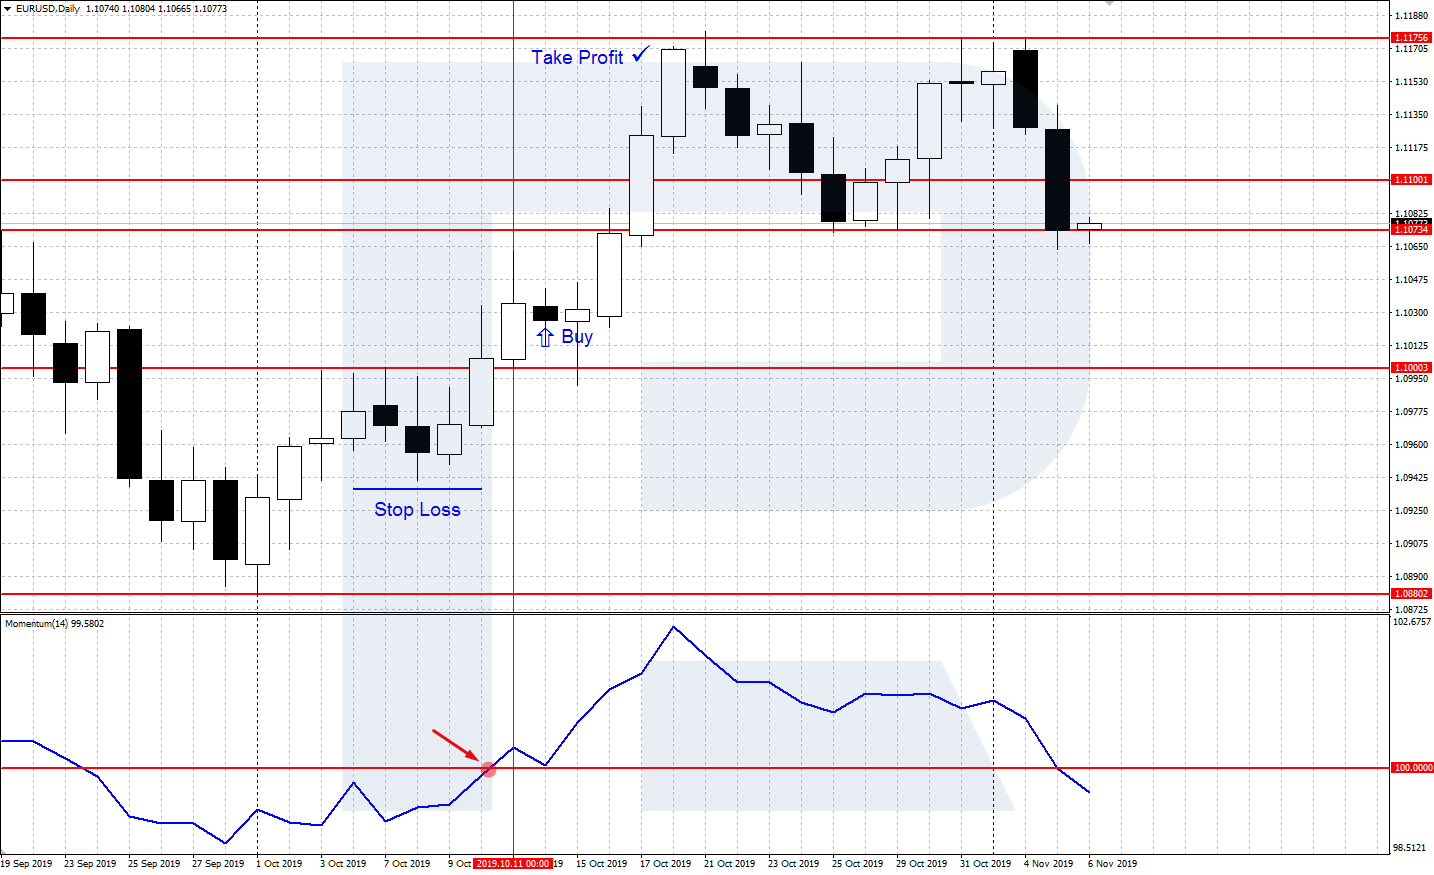
Crossing the central line at 100
The central line of Momentum it is moving about is 100. This is the trend-indicating level: if the indicator is above 100, the trend is ascending; if it is below 100, the trend is descending.
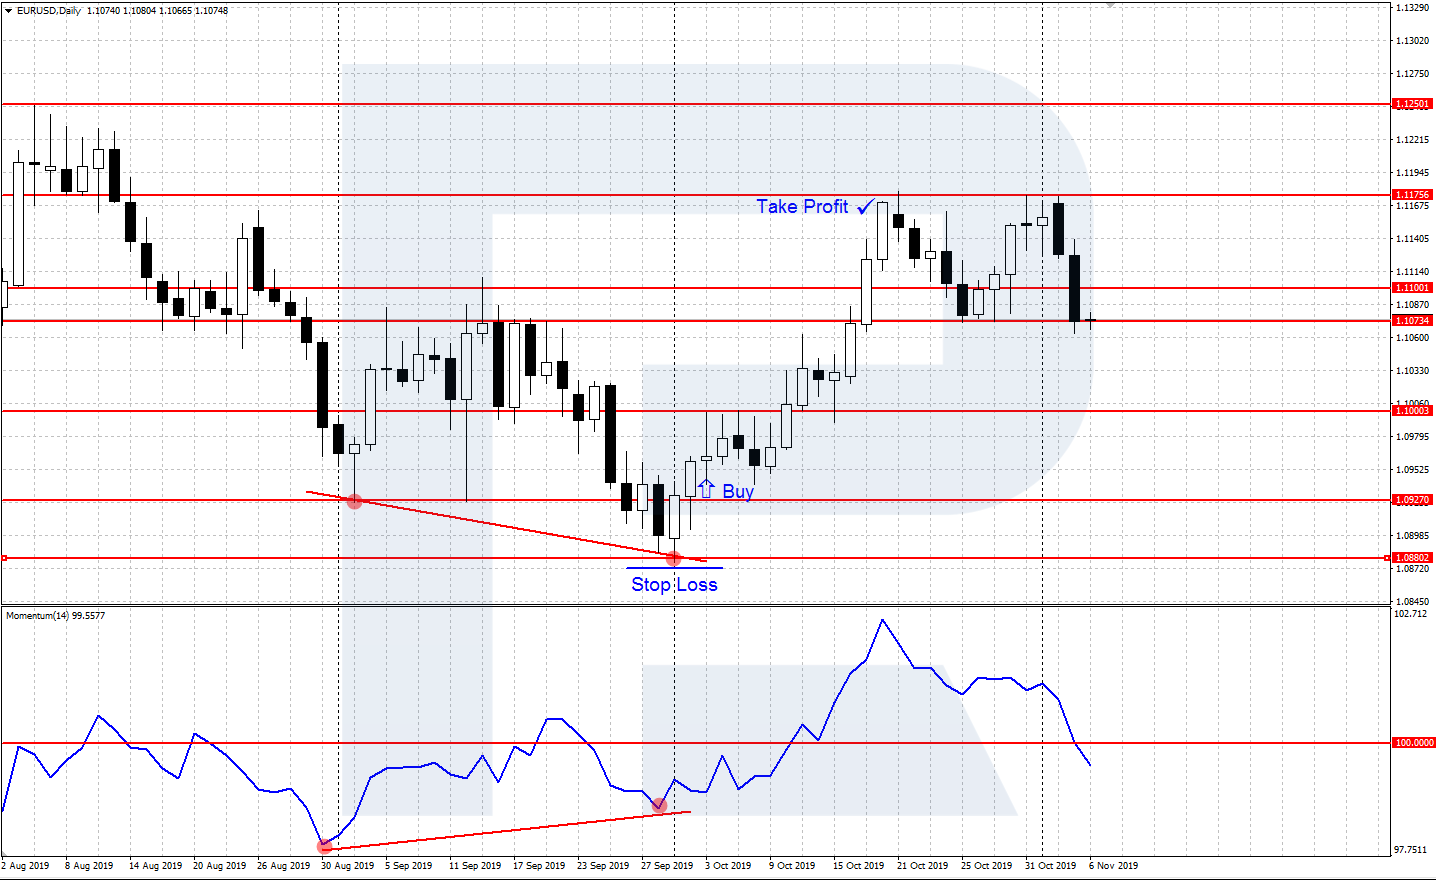
The signal to buy appears when the indicator crosses the central line from below. After the indicator has secured above 100, we may open a buying position (Buy), a Stop Loss is put behind the local minimum. The Take Profit will be triggered when the price approaches the nearest strong resistance level.
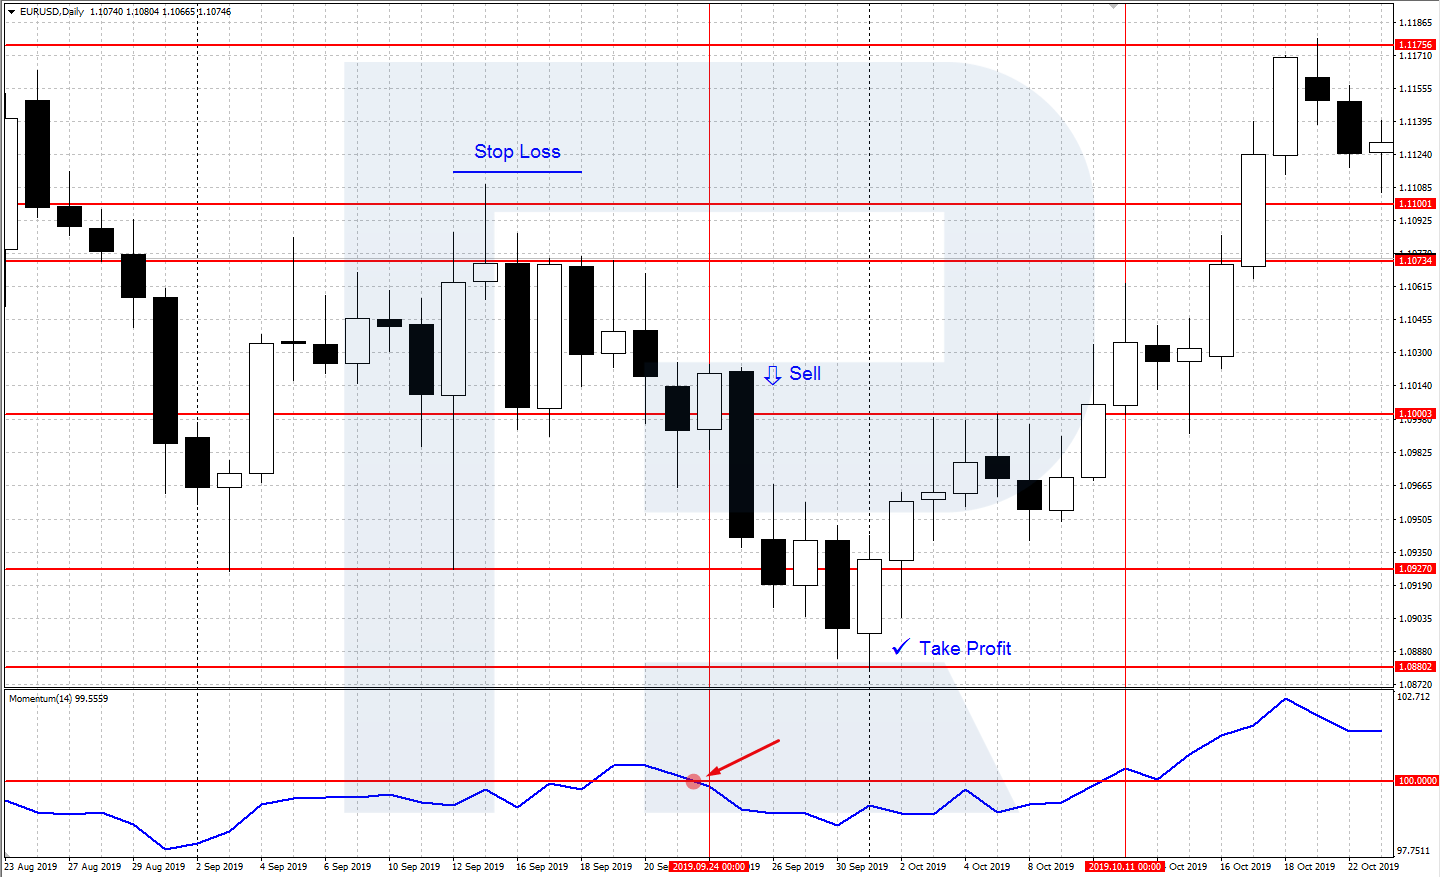
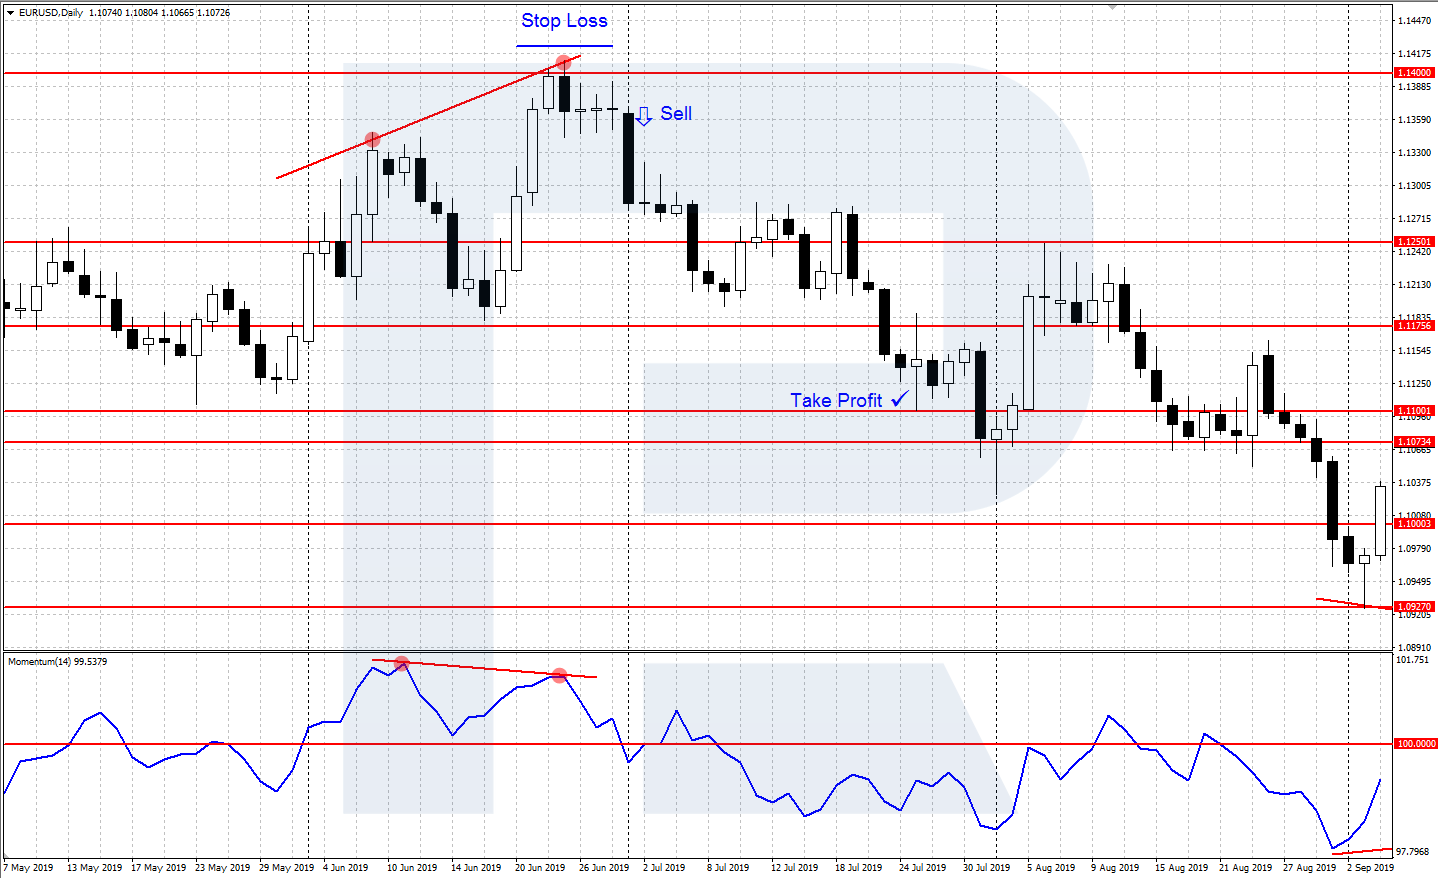
The signal to sell appears when the indicator crosses the central line from above. After the indicator has secured below 100, we may open a selling position (Sell), a Stop Loss is put behind the local maximum. The Take Profit will be triggered when the price approaches the nearest strong support level.
Divergence of Momentum and the price chart
A divergence "to buy", also called "bullish", appears when the price chart shows a new minimum below the previous one while the minimum on Momentum is above the previous one. This means the bears are weakening, and the decline will soon be over. After a bullish divergence is formed and the price has started growing, buys are recommended.
A divergence "to sell", also called "bearish", appears when the price chart shows a new maximum above the previous one while the maximum on Momentum is below the previous one. This means that the bulls have weakened, and a reversal of the growth may happen at any moment. After a bearish divergence is formed and the price has started declining, sells are recommended.
Why is Momentum useful?
Regardless of Momentum formally pertaining to the oscillator group of indicators, it may be called a universal indicator. Apart from the classical oscillator signals of the overbought/oversold situation, Momentum gives indications of the trend direction.
In trading, Momentum can be used along with other indicators for increased reliability. Regardless of whether you couple Momentum with other indicators or the classical tech analysis, the most important part is to create a clear trading strategy and receive positive statistics of its work, after which you may go ahead and trade.