How to Use Stochastic Oscillator? Description and Trading with the Indicator

6 minutes for reading
Description of the Stochastic Oscillator
The Stochastic Oscillator appeared and became popular thanks to a famous trader George Lane. He noticed that prices, moving from one level to another, sometimes create overbought and oversold areas; Lane automatized the process of finding these areas with the help of an indicator. The Stochastic is an oscillator demonstrating the position of the current price in % in relation to the previous price range.
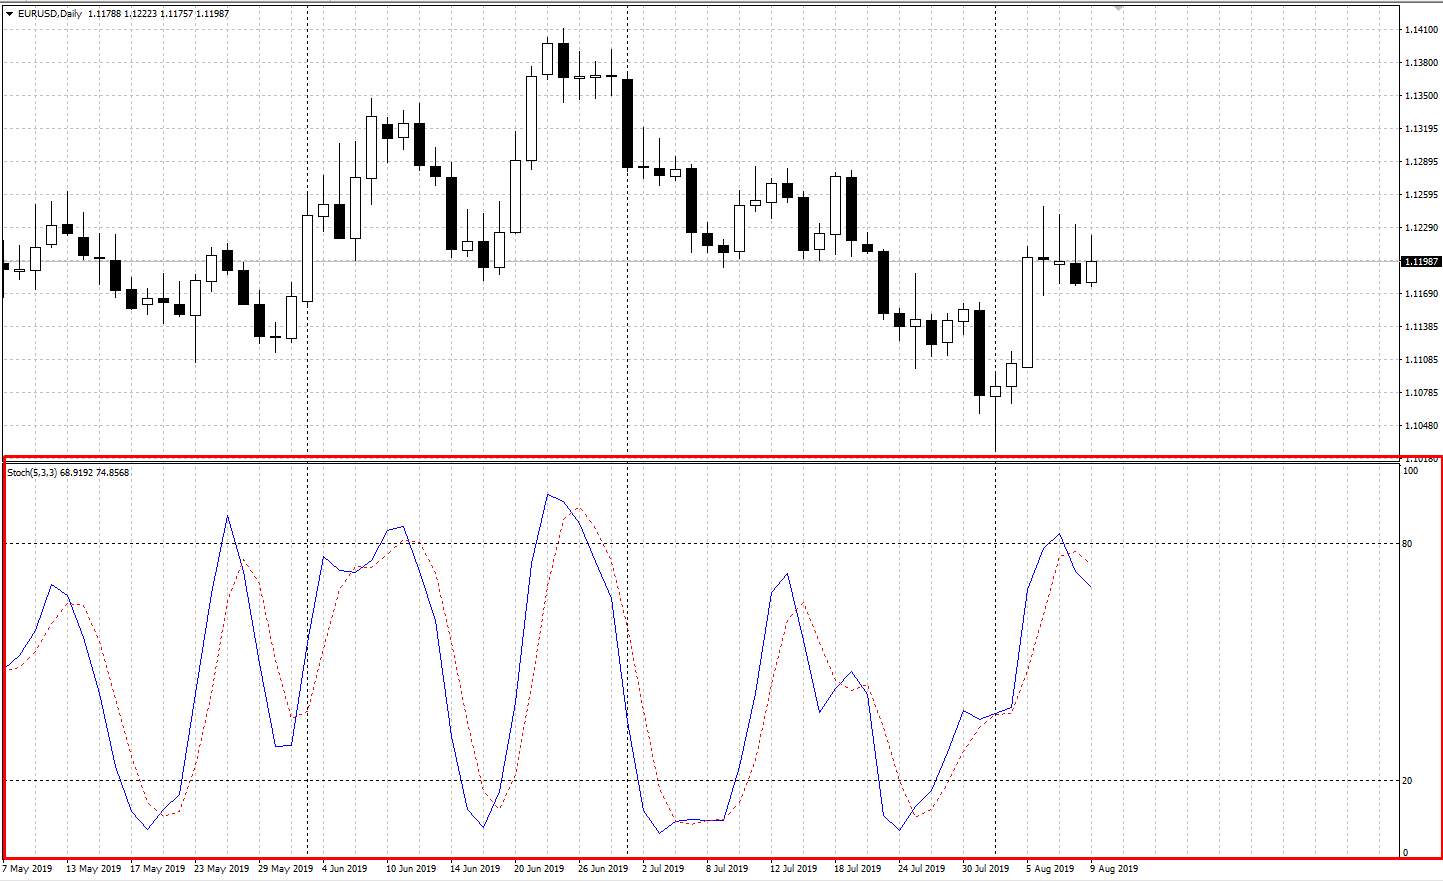
The Stochastic Oscillator chart is drawn in a separate window under the price chart and consists of two lines: %K, the quick one, and %D, the slow one. The values vary from 0% to 100%; at the levels of 20% and 80% signal lines, defining the oversold (0-20%) and overbought (80-100%) areas, are drawn.
The Stochastic shows the capability of bulls and bears to set the closing price at the edge of the recent interval. If bulls manage to raise the prices during the day but fail to secure the closing price near the maximum, the Stochastic Oscillator starts falling, demonstrating the weakening of the bulls. If the closing price after the new minimums rises to the upper border of the range, it means that the bears have managed to pull the prices down but failed to secure them there. The growth of the Stochastic shows that the bears are not as strong as they seem.
Stochastic Oscillator calculation formula, characteristics and settings
The indicator is drawn in a separate window and consists of two lines:
- %К is the quick main line (solid line)
- %D is the slow supplementary line; it is a moving average of %K with a small averaging period (dotted line)
The formula for calculation of the main line:
%К = (С – Ln) / (Hn – Ln) * 100
Where
- С is the closing price of the current period
- Ln is the lowest price during the last n periods
- Hn is the highest price for the last n periods
- %D is the averaging of the %K line with the period specified in the settings.
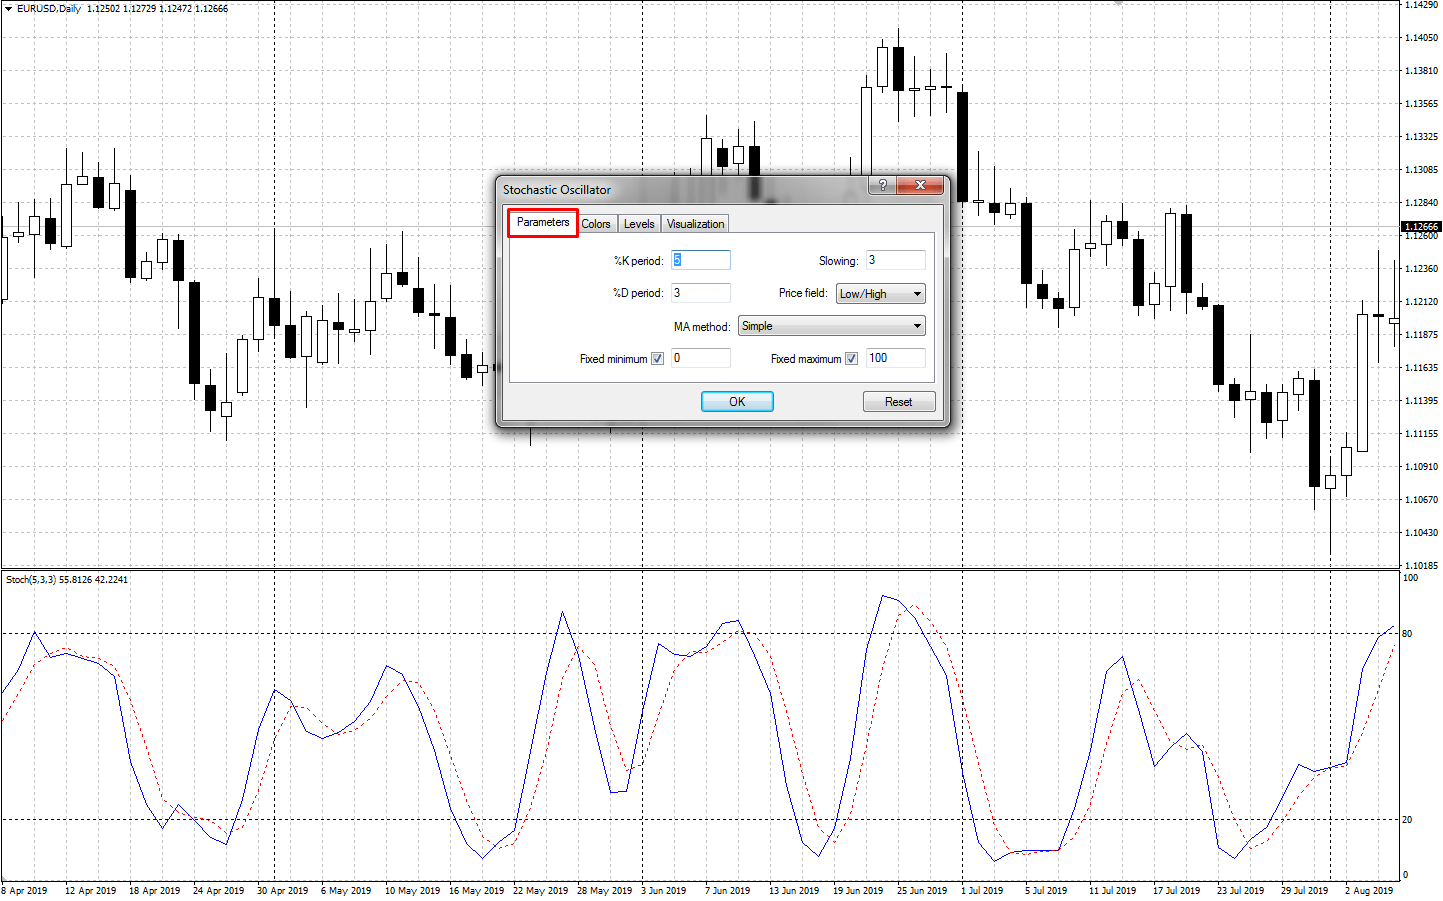
When setting up the Stochastic Oscillator, the following parameters are to be specified:
- %К period is the calculation period for the main line of the indicator. The default setting is 5.
- %D period is the averaging period for drawing the secondary line. The default setting is 3.
- Slow-down — this parameter defines the inner smoothing of the %K line and lets the indicator react on steep price changes. The default setting is 3.
- Prices — the type of price used. Low/High — maximums and minimums are used. Close/Close — closing prices are taken into account. Default settings are Low/High.
- MA Method defines the type of the Moving Average for %D calculation. The default setting is Simple.
Also, by default, there are levels of overselling and overbuying, recommended by the author, set at 20 and 80%, respectively.
The Stochastic Oscillator is frequently used with the default settings. At the same time, the user can always customize them, assess the work of the indicator historically with different settings and pick up those that suit their trading best.
Connection of the Stochastic Oscillator to other indicators
The name "Stochastic Oscillator" suggests that the indicator should belong to the oscillator group. As a rule, oscillators fluctuate in a certain range, showing deviations of the price from the so-called normal values, i.e. signaling about its overbought or oversold state. The indicators, giving results similar to those of the Stochastic Oscillator, are the RSI (Relative Strength Index) or Williams Percent Range.
The advantages of oscillators are good trading signals in a flat when the trend is not obvious. The disadvantages would be signals against the current trend when the trend on the market is strong. That is why it is recommended to supplement the Stochastic Oscillator with some trend indicator in order to cut off losing trades against the trend. Such an indicator might be the MA (Moving Average). In this case, the MA (or two MAs) may act as a filter: only those signals of the Stochastic Oscillator will be used for trades that coincide in the direction with the MA(s). If the MA is growing, only signals for buying are used; if it is declining, only signals to sell are taken into account.
Trading with Stochastic Oscillator
Let us have a look at the three main trading signals of the Stochastic Oscillator:
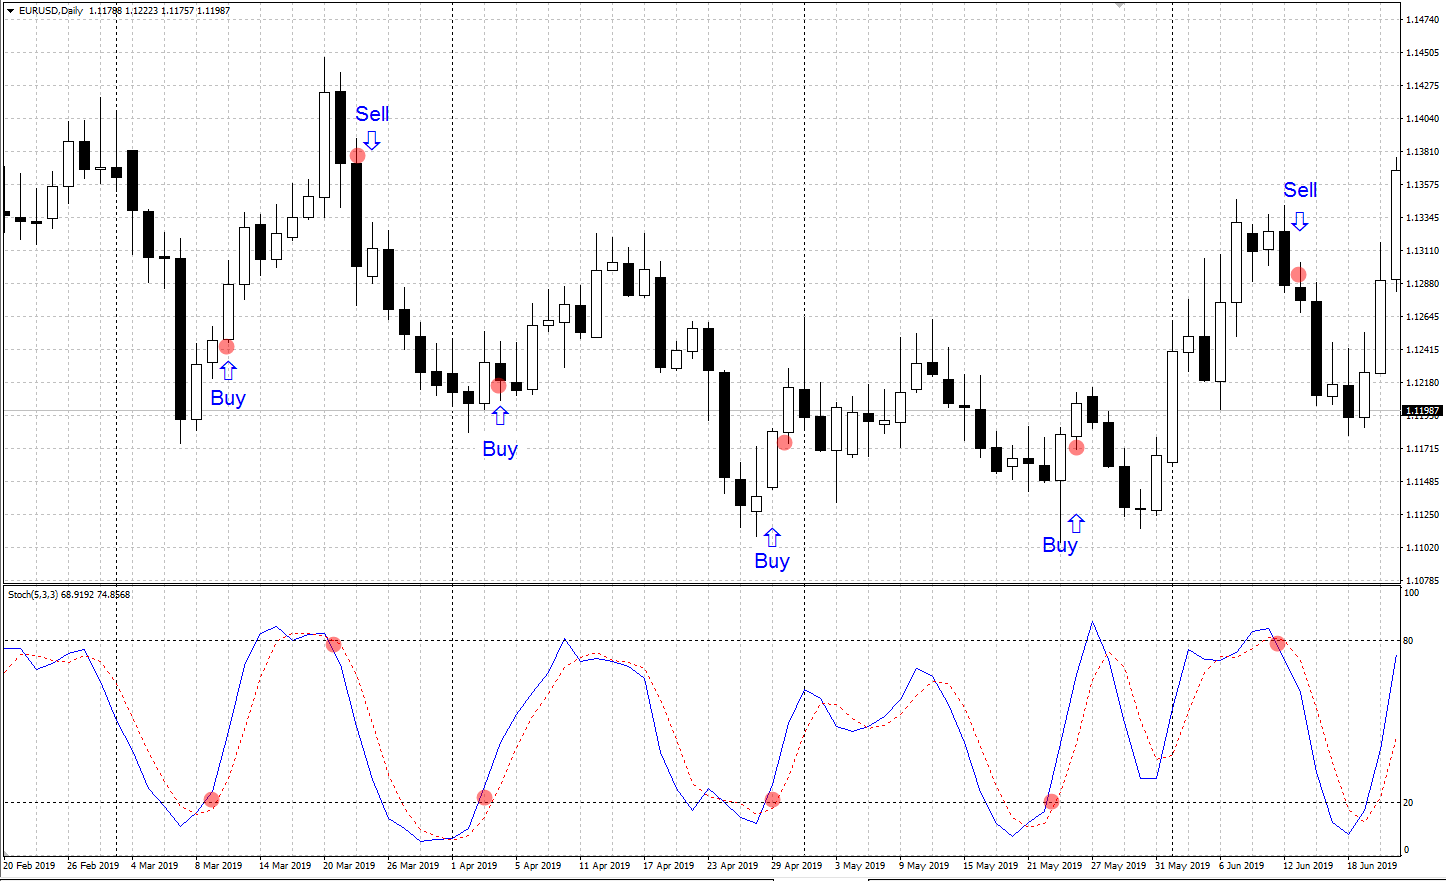
Crossing of the %K and %D
If the main quick %K line crosses the slow %D line upwards, this signals to buy, if vice versa, top-down — to sell.
If the crossing occurs in the overbought or oversold areas, this is considered a strong trading signal; if it happens outside these areas, this is considered a weak signal.
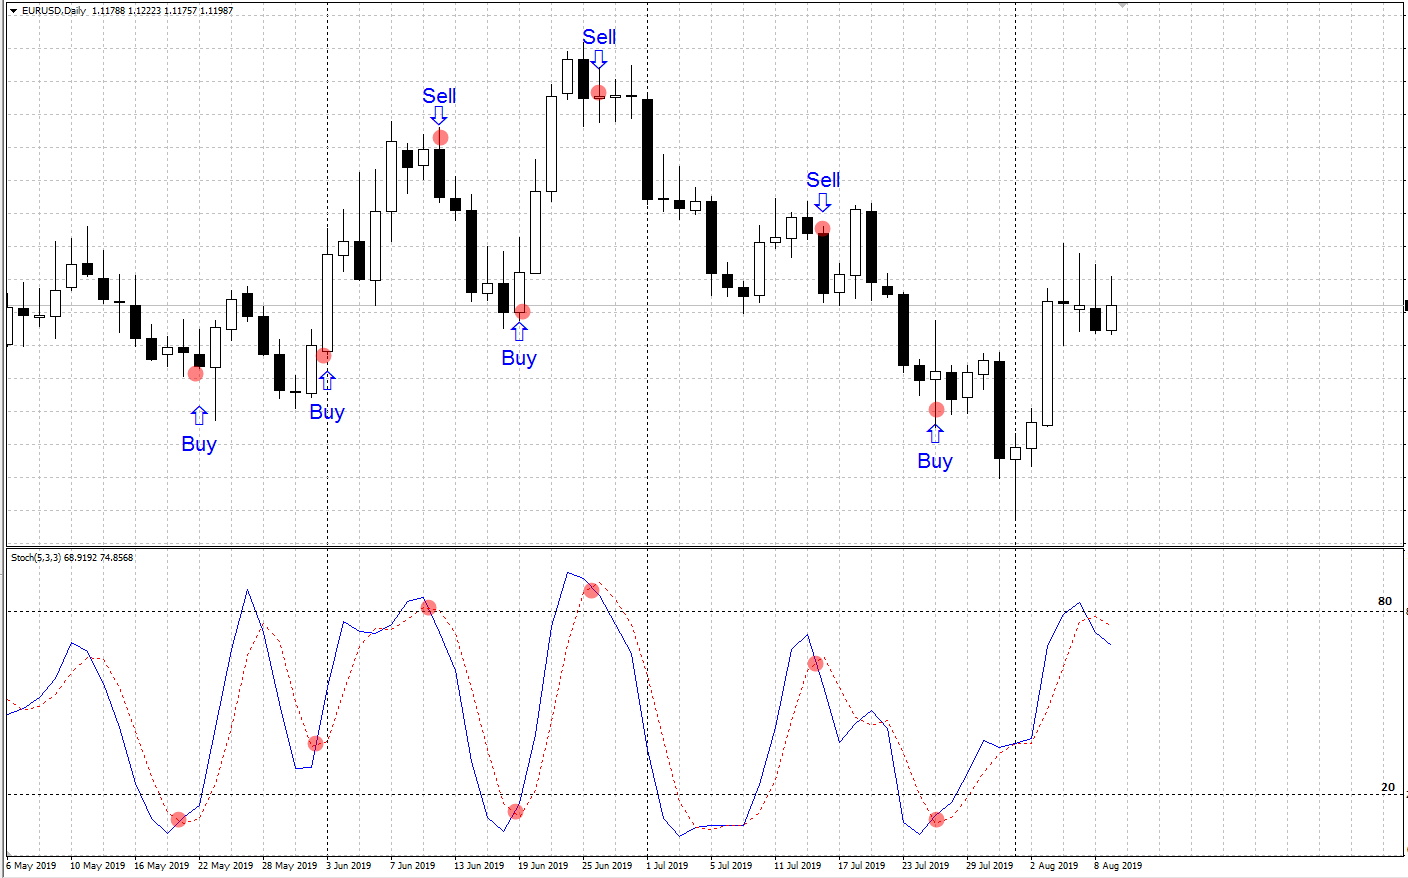
Exit from the overbought and oversold areas
Exiting the overbought and oversold areas by %K and %D is considered a reliable trading signal. If the %K and %D lines exit the oversold area and rise higher than 20%, buying is recommended. If the lines exit the overbought area and fall below 80%, selling is recommended.
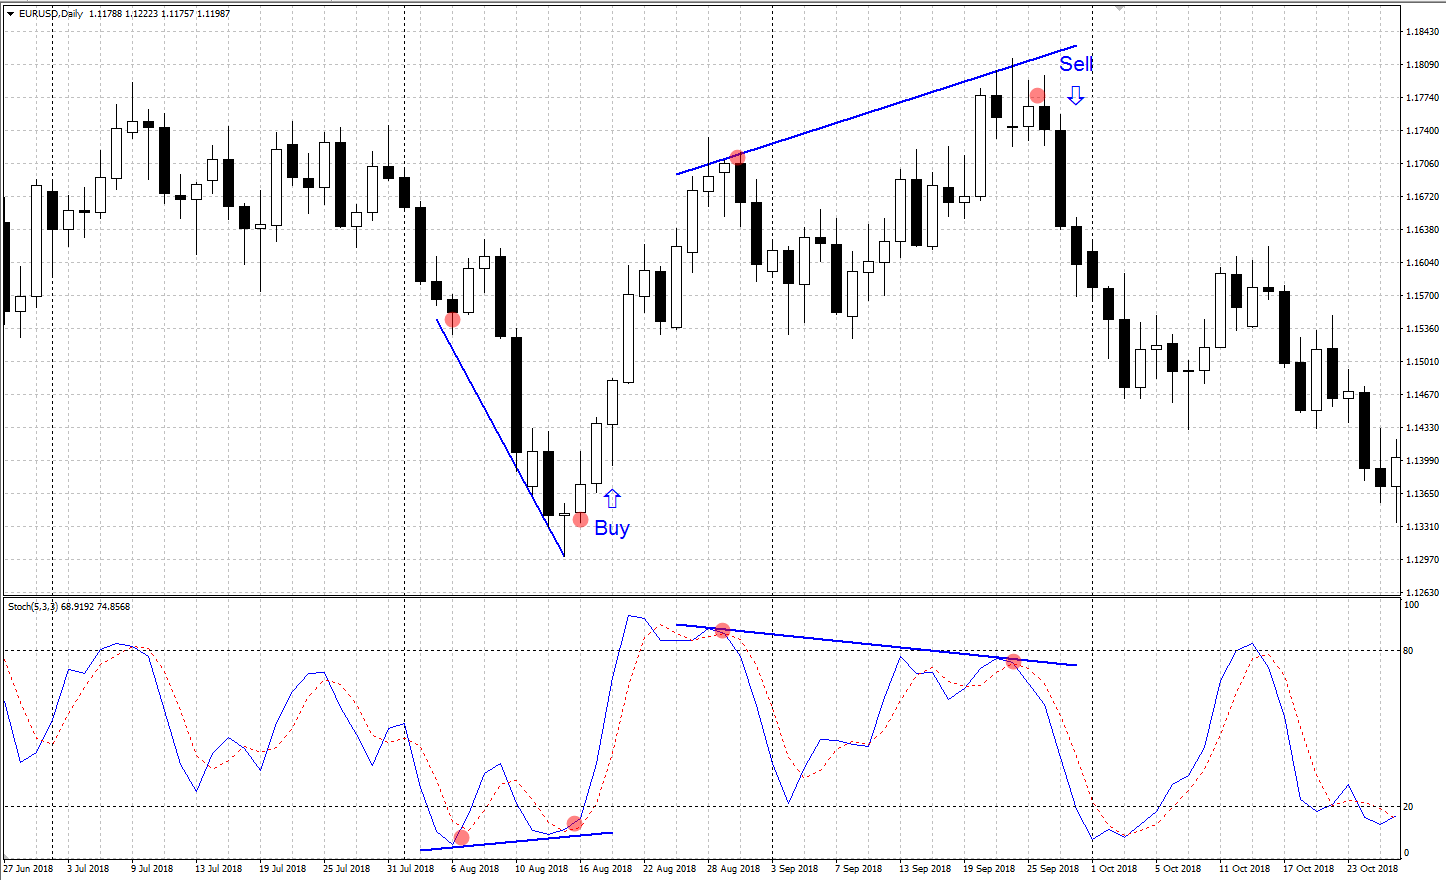
Divergence of the Stochastic Oscillator and the price chart
A divergence (from the Latin divergere — find a difference) occurs in case the Stochastic Oscillator differs from the price chart.
Bull divergence (a signal to buy) emerges when the price chart features a new minimum, while the Stochastic Oscillator demonstrates a shallower minimum than the previous one. This means that the bears are weakening, moving just by inertia. After forming a second minimum and the beginning of the Stochastics lines going up, buying is recommended. The signal is considered stronger if the first minimum of the Stochastic Oscillator was below the level of 20% and the second one above it.
Bear divergence (a signal to sell) appears when the price chart shows a new maximum, while the Stochastic Oscillator features a maximum lower than the previous one. This means that the bulls are weakening, moving just by inertia. After forming another maximum and the beginning of the Stochastic Oscillator descending, selling is recommended. The signal is considered stronger if the first Stochastic Oscillator maximum was above the level of 80% and the second one below it.
Summary
It is worth noting that, regardless of the old age (it was created in the 1950s), the Stochastic Oscillator remains rather popular among traders. However, it should be realized that it is by no means universal. In my opinion, it can be used in addition to technical analysis or a trend indicator. Then the Stochastic Oscillator will help find good entry or exit points, probably taking a due place in your trading system.