DXY Forecast: Analysing the Trends of 2024 and Future Prospects
12 minutes for reading
The US Dollar Index (DXY) reflects the dynamics of changes in the value of the US currency in the global financial markets. In this article, we will learn how the index is calculated, explore its historical trends, examine the factors influencing its movements, and present possible strategies for analysis and investment.
You can visit the RoboForex Market Analysis webpage for the latest Indices forecasts.
What is DXY?
DXY or USDX tickers denote the index of the US dollar, which is the official currency of the US and serves as the global reserve currency in international trade and financial markets.
It is a composite measure of the value of the USD relative to a basket of six major currencies of significant US trading partners, namely the Euro (EUR), Japanese Yen (JPY), British Pound (GBP), Canadian Dollar (CAD), Swedish Krona (SEK), and Swiss Franc (CHF). The DXY has a base value of 100.00.


How the DXY index is calculated
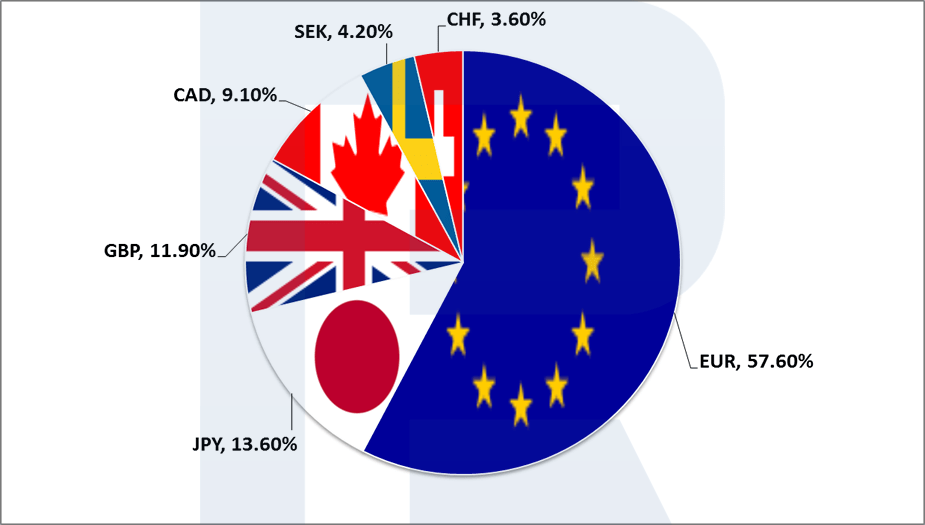
The value of the US Dollar Index is determined by calculating a weighted geometric mean of the USD exchange rate against the basket of foreign currencies, with each having a different weight:
- EUR – 57.6%
- JPY – 13.6%
- GBP – 11.9%
- CAD – 9.1%
- SEK – 4.2%
- CHF – 3.6%
The DXY index increases when the USD exchange rate rises compared to other currencies, and it decreases when the US currency exchange rate drops.
DXY historical perspective and data
Understanding the trajectory and nuances of the DXY requires a deep dive into its past. By analysing the historical context of the Dollar Index, we can gain insights into its current positioning and potential future direction.
Origin and evolution of the DXY
The US Dollar Index, popularly known as the DXY, is a measure that represents the value of the US dollar compared to a basket of six significant global currencies. Established in 1973, the DXY has since become a benchmark for gauging the international value of the US dollar.
The start of the DXY coincided with the breakdown of the Bretton Woods system, a framework that had been in place since the end of World War II and pegged major global currencies to the USD (with the US dollar itself pegged to gold). With the collapse of this system, there was an imminent need for a metric that could efficiently gauge the strength or weakness of the dollar against other major currencies, which led to the creation of the DXY.
The index started with a base of 100, meaning that if the DXY reads 120 today, the USD's value has appreciated by 20% since its initiation in 1973. Conversely, a reading of 80 would indicate a 20% depreciation.
Throughout its existence, the DXY has undergone periodic reviews and changes in terms of the weightage of the constituent currencies, though the core set of currencies has remained largely consistent.
Significant historical shifts and their causes
The trajectory of the DXY over the years is a testament to the various economic, political, and financial events that have shaped the global economic landscape. Some of the most notable shifts in the DXY value have been:
- Mid-1980s appreciation: the Plaza Accord in 1985 was a major agreement among the G5 nations (France, Germany, Japan, the UK, and the US) to depreciate the US dollar against the Japanese Yen and the German Deutsche Mark. The rationale behind this agreement was the large trade deficit of the US. This intervention led to a significant dip in the DXY
- Late 1990s surge: this era saw the US economy thriving, with rapid technological advancements and growth in the tech sector leading to the dot-com boom. The robust economic performance and capital inflows made the DXY touch new highs
- 2008 financial crisis: the global financial meltdown triggered by the housing bubble burst in the US had significant ramifications for the DXY. Initially, there was a flight to safety, causing the dollar to appreciate. However, as the severity of the crisis became evident, and central banks worldwide started slashing interest rates, the DXY experienced substantial volatility
- Post-2015 depreciation: in the aftermath of the 2008 crisis, the Federal Reserve embarked on a series of quantitative easing programmes. It was only around 2015 that the Fed began to normalise its policies, leading to a relative weakening of the US dollar in anticipation
- 2022 surge: since the beginning of 2022, the Federal Reserve has initiated a monetary tightening policy amid the end of the Covid-19 pandemic. Additionally, the Russian invasion of Ukraine and the energy crisis played a role in the strengthening of the USD

Factors influencing the DXY
Economic indicators
- The Federal Reserve’s monetary policy; specifically changes in interest rates, quantitative easing (QE), and quantitative tightening (QT) programmes
- Unemployment Rate
- Nonfarm Payrolls
- GDP Growth Rates (GDP)
- Inflation Indices (CPI, PPI)
- Industrial Production index
- Trade Balance
Political scenarios
- Presidential and congressional elections
- Speeches and comments from political leaders
- Speeches and comments from Federal Reserve officials
- Debates and decisions on the national debt ceiling
- Political scandals
Global crises and their impact
The US dollar, as the global reserve currency, tends to strengthen during crisis developments and stock market declines. Therefore, the DXY index also strengthens when interest rates rise, as international investors perceive the USD as a safe-haven asset for preserving and increasing their capital during challenging times.
Methodologies for DXY forecasting
The US Dollar Index can be used both for short-term DXY trading and long-term investing. It is impossible to buy or sell the index directly since this is just a calculated value, but it can serve as guidance when trading various financial instruments. Fundamental analysis, technical analysis, or indicator analysis can be used to make a trading decision.
Fundamental analysis
When making trading decisions, this approach addresses fundamentals such as the Fed’s policy, economic statistics, and the current situation in global financial markets. This may be both short-term trading on important news and long-term investing based on changes in the US regulator’s monetary policy.
Example:
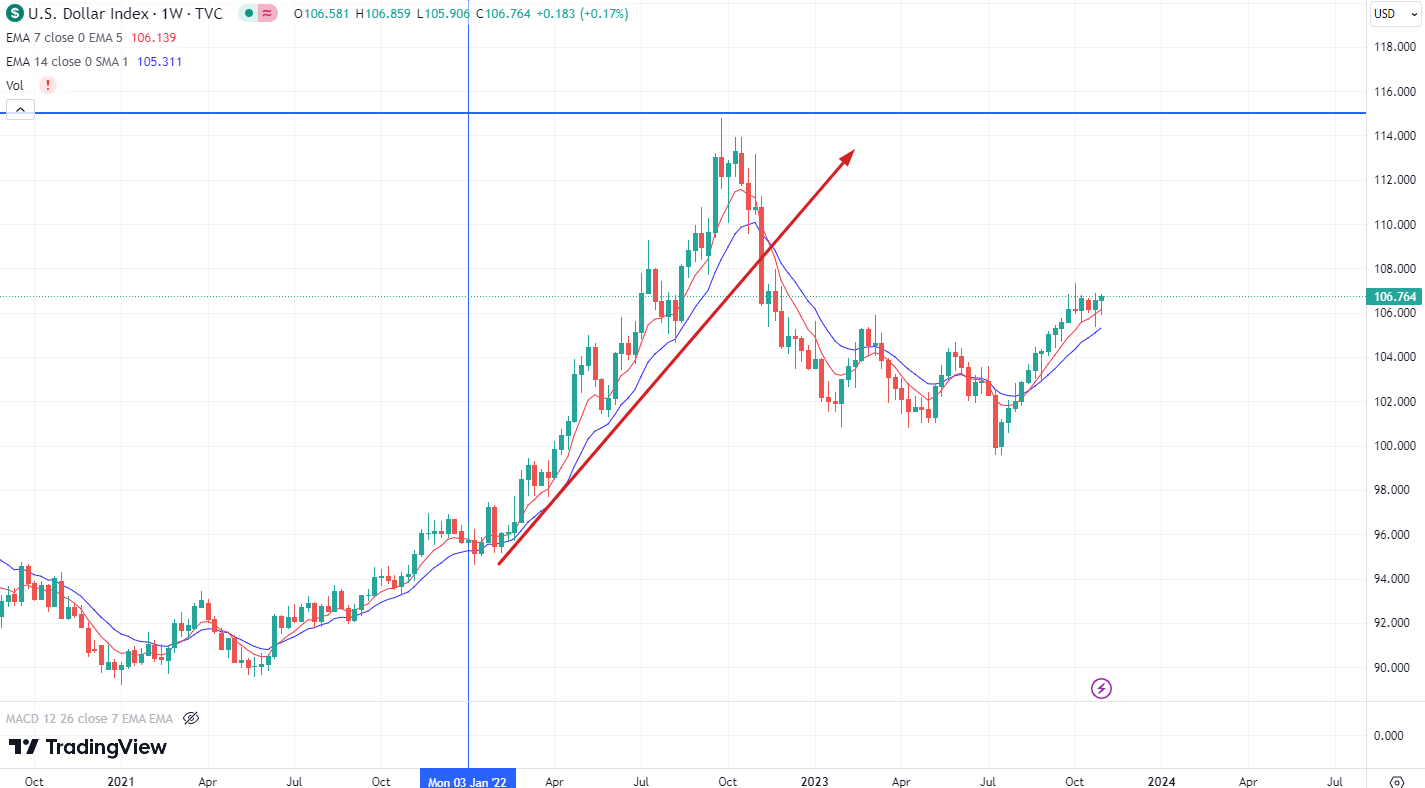
- The US Federal Reserve has been tightening its monetary policy since 2022 to combat rising inflation. With interest rate hikes being a positive factor for the US dollar, the DXY showed significant growth in 2022, climbing from about 95.00 to 115.00
Technical analysis
Technical analysis involves assessing historical market data, primarily prices and transaction volumes, to forecast future price movements. This method implies that the price reflects the full current market information, which is why it focuses mainly on a price movement, not on the reasons behind any changes.
Deals are based on the DXY chart analysis. For this purpose, classical technical analysis is used along with various proprietary techniques such as the Elliott wave theory and strategies of Linda Raschke, Bill Williams, and other famous traders. Price patterns, candlestick combinations, and Price Action patterns may also be used for trading.
Example:
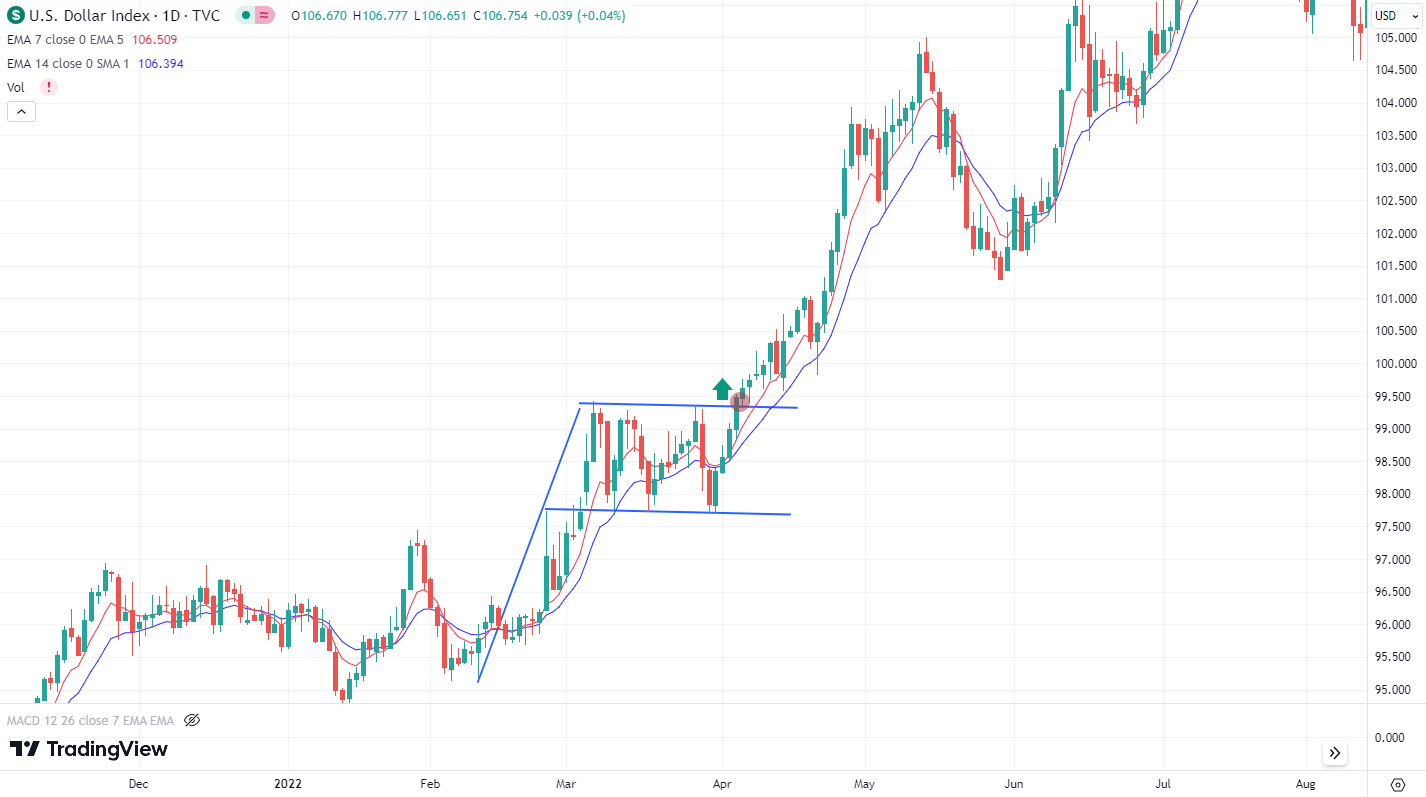
- In March-April 2022, during an active rise in the index, a Flag continuation price pattern formed on the daily chart
- When the price closed above the upper pattern line, this was a signal to buy, which was confirmed by further price growth
Indicator analysis
A variety of trading indicators can be used to analyse and search for trading solutions involving the DXY. The common practice is to take one compound integrated indicator or several simple indicators. They can even help automate trading, creating special algorithms – trading advisors.
Example:
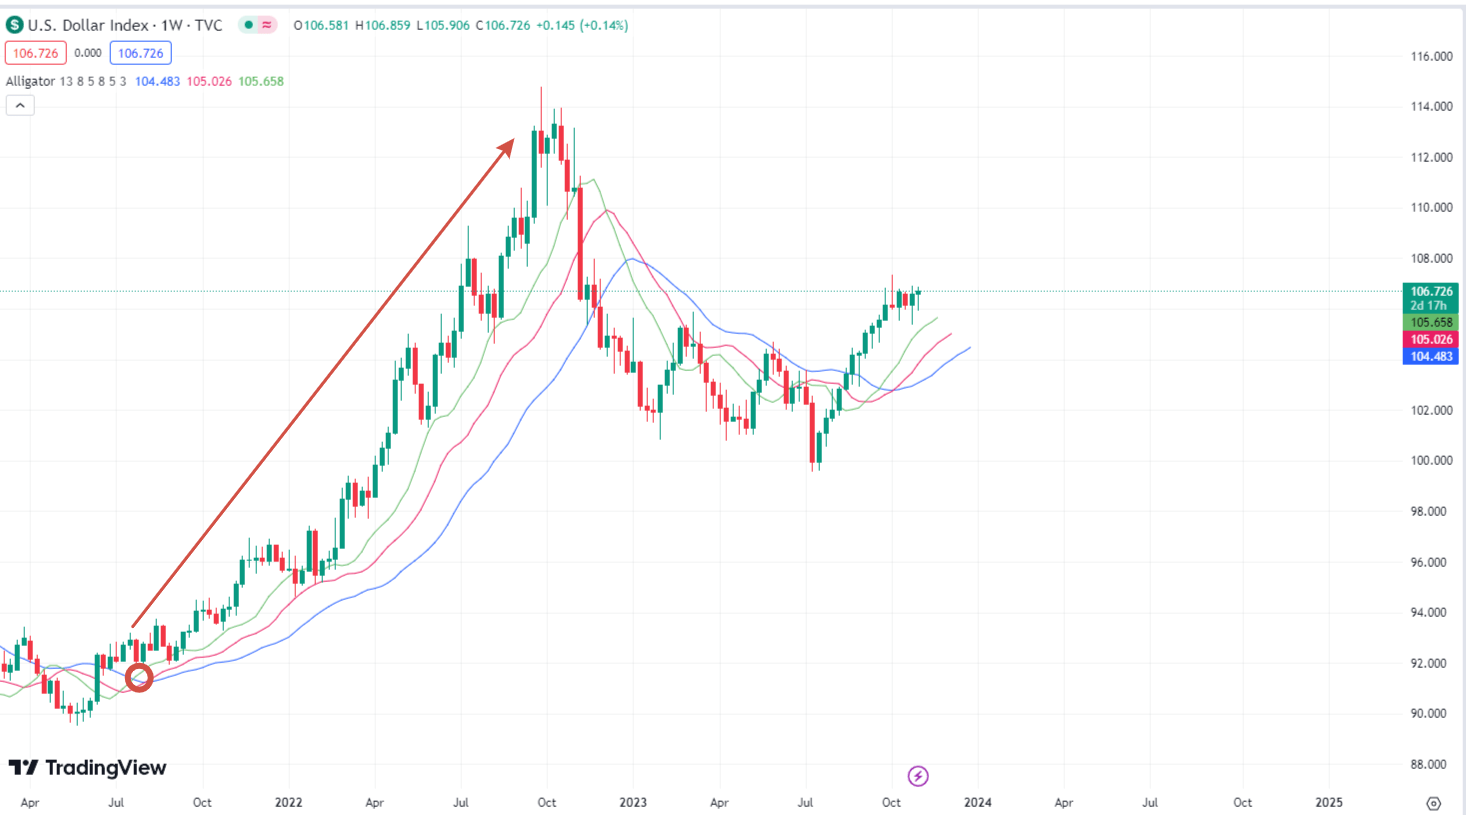
- We use a popular Alligator trend indicator
- Amid a recovering economy, in 2021 the W1 chart formed a signal to buy an asset by the index: the indicator lines crossed each other and reversed upwards
- In the future, the index quotes continued to rise
DXY index performance: the strength of the USD reflects the Federal Reserve’s rate hike cycle
The US Federal Reserve has been taking active measures in recent times to combat inflation by tightening monetary policies. Since 2022, the interest rate has gradually risen from 0.25% to 5.5%, the highest value for 22 years. The interest rate hike cycle had a significant impact on the US Dollar Index, which experienced consistent growth in 2022, rising from about 95.00 to 115.00.
In 2023, the DXY shows mixed sideways performance. It started the year near the 103.50 mark, hit a high of 105.88 later, and then corrected downwards, driven by concerns over a potential recession in the US. When drafting this article on 31 October 2023, the quotes were on the rise, hovering around 106.71. In case of further interest rate hikes in the US and no signs of a recession, the index quotes in 2024 may reach the 2022 high of 115.00.
DXY live chart
DXY forecast for 2024
In the short run, DXY forecasting depends on upcoming economic events, global sentiments, and changes in monetary policies altogether. Given that the financial landscape can change rapidly during the year, below are some thoughts and forecasts for the DXY for the next 12 months.
- Specialists at the Economy Forecast Agency (EFA) expect the DXY rate to be 101.34 by the end of 2024
- The Wallet Investor portal predicts that the index may rise to 113.51 by the end of 2024
- According to the forecast of data aggregator Trading Economics, the index will reach 111.74 by the end of 2024


How to use DXY forecasting
The DXY forecast is not merely a speculative tool but holds significant pragmatic value for various stakeholders in the financial world. Understanding the potential trajectory of the USD compared to a group of other major currencies can inform decisions ranging from investment strategies to monetary policy. Let's explore how different entities can utilise DXY forecasting.
For Investors
Portfolio Diversification: By predicting the strength or weakness of the USD, investors can make informed decisions on asset allocation, ensuring they have a mix of assets that can withstand potential currency fluctuations.
Foreign Investments: If the DXY is expected to weaken, investments in foreign assets could offer better returns when converted back to USD. Conversely, a strengthening DXY might favour domestic investments or those in dollar-denominated assets.
Hedging Strategies: Predicting the movement of the DXY can help investors hedge their portfolios against currency risks. For instance, if the DXY is forecasted to decline, investors might consider investing in assets that are inversely correlated to the dollar.
For Traders
Currency Trading: Forex traders can utilise DXY forecasts directly to trade the USD against other currencies. Predictions on the index's movement can guide buy or sell decisions.
Commodities Trading: Many global commodities, like oil, are priced in dollars. A forecasted rise in the DXY might hint at potential declines in commodity prices and vice versa.
Technical Strategies: Short-term traders, especially those who rely on technical analysis, can use DXY forecasts to confirm or challenge their chart-based predictions, incorporating fundamental insights into their strategies.
Risk Management: By keeping an eye on the expected trajectory of the DXY, traders can place stop losses, take profits, and manage their leverage more effectively, protecting their positions from unexpected shifts.
FAQ
What is DXY, and why is it important?
The DXY, commonly known as the US Dollar Index, is a measure of the value of the USD relative to a group of six major world currencies: the Euro (EUR), Japanese Yen (JPY), British Pound (GBP), Canadian Dollar (CAD), Swedish Krona (SEK), and Swiss Franc (CHF). The importance of the DXY lies in its representation of the US dollar's strength and overall standing in the global economy. Monitoring the DXY can provide insights into global economic health, trade balances, and potential shifts in international capital flows.
How is the DXY index calculated?
The DXY index is a weighted geometric mean of the USD's value against the six major world currencies mentioned earlier. Each currency is assigned a specific weight based on its importance and relevance in international trade and finance. The largest weight is given to the Euro, followed by the Yen, Pound, and so on. The index was initially set to 100.000 in its base year of 1973, and its value fluctuates based on the relative strength of the US dollar against the basket of currencies.
How does the DXY affect other currencies?
The DXY serves as a benchmark for the USD's strength. When the DXY rises, this is an indication that the USD is strengthening compared to the other major currencies in the basket. Conversely, when it falls, it suggests a weaker USD. As many commodities (like oil and gold) are priced in US dollars, a stronger dollar can mean higher commodity prices for countries using other currencies.
What factors influence the DXY?
You can find detailed information about it in the article. Briefly, several factors can influence the DXY: interest rates, major economic indicators (GDP, employment, and inflation rates), political issues, market volatility, and trade balances.
Can the DXY be used as an indicator for Forex trading?
Yes, the DXY can be a valuable tool for Forex traders. Since it reflects the USD's strength against a basket of major currencies, it can give traders insights into broader market trends.
* – The TradingView platform supplies the charts in this article, offering a versatile set of tools for analyzing financial markets. Serving as a cutting-edge online market data charting service, TradingView allows users to engage in technical analysis, explore financial data, and connect with other traders and investors. Additionally, it provides valuable guidance on how to read forex economic calendar effectively and offers insights into other financial assets.


