2024 XAU/USD Forecast: Analysis and Future Outlook for Gold Trends

10 minutes for reading
On 17 January 2024, we looked at the prevailing gold (XAU/USD) market trends, exploring historical trends and the key factors influencing the price of the precious metal. We conducted a technical analysis of the price chart and uncovered expert opinions on the gold price outlook for 2024.
You can visit the RoboForex Market Analysis webpage for the latest Gold (XAU/USD) forecasts.
Historical analysis of XAU/USD prices
Let us take a look at the gold price performance over the last 140 years:
- Since 1887, during the gold standard period, the US government fixed the gold price at 20.67 USD per troy ounce. After abandoning the gold standard and devaluing the dollar in 1933, the cost of an ounce increased to 35 USD and remained at this level until 1967
- Later in the 1970s, gold prices increased significantly due to international economic and geopolitical instability. From 1971 to 1980, quotes skyrocketed by over 1600%, from 35 to 800 USD per ounce
- In the 1980s-1990s, gold prices corrected downwards as the global and US economies experienced a period of relative stability, with declining oil prices
- In the 2000s, the price level remained relatively stable until the 2008 financial crisis, when quotes soared again from 800 to over 1,900 USD per ounce in 2011. The surge in prices and the end of the crisis were followed by a strong downward correction towards 1,100 USD
- From 2012 to 2020, the global economy and stock markets showed steady growth, with gold trading within a sideways price range from 1,100 to 1,400 USD per ounce
- In 2020, driven by the COVID-19 crisis, gold quotes resumed their upward movement, surpassing 2,000 USD per ounce
- In December 2023, amid rising inflation and geopolitical turbulence, the gold ounce set an all-time price record of 2,150 USD
Despite the high interest rates of the central banks, many investors prefer to invest their funds in gold. This metal is a safe-haven asset amid rising inflation and the current economic and geopolitical instability.
Historical chart XAU/USD prices*
Key factors influencing XAU/USD
- Economic indicators. This includes inflation, interest rates, unemployment, GDP, and other economic data. For example, a high inflation rate and economic instability may boost the demand for gold as a store of value
- Geopolitics. Investors traditionally consider gold a safe-haven asset against risks and uncertainty during wars, conflicts, sanctions, political and geopolitical instability, and tensions. Demand for gold typically increases during such periods
- New financial technology. For example, the development of the cryptocurrency market may negatively affect the demand for the precious metal. Investors might invest in digital assets instead of gold, lured by the potential for high returns
- US dollar exchange rate. As global gold prices are set in the USD, the US currency exchange rate fluctuations may also impact the price of the precious metal. Gold prices often fall when the US dollar strengthens since it becomes more expensive for buyers. Conversely, with a weak USD, gold prices may be on the rise
- Supply and demand. The precious metal’s price may increase, propelled by strong demand, for example, from central banks, investors, and jewellery companies, or reduced supply caused, for instance, by mining restrictions or a shortage of new deposits


2023 XAU/USD price market outlook
2023 saw a long-term growth trend in gold prices, with an average price of 1,950 USD per ounce. Starting the year at the 1,823 USD mark, quotes traded within a price range of 1,805 USD-2,150 USD throughout 2023. A new all-time high of 2,150 USD per ounce was reached in December 2023.
Geopolitical tensions, military conflicts, economic turbulence, and a global inflation surge drove gold quotes' growth in 2023. The rate hike policy pursued by the Federal Reserve and other central banks and the strengthening US dollar acted as headwinds. The price decreased after reaching an all-time high, showing signs of a downward correction.
2023 XAU/USD price market outlook*
Technical analysis of XAU/USD trends
Let us examine a weekly chart to analyse the current trend and the mid-term outlook for the price of the precious metal. At the time of writing, XAU/USD quotes hovered near 2,020 USD per ounce.
Since April 2020, they have been moving within a broad sideways range, with the lower boundary at 1,611 USD-1,615 USD and the upper one at 2,070 USD-2,078 USD. The price broke above the range’s upper boundary in December 2023 but pulled back, failing to gain a foothold above 2,078 USD. Consequently, a ‘false breakout’ technical structure has formed on the chart.
Although gold has been experiencing a steady uptrend confirmed by the Alligator and 200-day SMA indicators, there is a high likelihood that a downward correction may develop in the medium term. This can be supported by a closing price drop below the psychological threshold of 2,000 USD.
A decline target may be a vital support area of 1,805 USD-1,810 USD. If the quotes break above 2,078 USD again and establish themselves there, a corrective scenario will likely be cancelled. Subsequently, the uptrend will probably be expected to continue, with the price hitting an all-time high of 2,150 USD.
Technical Analysis of XAU/USD Trends*
Expert XAU/USD price predictions for 2024 and beyond
- UBS Global forecasts that gold prices will rise to 2,250 USD per ounce by the end of 2024
- According to Saxo Bank’s specialists, the precious metal quotes will reach the 2,300 USD mark in 2024
- J.P. Morgan expects gold prices to stand at 2,175 USD by mid-2024 amid potential rate cuts by the Federal Reserve
- According to Wallet Investor, the quotes will hover at 2,058 USD by the end of 2024, rising to 2,104 USD by December 2025
- The Economy Forecast Agency (EFA) analysts suggest that the precious metal price will climb to 2,158 USD by the end of 2024 and correct to 2,019 USD in December 2025


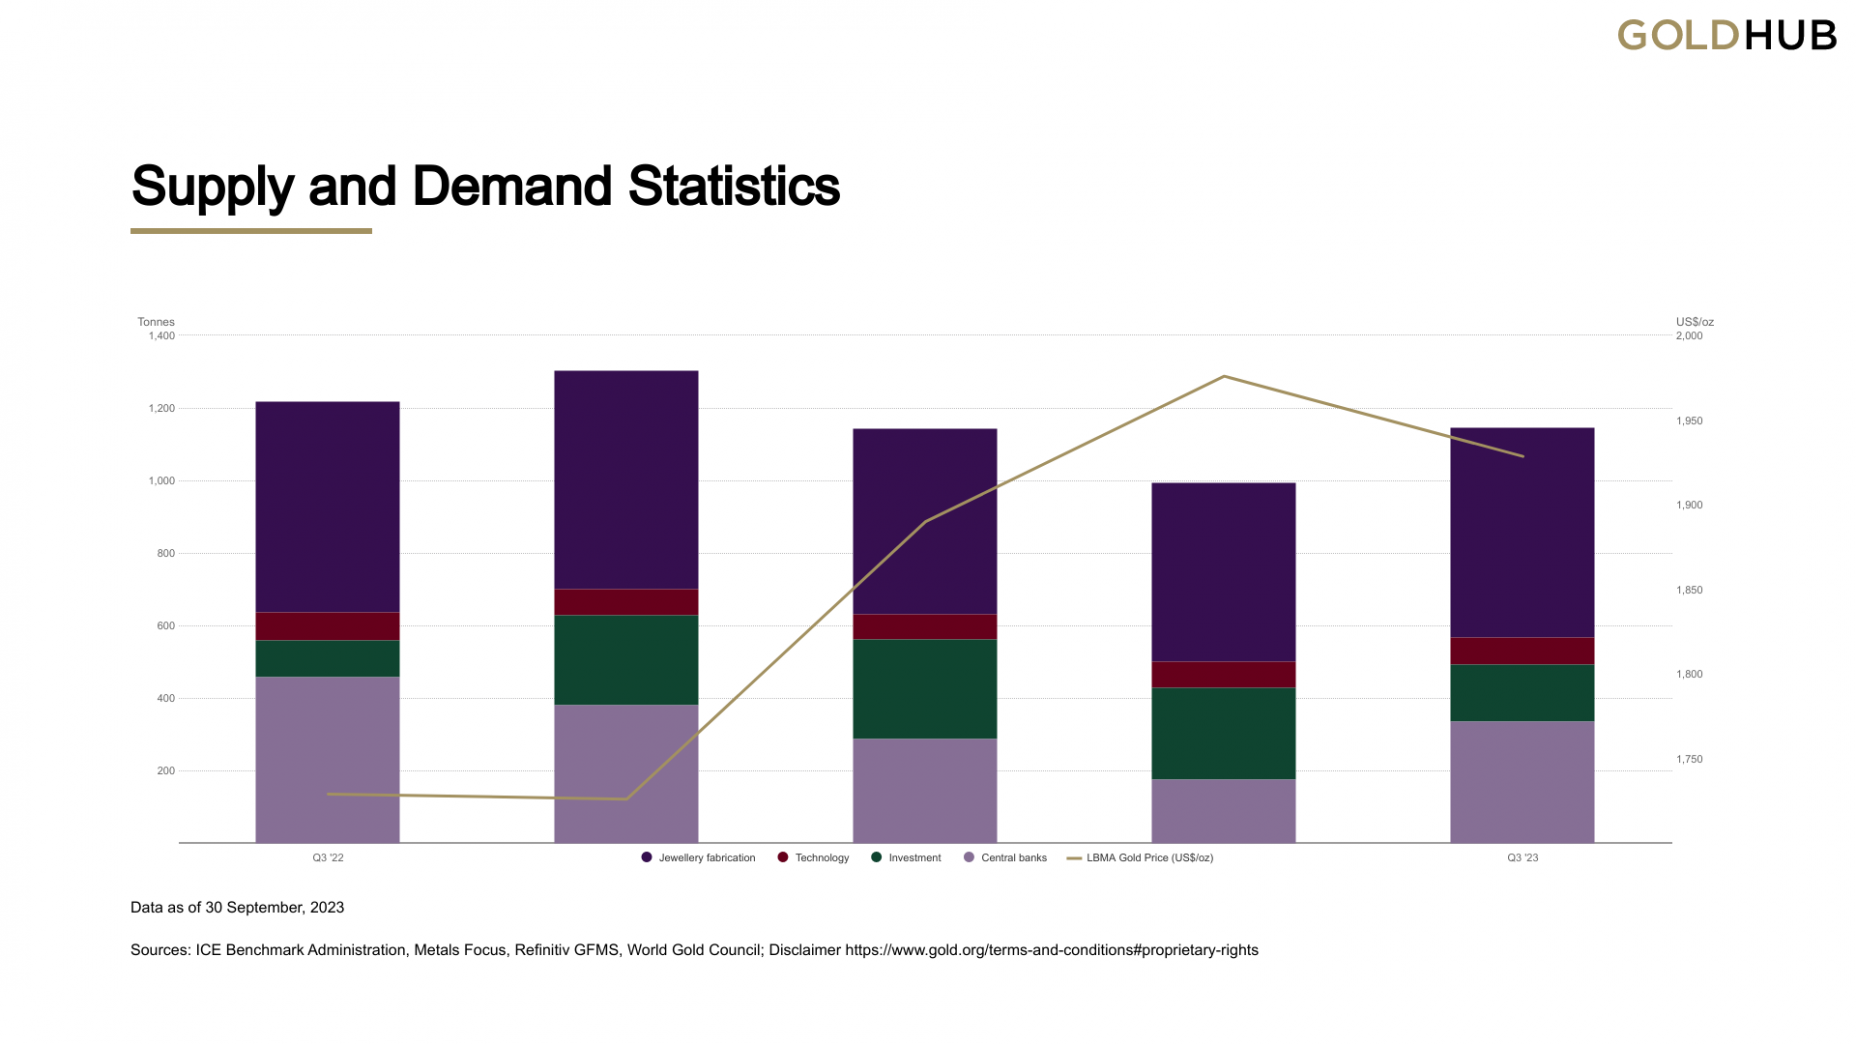
Global demand and supply dynamics for gold in 2023
According to the Q3 2023 survey by the World Gold Council (WGC), global gold demand and supply showed the following performance:
- Demand was 8% higher than a five-year average, reaching 1,147 tonnes. Total demand, including OTC supplies, was up 6% from 2022 at 1,267 tonnes
- Central bank buying was 337 tonnes, falling short of the record 459 tonnes in Q3 2022. Nevertheless, since the beginning of 2023, demand from central banks is 14% higher than in the same period of 2022, coming in at a record 800 tonnes
- Bar and coin investments decreased by 14% compared to the Q3 2022 results, down to 296 tonnes, although remaining firmly above the quarterly average of 267 tonnes. A decline from 2022 is attributed to a slump in European sales
- Jewellery purchases were down 2% y/y to 516 tonnes amid rising gold prices. Jewellery fabrication sank by 1% to 578 tonnes due to an increase in inventories
- Mine production reached a record 971 tonnes in Q3, marking a 6% increase from the corresponding period in 2022. Recycling was also higher than in 2022, up 8% to 289 tonnes
Strategies for trading XAU/USD
Various financial instruments such as futures, options, ETFs, CFD contracts, and spot can be used for trading gold.
Long-term trading – investing
The underlying principle of this strategy is to buy an instrument at the beginning of a new growth wave caused by fundamental factors, expecting it to reach peaks again or set new highs. This strategy is relatively simple but requires patience to await the projected profits.
Special ETFs are often used for investments. Gold ETFs were created to enable investments in gold without having to buy, keep, and manage the precious metal itself. Instead, investors can buy and sell shares of a gold ETF on a stock exchange, similar to stock trading. One of the largest ETFs like this is SPDR Gold Shares (GLD), with assets under its management amounting to 58.27 billion USD in January 2024.
Short and medium-term trading
This trading typically involves leverage. Short-term trading strategies aim to keep a position from one to several days, while medium-term ones maintain it from several days to one or two months. Trading types such as swing trading, day trading, and scalping can be used for gold trading.
Apart from fundamental factors, the decision-making is based on a technical analysis. Support/resistance levels and lines, price patterns, candlestick combinations, price action patterns, and indicator signals – all these and other tools help find promising trading opportunities.
The main principle of such trading is to enter a position using leverage (for example, based on a technical analysis pattern that has formed), having small targets and controlling risks.

Summary
Gold remains an attractive investment instrument as it is believed to be a reliable store of value over the long term. In 2023, the price reached an all-time high of 2,150 USD per ounce, driven by rising inflation, geopolitical tensions, and the end of the Federal Reserve’s monetary tightening cycle.
While the precious metal chart shows signs of a downward correction at the beginning of 2024, the long-term uptrend persists. Experts expect gold quotes to continue their upward trajectory in 2024 amid potential rate cuts by the Federal Reserve, geopolitical tensions, and persisting strong demand from central banks. The forecasts range from 2,058 to 2,300 USD per ounce.
FAQ
Why is XAU a gold symbol?
XAU is the currency code used to denote one troy ounce of gold in the global financial markets. This code is derived from the periodic table of elements, where 'Au' is the symbol for gold. The 'X' in front signifies that gold is not a national currency but a commodity. This coding system is standardised by the International Organization for Standardization (ISO) for precious metals.
What affects the price of XAU/USD?
Various factors, including global economic stability, inflation rates, US dollar strength, interest rate decisions by major central banks like the Federal Reserve, geopolitical tensions, and demand for gold in jewellery and technology, influence the price of XAU/USD. Additionally, market sentiment and investment trends can play significant roles in the fluctuation of gold prices.
Will XAU/USD go up or down in 2024?
Experts suggest that XAU/USD prices in 2024 will be in the range of 2,058 USD-2,300 USD per troy ounce.
Should I invest in gold?
Deciding to invest in gold depends on your individual financial goals, risk tolerance, and investment portfolio. Gold is often considered a 'safe-haven' asset that can diversify your portfolio and hedge against inflation and currency devaluation. However, like any investment, it carries risks, and its price can be volatile. It is advisable to consult with a financial advisor to determine if investing in gold aligns with your overall investment strategy.
How to invest in gold
Several methods for investing in gold include physical gold, mutual funds, ETFs, futures, CFDs, and more. For more detailed information, please refer to our post "How to Invest in Gold".
* – The TradingView platform supplies the charts in this article, offering a versatile set of tools for analyzing financial markets. Serving as a cutting-edge online market data charting service, TradingView allows users to engage in technical analysis, explore financial data, and connect with other traders and investors. Additionally, it provides valuable guidance on how to read forex economic calendar effectively and offers insights into other financial assets.