What Is PPI and How to Use It?
6 minutes for reading
One of the previous articles was devoted to the CPI – Consumer Price Index. Today’s article is about its nearest relative – the PPI (Producer Price Index).
What are they different in? What do they show? How to use the PPI in the currency market? This article tries to answer these questions.
Some history
The necessity to track indices appeared as early as the 20th century. In 1925, at the International Conference of Labor Statisticians, certain rules of data collection, processing, generalizing, and presenting were adopted. The importance of such information was acknowledged by all the participants of the conference.
Also, at the Conference, a universal approach to planning and regulating price policies of countries was worked out. Practically, these were the first steps towards globalizing international markets.
The standards created that time were revised three times later: in 1947, 1962, and 1987. In 1962, at the tenth Conference, the term PPI was finally adopted. This is exactly the term used today.
PPI vs CPI
The CPI (Consumer Price Index) is an instrument representing changes for goods and services prices at the final consumer’s side over a certain period. These data is normally used by Central Banks to make interest rate decisions.
When inflation grows, interest rates on loans start being increased in cycles, and when inflation slows down – they start being decreased the same way.
The PPI (Producer Price Index), in turn, reflects changes in goods prices at the wholesale stage, i.e. at the manufacturer’s end. The producer price practically demonstrates the whole range of spending, from buying crude materials through its processing, expenses on energy carriers, expenses on logistics, and to the final product.
As a result, producer prices start changing a bit earlier than at the consumer’s end. This allows calling this index a leading one, signaling about the future inflation level.
For example, if prices are growing at the wholesale level, this is likely to reflect in some growth at the consumer level over some time. This can make the CPI grow.
However, keep in mind that:
- The manufacturer may not always run to increasing wholesale prices due to an increase in the cost price because competition might be high, so the manufacturer fears losing their part of the market.
In such cases, the manufacturer starts looking for ways to make up for additional costs by other expenses.
- With retail sales, it is the same. Stores are also unwilling to increase final prices because this might scare off buyers. There, they also try to save up but keep prices without changes.
Where to find the PPI?
PPI values are calculated and published monthly. Every country has a national institution that cares for it.
For example, in the USA, the index is calculated by the Bureau of Labor Statistics, and in Britain – by the Office for National Statistics.
You can find the current, previous, and forecast PPI values in the RoboForex Economic calendar.
How to use the PPI in trading
Take a look at some examples of using the index for trading in the currency market.
Example 1
On September 10th, 2021, the USA published the new PPI value. It turned out to be 8.3% instead of 8.2% expected.
In the USA, the PPI touches upon three sectors: industry, goods and commodities, and recycling.
If the index values exceed expectations, the market goes up (the USD is bullish); if otherwise, the USD becomes bearish.
On the whole, you can trade such fundamental news using pending orders. Even such a minor difference (just 0.1%) created a momentum, so that the dollar grew, but never bothered other currencies.
As a rule, waiting for such news, the market consolidates in narrow ranges. Try using M15 and M30.
Choose the instrument in which it is easier to see the borders of the range, and place pending orders for breakaways of these borders.
For example, let us look at the reaction of the euro to this news. Check the chart below:
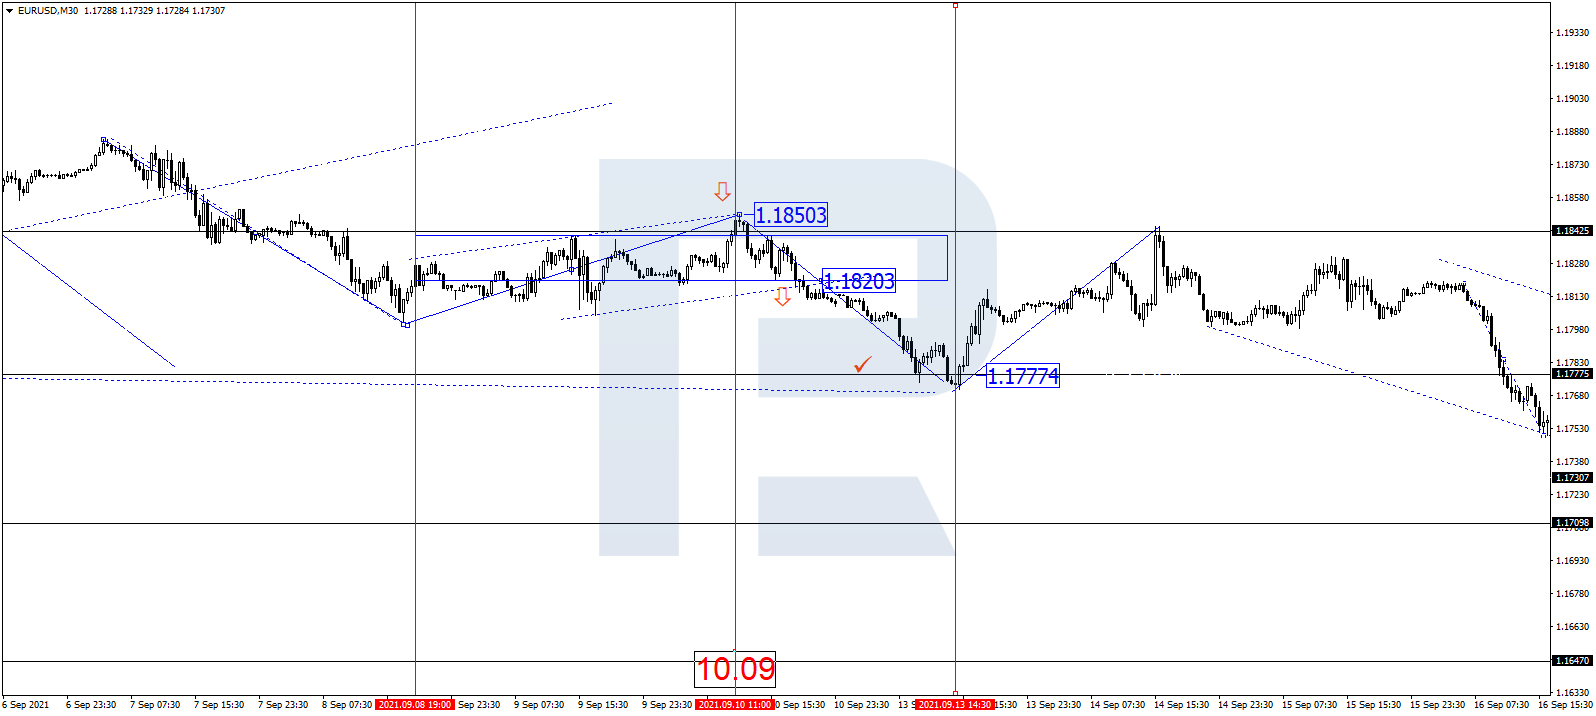
A pending selling order for a breakaway of 1.1818 downwards would have brought you a profit at 1.1777. This is the goal of the first wave of decline by the trend.
A pending buying order was to be placed at a breakaway of 1.1855 upwards. But as soon as a selling order is triggered, cancel the buying one.
Example 2
On September 15th, 2021, Britain followed up to publish the PPI. Instead of 0.4% forecast, it was 0.7% , and on the comments the Central Bank representatives said that 4 out of 8 committee members voted for an increase in the interest rate.
Taken together, this made the market optimistic, and GBP/USD corrected the whole preceding wave of falling.
The GBP reacted like the USD had done: if the index turns out above expectations, the market becomes bullish, and vice versa.
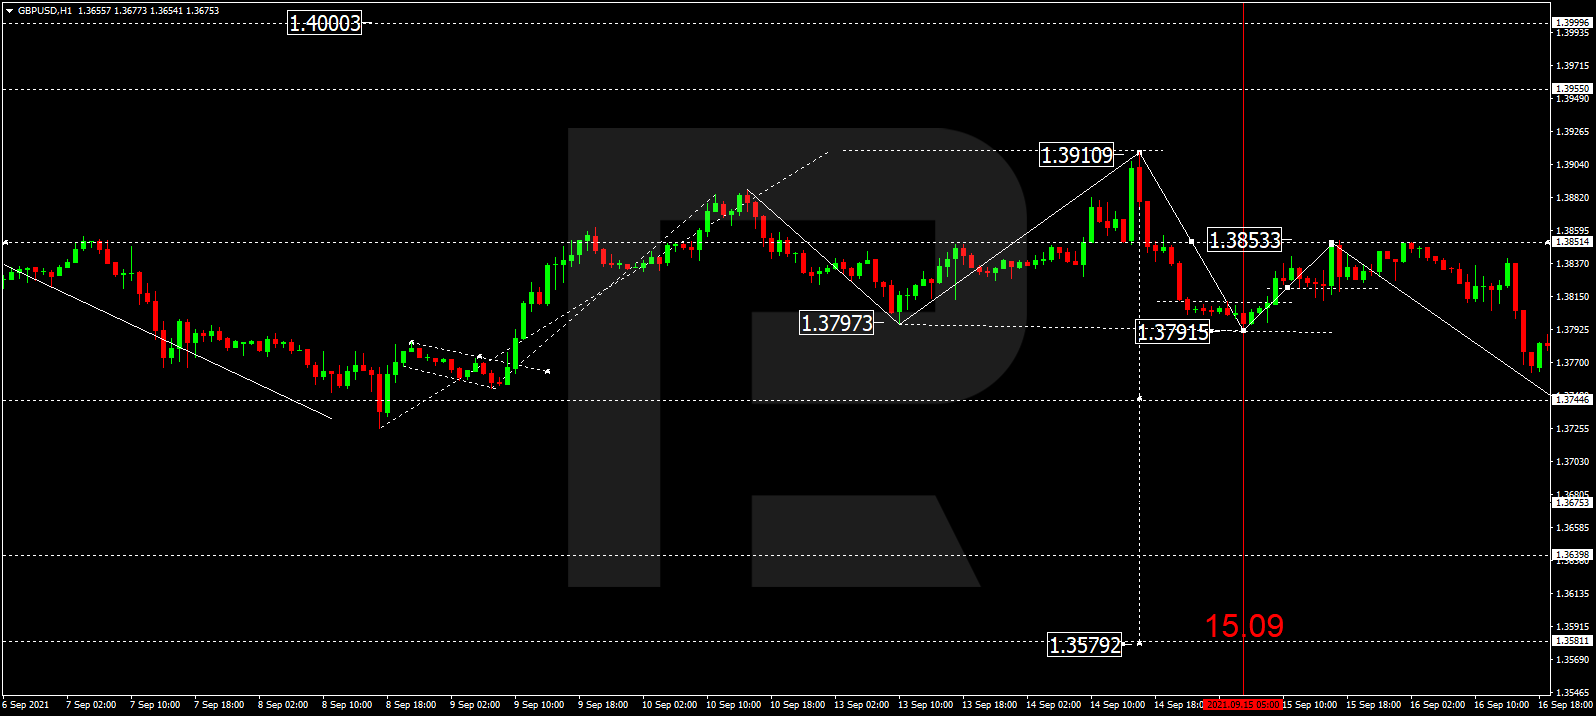
As we can see at the GBP/USD chart, on the day the PPI was published the market went steeply upwards, breaking through 1.3815 and corrected to 1.3853.
Summary
Experienced traders can easily make a profit using the CPI and PPI in trading. However, before opening a position, try to check the signal on some technical indicator. Also do not forget to limit your losses wisely.
I recommend beginners try this out on demo account.
Good luck, everyone!


