Trading Price Channels With Envelopes Indicator

5 minutes for reading
In this review, we will discuss the use of the Envelopes indicator. This indicator draws a dynamic price channel on the chart, helping to find trade signals.
What is the Envelopes indicator?
We may interpret the name Envelopes as referring to the envelopes we put letters in or in the sense "skirting", "circumflexing". I prefer the second description because the indicator looks like two curved lines rounding the price chart from above and below.
Envelopes is a trend indicator. As I have already mentioned, it consists of two lines which are deviations up and down from a normal Moving Average taken as the basis. I.e., based on a set MA (with the required period and averaging method) and the deviation size (in %), there appear two MAs on the chart.
These two MAs of the Envelopes indicator form a so-to-say dynamic price channel on the chart. Each line acts as either support or resistance:
- The lower line of the indicator is the set MA moved down, acting as a dynamic support level;
- The upper line is the set MA moved upwards, acting as a dynamic resistance level.
If the deviation size is chosen well, the price chart remains in this dynamic price channel most of the time, which lets us use the borders of this channel as landmarks for trades. Envelopes is included in many popular trading platforms.

Characteristics and settings
To add the Envelopes indicator to the price chart in MetaTrader 4 or MetaTrader 5, open it via the Main Menu: Insert - Indicators - Trend - Envelopes.
The calculating algorithm looks as follows:
- UPPER LINE = SMA (CLOSE, N) * (1 + K / 100)
- LOWER LINE = SMA (CLOSE, N) * (1 - K / 100)
Where:
- UPPER LINE is the upper line of the indicator
- LOWER LINE is the lower line of the indicator
- SMA is a Simple Moving Average
- CLOSE is the closing price
- N is the averaging period
- K is the deviation size (in %).
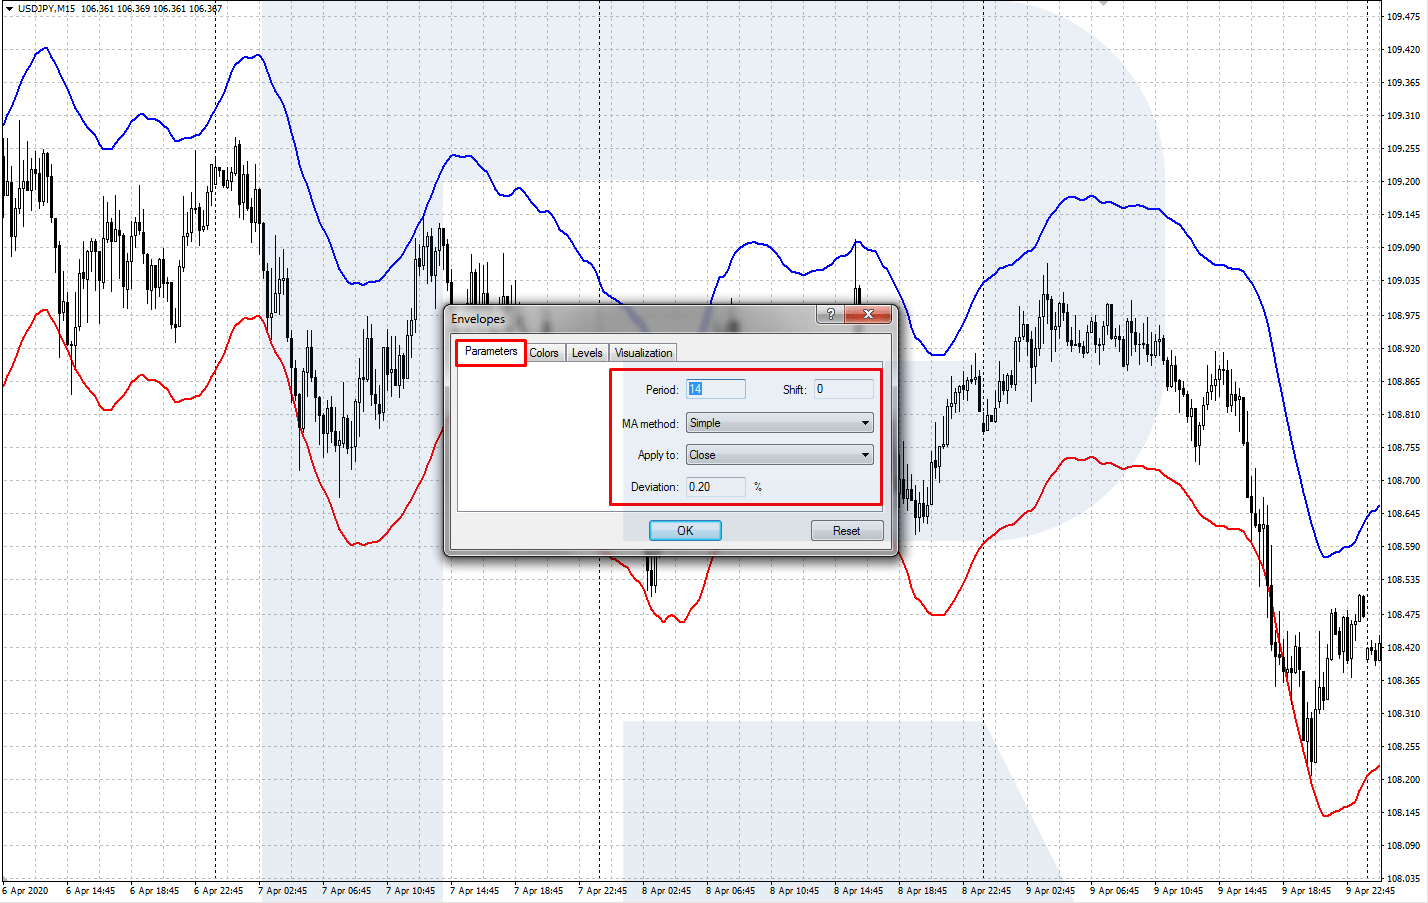
Envelopes indicator parameters
When installing Envelopes to your price chart, specify the following parameters:
- Period is the averaging period of the MA. The default setting is 14.
- Shift: you may shift the indicator several candlesticks forward.
- MA method: by default, it is Simple.
- Applied to: specify the price type. By default, it is Close.
- Deviation of the indicator in %. The width of the dynamic channel depends on this setting. It is matched by eye so that the upper line went through the price highs, while the lower one - through the lows. The value normally varies from 0.1 to 0.5 depending on the chosen timeframe and the volatility of the instrument.
How to trade with Envelopes indicator?
The indicator generates two main trading signals: a bounce off the borders of the price channel and a breakaway of the borders.
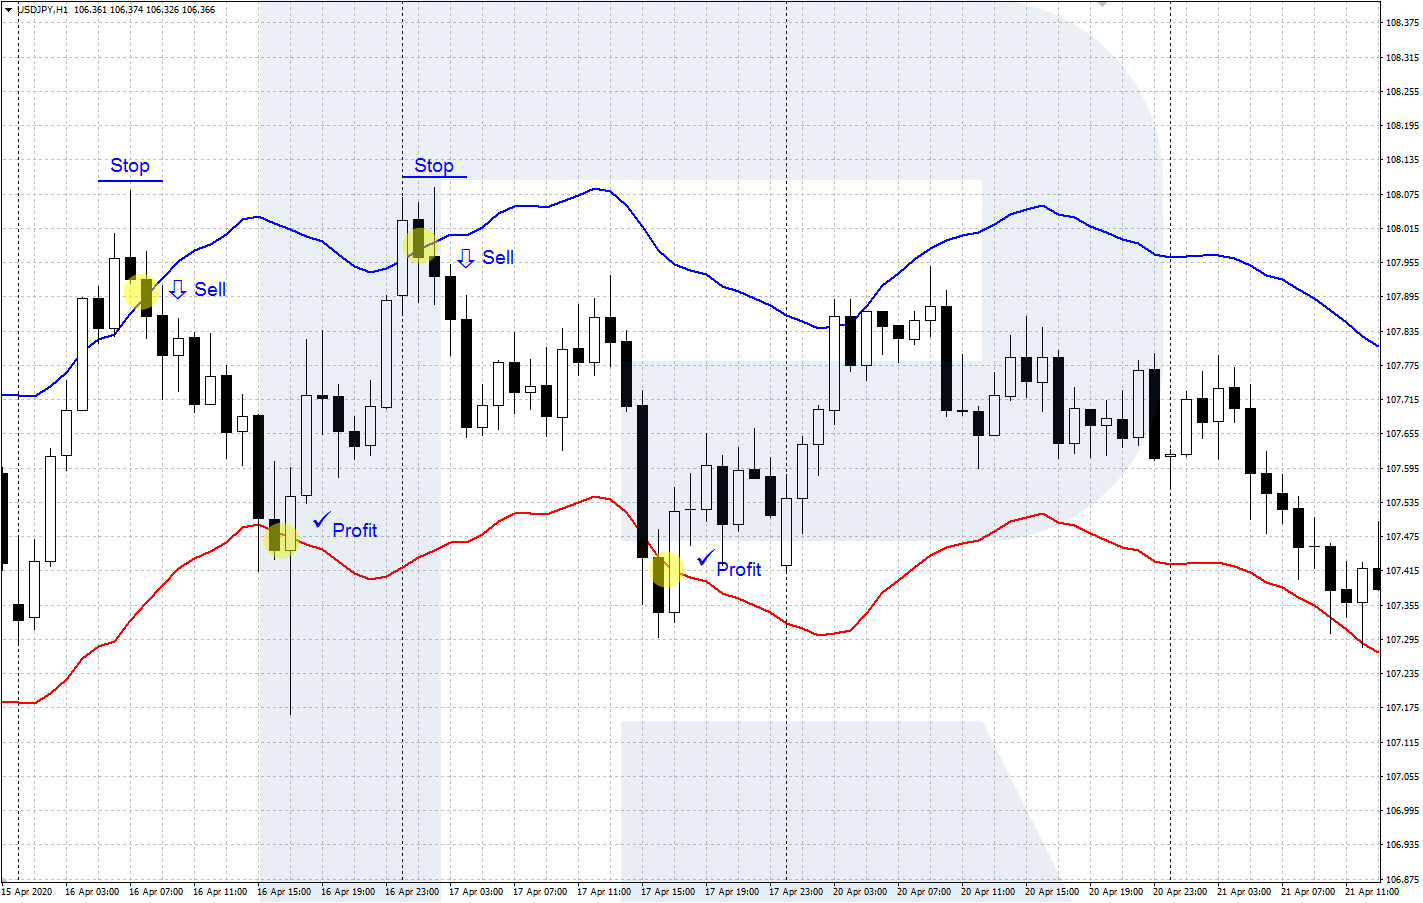
A bounce off the price channel
Trading bounces is preferred when there are no bright movements on the chart, and the price is moving slowly in a flat. In this case, you may trade bounces off both borders of Envelopes indicator. If there is evidence that a trend is beginning, it would be wiser to use only the trades in the direction of the trend: bounces off the lower border in the case of an uptrend and bounces off the upper border in the case of a downtrend.
Signal to buy
A signal to buy appears when the price bounces off the lower border of the indicator. Having reached the lower border, the price must form a lock low and reverse upwards. After it does so, open a buying position with a Stop Loss behind the low recently formed. You may lock in Take Profit when the price reaches the upper border of the indicator and aims at reversing.

Signal to sell
A signal to sell appears when the price bounces off the upper border of the indicator. Having reached the upper border, the price must form a lock high and reverse downwards. After the reversal forms, open a selling trade with an SL behind the high just formed. Lock in profit after the price reaches the lower border and bounces off it.
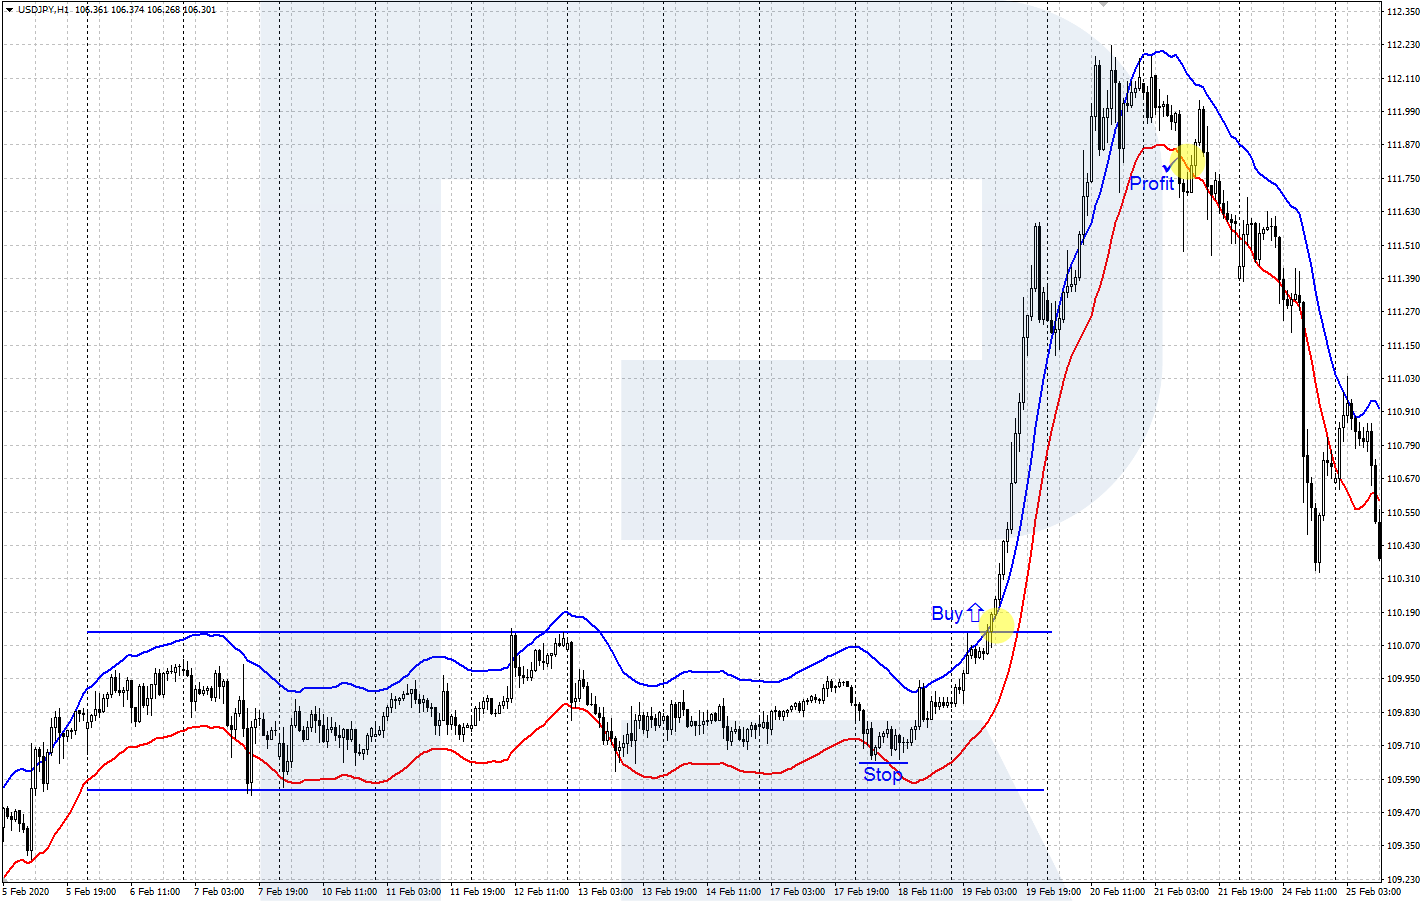
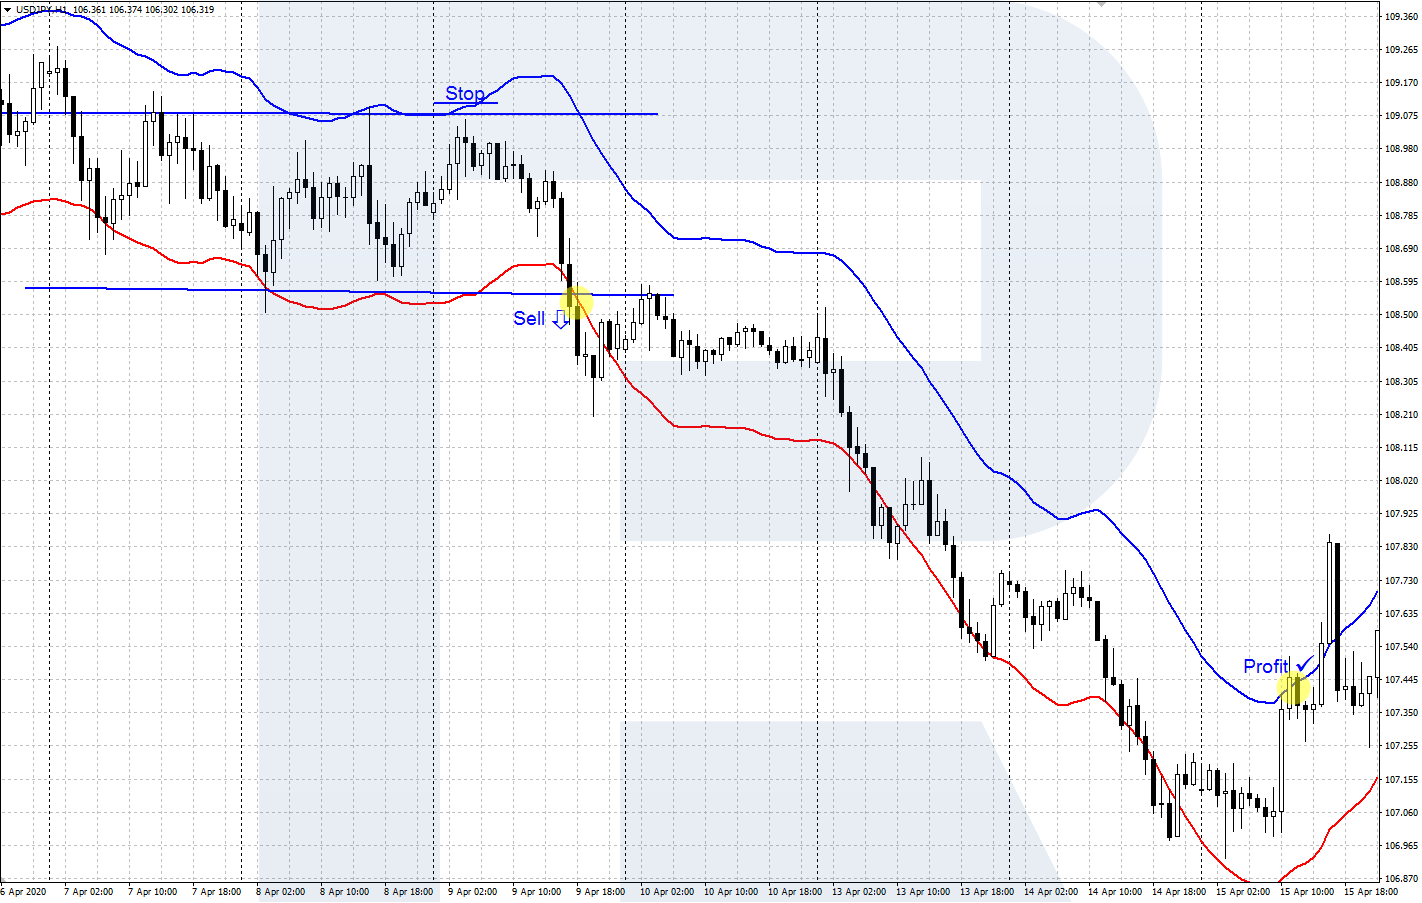
Breakaways of the borders
We trade breakaways of the channel borders when a new trend begins on the market. i.e. there is a sharp price movement that results in escaping the channel.
Signal to buy
A signal to buy appears when, after a flat, the price performs a steep upward movement and rises above the upper border of the price channel. After the price closes above the upper line of the indicator open a buying position with an SL behind the nearest low. You may lock in profit when a strong local resistance level is reached or if the price reverses and goes below the lower line of the indicator.
Signal to sell
A signal to sell appears when the price demonstrates a downward momentum, breaking away the preceding flat. Open a selling trade after the price closes below the lower border of the channel and place an SL behind the local high. Lock in profit at a bounce off an important support level or if the price reverses and goes above the upper border of the channel.
Bottom line
The Envelopes indicator draws a dynamic price channel on the chart used for finding trading signals. The indicator is easy to use and works well in a flat. To enhance the quality of trading signals, you may use Envelopes along with other indicators, levels, tech analysis patterns, or Price Action patterns.


