Flat (Range) on the Market: How to Approach It?

5 minutes for reading
To answer the question in the heading we need to understand what is a flat. In literature, this is characterized as a sideways movement without clear direction up- or downwards. To put it simply, the price is moving to the right, the local maximums and minimums are on the same level.
The market is considered to be 70% flat and features only 30% of strong uptrends and downtrends. We might say that such periods represent price balance; however, right after the escape of the price from the borders of the flat, we may expect a movement.
How to detect a flat on the chart
In an uptrend, every next maximum and minimum should be higher than the previous one; then we can call it a bullish trend. It is important here to look for those ideas only that confirm growth.
And if each next maximum and minimum is below the previous one then this is a downtrend. Here, signals should be searched that confirm the decline.
Finally, if there is no clear trend, and the prices keep pushing from the resistance level and then bouncing off the support line, such a movement is a flat. In this situation, we can either buy or sell.
Let us have a look at the example of a flat on the EUR/USD chart. As we may see, the upper border of the channel is near 1.1535. Upon testing this line, the prices push from it and move to the nearest support area. And from 1.0580, they bounce off again and proceed to the upper border of our channel.
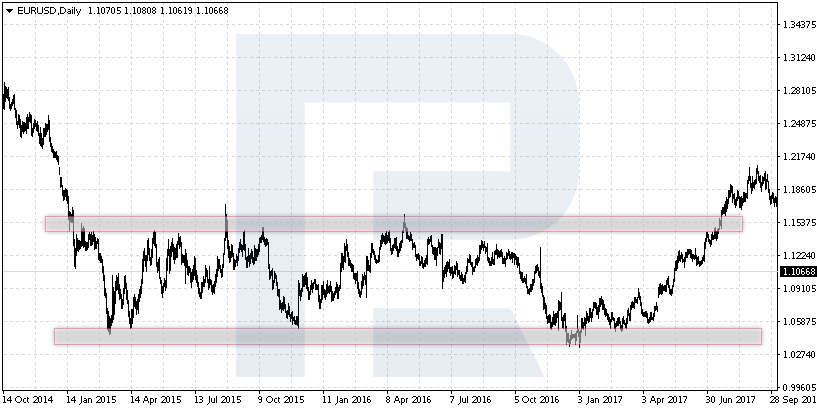
For us, it is important that the prices bounce off the resistance level several times and also tested the support several times; this will signify a flat forming.
How to trade in a flat
This type of trend is considered good for a newcomer. As a rule, beginners like to average their positions, and in a flat, the prices return to the initial values, unlike strong trends. So, we can easily stay with a losing position open and even make money on it. Anyway, we should follow the rules of money management and try to work in a system, avoiding intuitive trading.
A divergence on the MACD
If in a strong trend the Moving Averages work well, in the absence of a trend divergences on the MACD. We can even say that as soon as all MACD signals execute one after another, the market gets into a flat.
Let us have a look at the USD/CHF pair. To use the MACD, we switch to H1. Combining larger and smaller timeframes is an integral part of chart analysis. Having detected a flat on a larger timeframe, the trader simply looks for entry points on smaller ones.
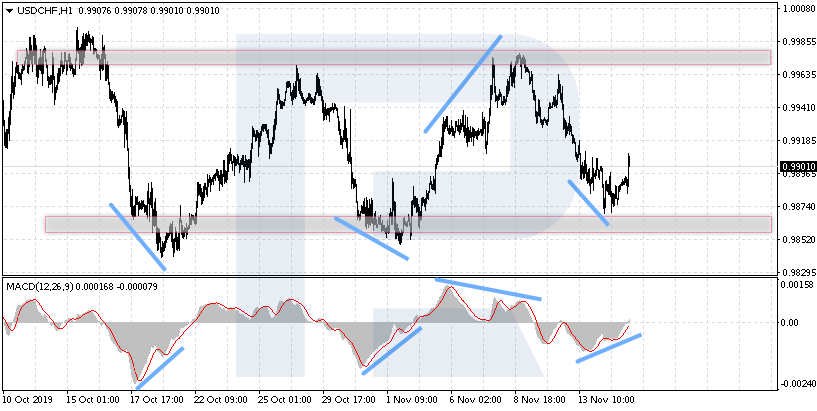
The divergences that we should pay attention to are those that form at the moment of a test of the upper or the lower border of our channel. Conversely, if the signal forms in the middle of the channel, we better skip it.
As we may see, if one of the borders was tested and a signal appeared on the MACD, it is highly probable that the prices will return into the channel and move in the opposite direction. The market is entered following the rules; for us, it is important to wait until the signal line escapes the histogram area of the indicator. This will be the entry point.
Overbought and oversold areas on the RSI
Here, we will also see bounces and moving in the opposite direction after the tests of the levels above 80 or below 20 on the RSI. What is more, the very appearance of such formations will mean a flat on the market.
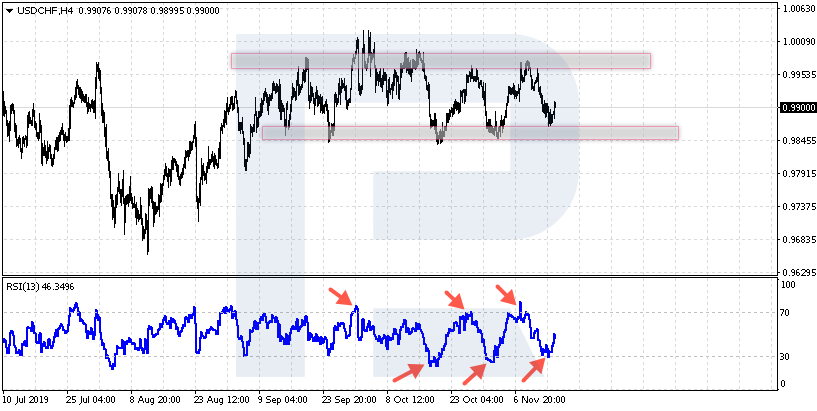
The return of the indicator values below 80 and a test of the upper border of the channel will signal to sell. The return of the indicator values above 20 and a test of the lower border of the channel will signal to buy.
Bounces off levels
If we are moving in a flat, we can simply trade bounces off the borders of the channel. In this case, a Stop order is placed somewhat higher than the nearest maximum (if we sell) or below the closest minimum (if we buy).
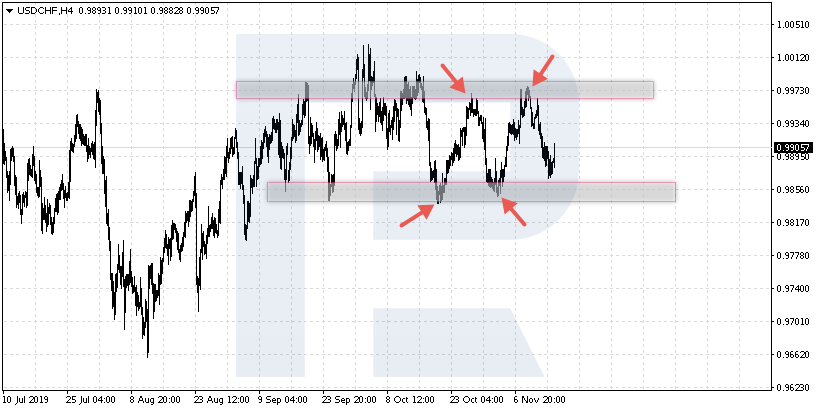
For example, if the resistance level is set at 0.9905, at the moment of testing this area we can open a selling position with an SL above 0.9935. If the prices keep going up, they might easily be escaping the channel, starting a trend, so the position should better be closed.
The MAs in a flat
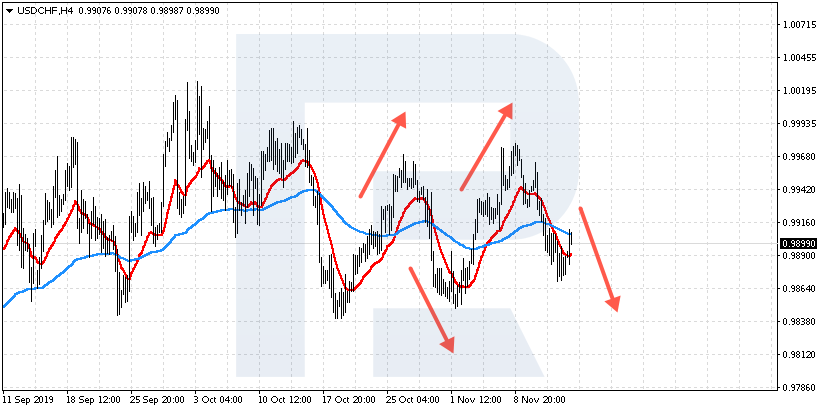
Unfortunately, one of the best trend indicators is nearly useless on such markets. Again, look at the example of the USD/CHF pair. As we can see, after the crossing of the MAs and the price returning to them, a bounce does not happen, and the price keeps moving against our signal. In a flat, we will constantly be seeing crossings of the MAs, and most often these positions will be losing.
Closing thoughts
Trading in a flat is comfortable from several points of view. First of all, the channel has clear borders. The trader always understands where to sell and where to buy. Risks are controlled easily, an SL is placed out of the channel. The most popular and simple oscillators, such as the MACD and RSI, work well, a divergence gives a clear entry point to the market, and the signals most often execute.
The disadvantages of this market are the appearance of false breakouts at the tests of the borders of the flat, which may make the trader believe at the end of the flat. Also, channels are not always clearly visible on the charts, and their detection is subjective.


