Top 7 Forex Trend Indicators

5 minutes for reading
Trading indicators have long become reliable helpers to traders. This article presents seven popular indicators that help define the trend direction and find good entry signals.
1. The Moving Average
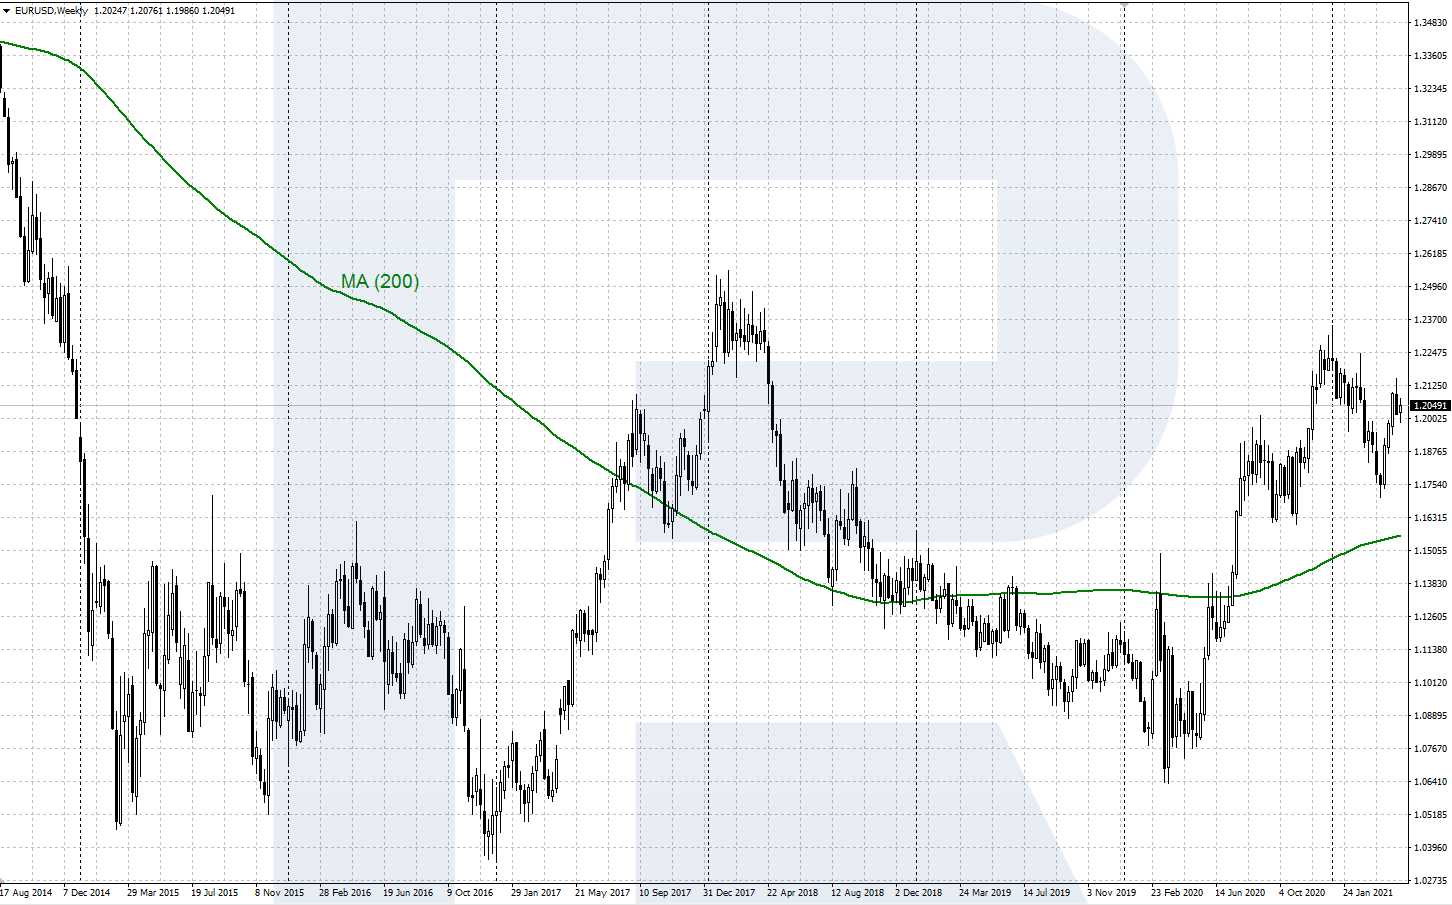
The Moving Average shows the changes in the average asset price during a certain period. This is one of the simplest and clearest trend indicators, frequently used as a part of more complicated indicators. There are various methods of calculating Moving Averages: Simple, Exponential, Smoothed, Weighted.
A Moving Average is drawn automatically on the chart as a colored line (the color and width are customizable). Moderate growth of the Moving Average indicates an uptrend, while a decline points at a downtrend. If an MA with a large period (such as 200) crosses the price chart from below, this means a downtrend is changing for an uptrend; if the crossing happens top-down, this means an uptrend is reversing, becoming a downtrend.
Find more details about this indicator in the following article:
2. The Average Directional Movement Index (ADX)
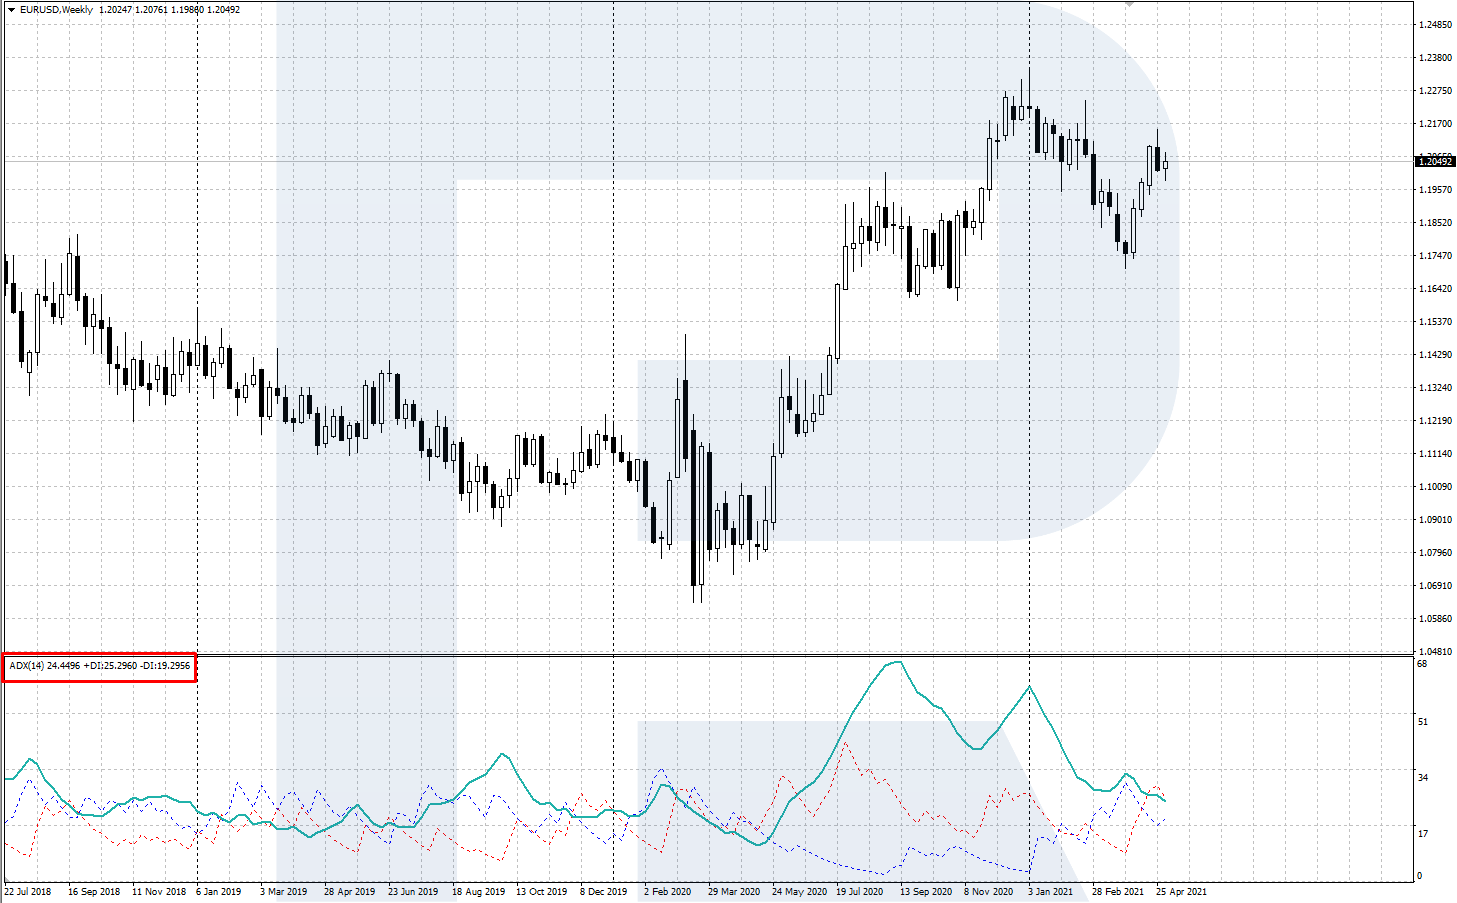
The ADX indicator helps you to see whether the market is trading in a trend or a flat. This indicator is based on two simpler ones: the Positive Directional Index (+DI) and the Negative Directional Index (-DI).
The indicator is displayed in a separate window under the price chart; it consists of three colored lines: ADX, +DI, and -DI. The beginning of a trend is indicated by the ADX line going upwards and crossing the two Directional lines. If the growth of the ADX line is confident, this means the trend is stable, while the other two lines indicate the direction of the trend: ascending or descending.
In more detail, about the ADX indicator:
3. Ichimoku Kinko Hyo
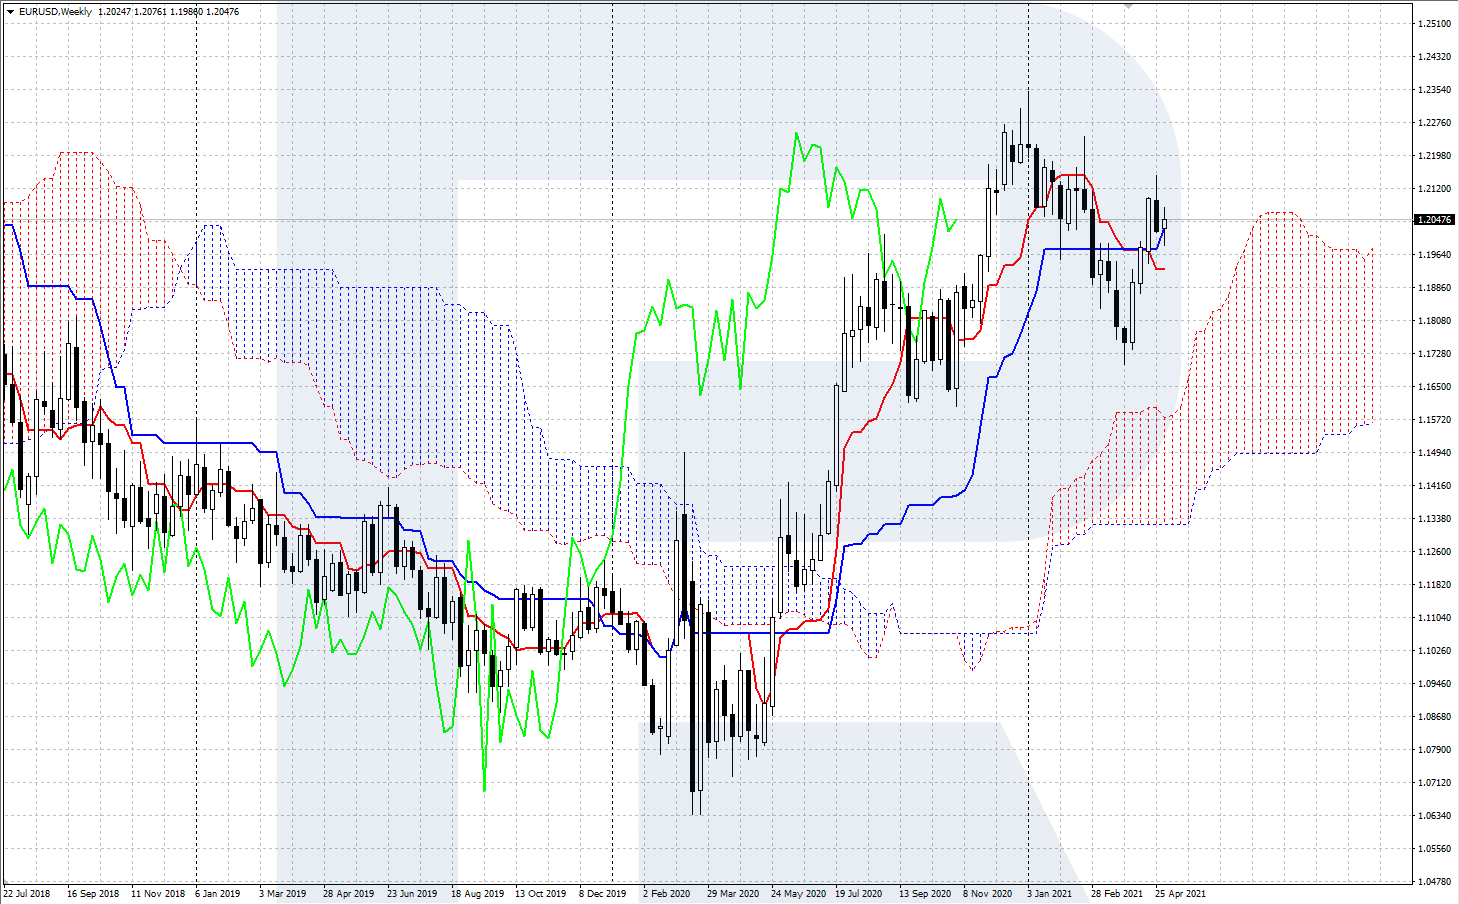
Ichimoku Kinko Hyo is a popular trend indicator designed by a Japanese analyst Goichi Hosoda, known under his pen-name Sanjin Ichimoku. The indicator consists of five lines with different calculation methods; two of them construct a so-called Ichimoku Cloud. Ichimoku is a trend indicator showing the direction and potential of the current trend.
The indicator is displayed right on the price chart, its lines serve as support/resistance levels and give opening and closing market signals. The indicator is mostly recommended for daily and weekly timeframes, alongside candlestick analysis. However, you can set the indicator for smaller timeframes, such as H4 and H1.
Find a detailed description of trading with the Ichimoku indicator here:
4. Bollinger Bands
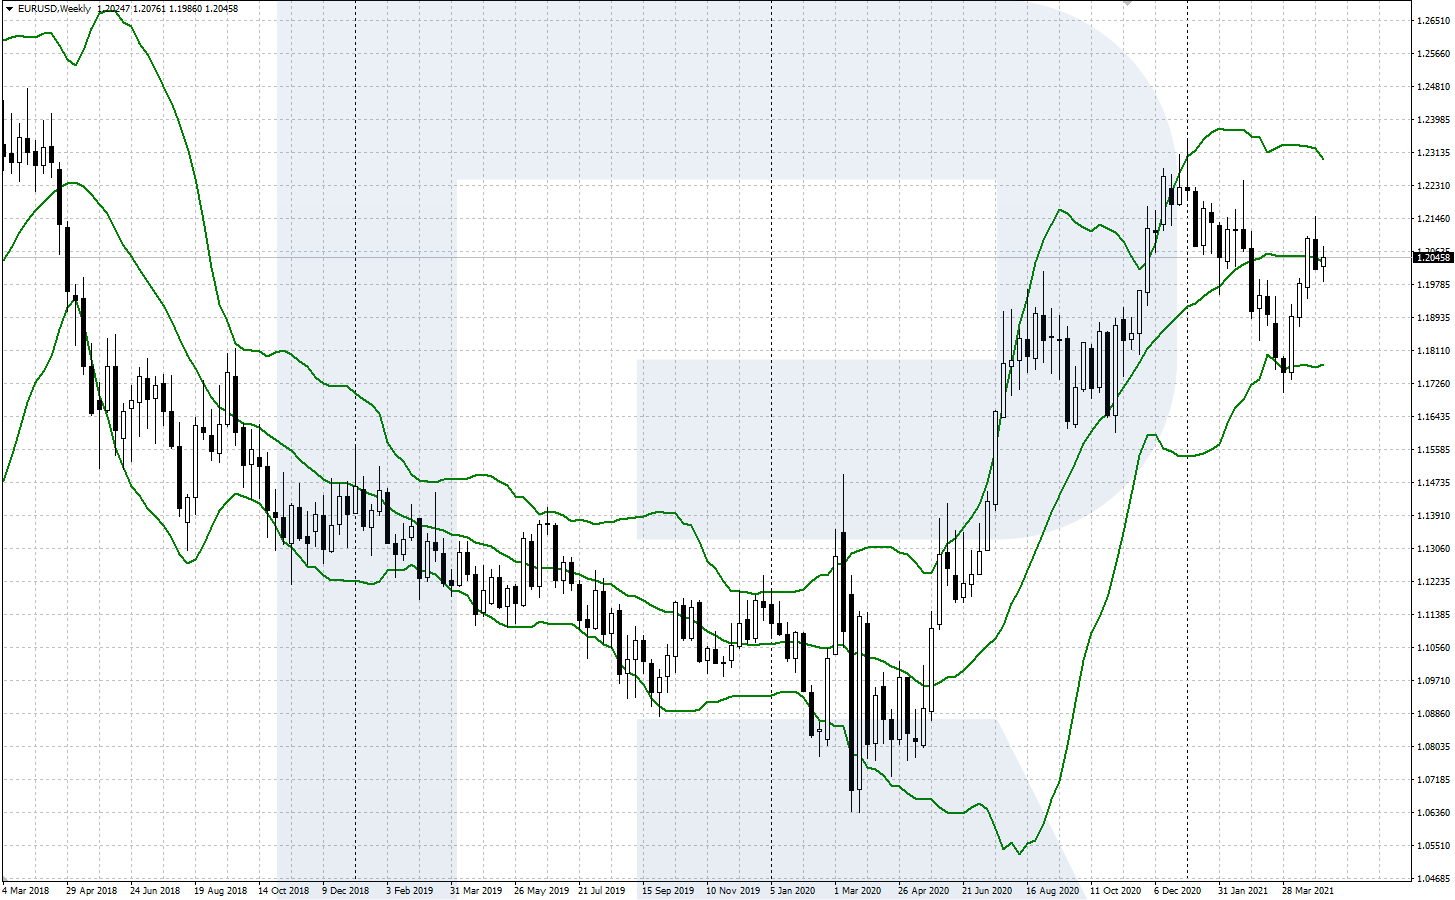
This trend indicator was designed by an American trader John Bollinger. The indicator is based on a Moving Average. The indicator contains three lines: the main (central) one, which is the Moving Average, and their two standard fluctuations up- and downwards.
Bollinger Bands are displayed right on the price chart. The upper and lower lines create a sort of a dynamic price channel inside which the quotations move. You can trade bounces off the indicator lines or exits off its borders. Bollinger Bands show the beginning of a new trend after the price escapes a flat.
Read more details about the indicator and its use in the market here:


5. Alligator
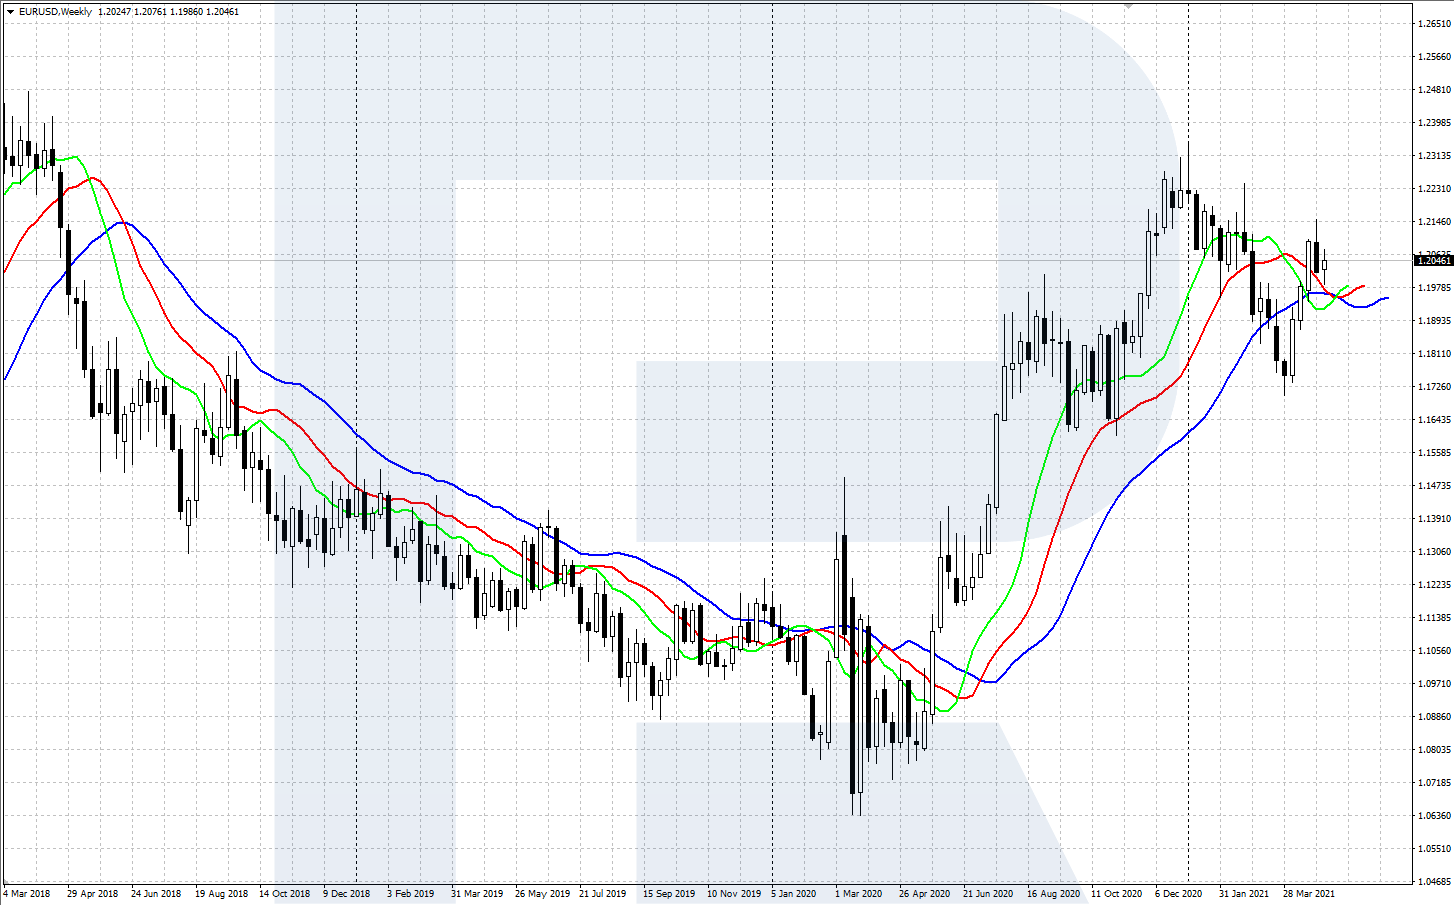
Alligator is a popular trend indicator designed and promoted by a famous stock market guru Bill Williams. Alligator is constituted by three MAs with different periods. It got its name because the diverging MAs look a bit like an alligator’s open jaw.
The indicator is drawn right on the price chart. Just after the price consolidates in a small range (flat) and then starts a trend movement, the Alligator opens its jaw – all the three lines set off in the same direction, gradually diverging. When the jaw opens upwards, this means an uptrend, while a jaw opened downwards points at a downtrend.
More details about the indicator and trading it:
6. The Envelopes indicator
This trend indicator contains two lines, which are up- and downwards fluctuations from a usual MA, taken as the base. In other words, based on a set MA ( with a certain period and averaging method) and fluctuation (in %), the indicator draws two lines, constituting a price channel.
In this dynamic price channel, the lower line is the support, while the upper one is the resistance. If the fluctuation is set well, the price chart remains within the Envelopes channel most of the time. This allows using these borders as landmarks for positions.

Read more detail about Envelopes in the following article:
7. The Parabolic Sar
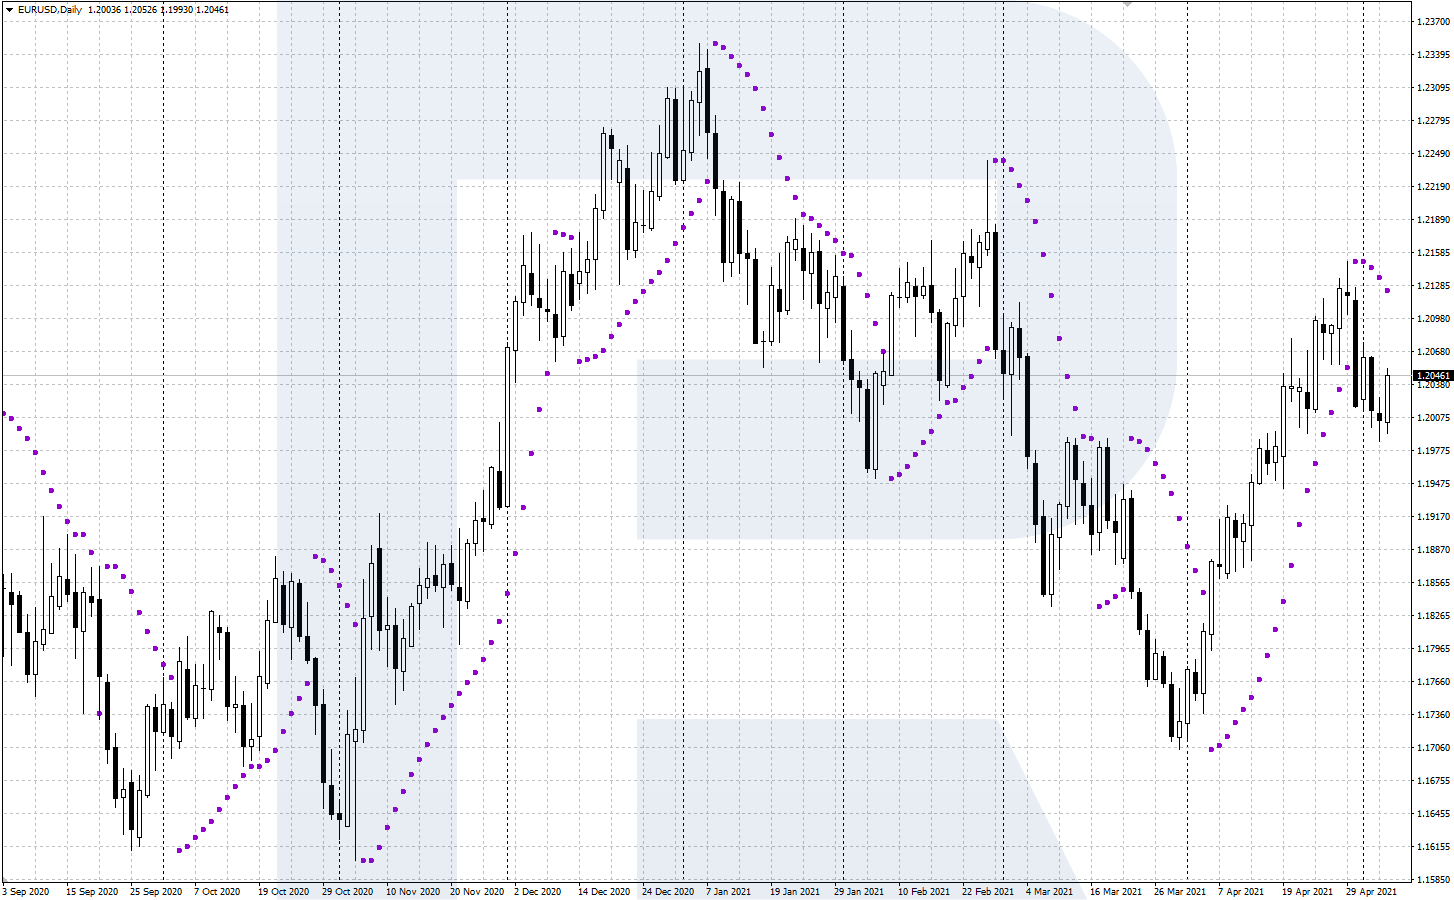
The Parabolic Sar is a well-known trend indicator created by a famous US expert J. Welles Wilder. Sar stands for Stop And Reverse, which means the current position is closed and a new one is opened in the opposite direction. The indicator shows the direction of the current trend and signals the beginning of a correction or reversal.
The Parabolic Sar is displayed on the price chart as colored dots. If the price chart gets under the dots, this means a downtrend, while if the quotations go confidently above the dots, the trend is ascending. Most often, traders use Parabolic dots for placing Stop Losses. After you open a position by the trend, you can drag the SL along the Parabolic dots until the position closes.
More details about the indicator and trading it here:
Closing thoughts
This article has shown you the seven most popular trend indicators used by traders in Forex, stock, and commodity markets. You can backtest these indicators and choose those that suit your trading style more than others.
I recommend trend indicators for detecting the trend direction and reflecting local support and resistance levels on the chart.


