Candlestick Analysis: 24 Main Candlestick Patterns

9 minutes for reading
On all financial markets, the price of an asset is reflected as a price chart, constantly changing during the trading session in accordance with demand and supply.
What is a candle?
A candlestick is a way of displaying information about the price movement of an asset. The candlestick chart is one of the most popular components of technical analysis, allowing traders to quickly and easily interpret price information from multiple price bars.
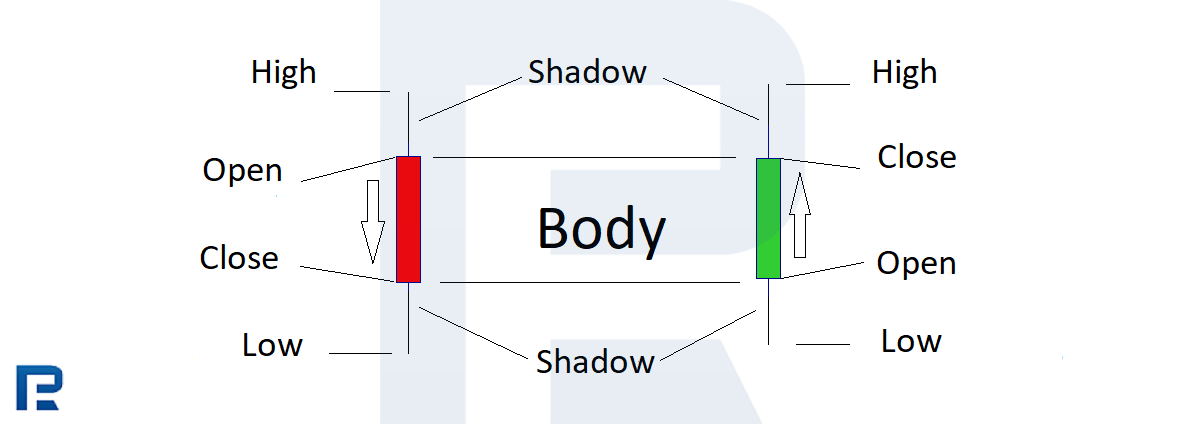
A candle has three main parameters:
- The body of the candle, representing the opening-closing range.
- A wick or shadow indicating the daily high and low.
- A color that shows the direction of the market - a green (or white) body indicates an increase in price, and a red (or black) body indicates a decrease in price.
Over time, individual candles form patterns that traders can use to recognize major support and resistance levels. There are so many candlestick patterns that indicate opportunities in the market - some give an idea of the balance between buying and selling pressure, while others identify continuation patterns or market hesitation.
Before you start trading, it's important to familiarize yourself with the basics of candlestick patterns and how they can inform your decisions.
In order to understand this, let's take a look at the types of charts below.
Types of charts
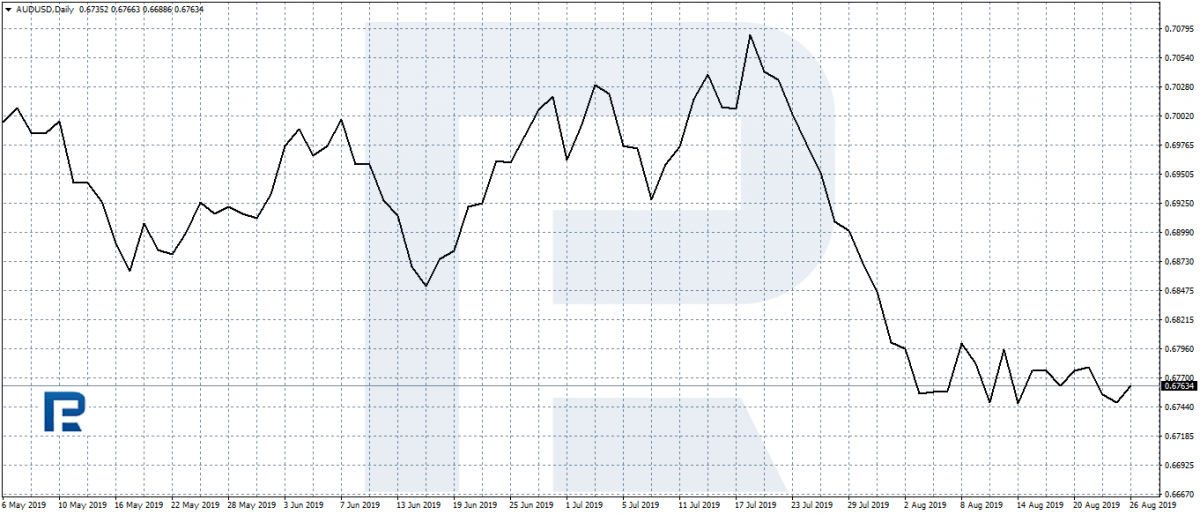
Linear chart
A linear chart looks like a line (a curve) and normally reflects the closing price at a certain moment (timeframe).
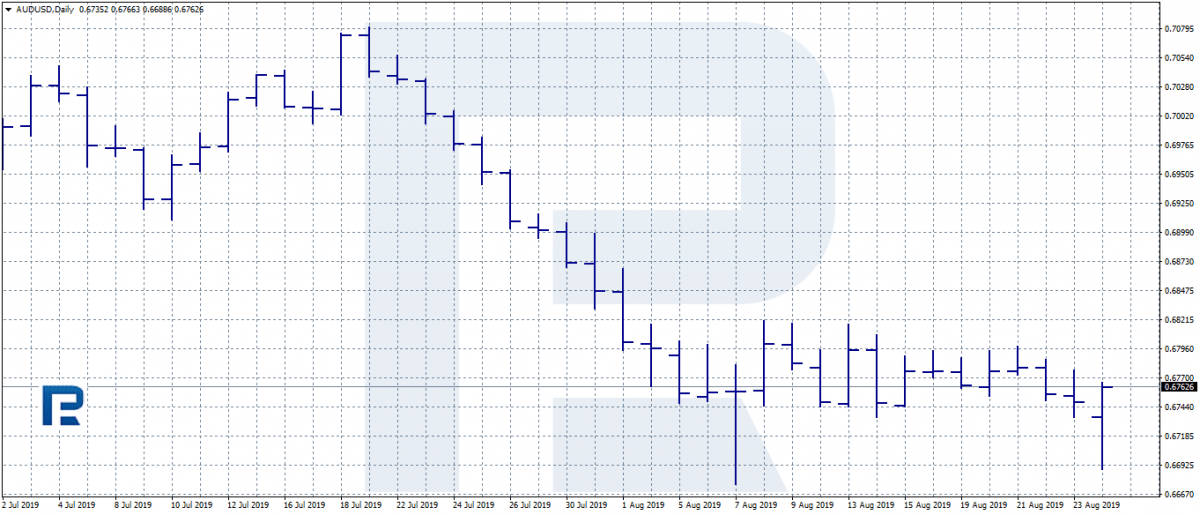
Bar chart
On a bar chart, price movements are reflected as vertical lines with small horizontal shelves to the left and to the right from the line. A bar shows four prices:
- Opening price.
- Minimum.
- Maximum.
- Closing price.
Japanese candlestick chart
A Japanese candlestick chart looks like a rectangle with two "tails" on the top and at the bottom. Same as the bars reflects four prices:
- Opening price.
- Minimum.
- Maximum.
- Closing price.
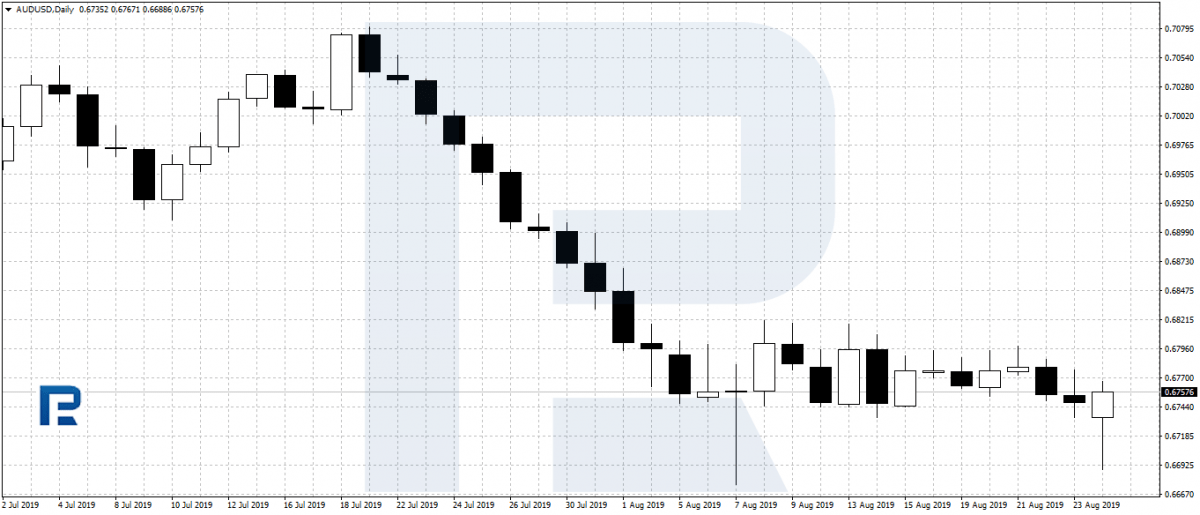
As seen on the above-mentioned examples and pictures, a Japanese candlestick chart looks more informative than the linear or bar charts. The color settings are various, and the trader can always combine the desired colors. In this article, we shall use the following scheme: a growing (bullish) candlestick will be green, a falling (bearish) candlestick will be red, and a doji — black.
Later on, in this article we shall discuss Japanese candlesticks in detail: how they form, what they are called, what types and combinations exist.
As said above, there are four prices shown by Japanese candlesticks: the opening price, the minimal and maximal prices and the closing price.
Types of Japanese candlesticks
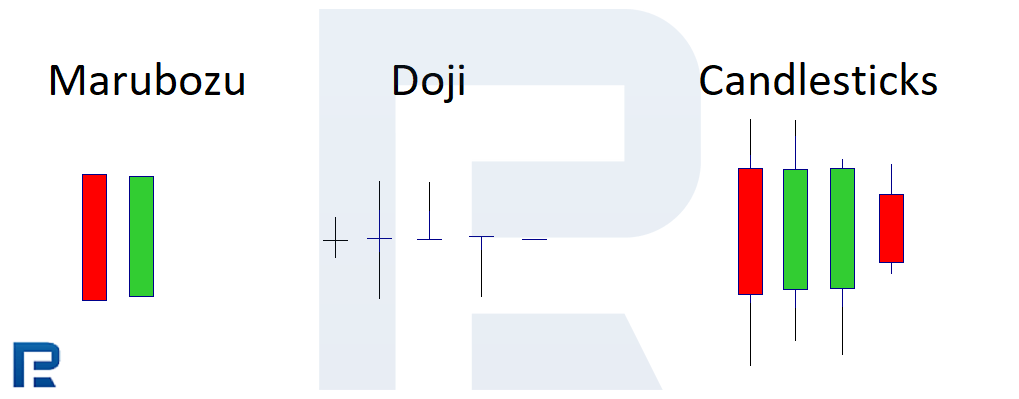
Let us now look at the types of Japanese candlesticks: some may lack bodies or shadows, some may have just one shadow. By shape, candlesticks are divided into:
- Normal (without anomalies).
- Marubozu (long shadowless bodies).
- Dojis (line-like bodies, where the opening price coincide with the closing price or is very near to it).
Depending on the place of forming, candlesticks will have different names, though they will look roughly the same. At the same time, there are candlestick patterns which name do not depend on the place of formation. Based on these parameters, candlestick patterns may be divided into several groups:
- Reversal candlesticks at the top of the trend
- Reversal candlesticks at the bottom of the trend
- Continuation candlestick patterns
- Candlestick patterns that can form either at the top or at the bottom of the trend, its name remaining the same
Let us discuss the most popular and easy to define patterns.
Types of patterns in candlestick analysis
Candlestick patterns formed at the top of a trend
Now let us discuss the conditions for the formation of the aforementioned patterns and look at the pictures.
Candlestick patterns, formed at the top of the trend, are normally preceded by a long-time directed upward movement.
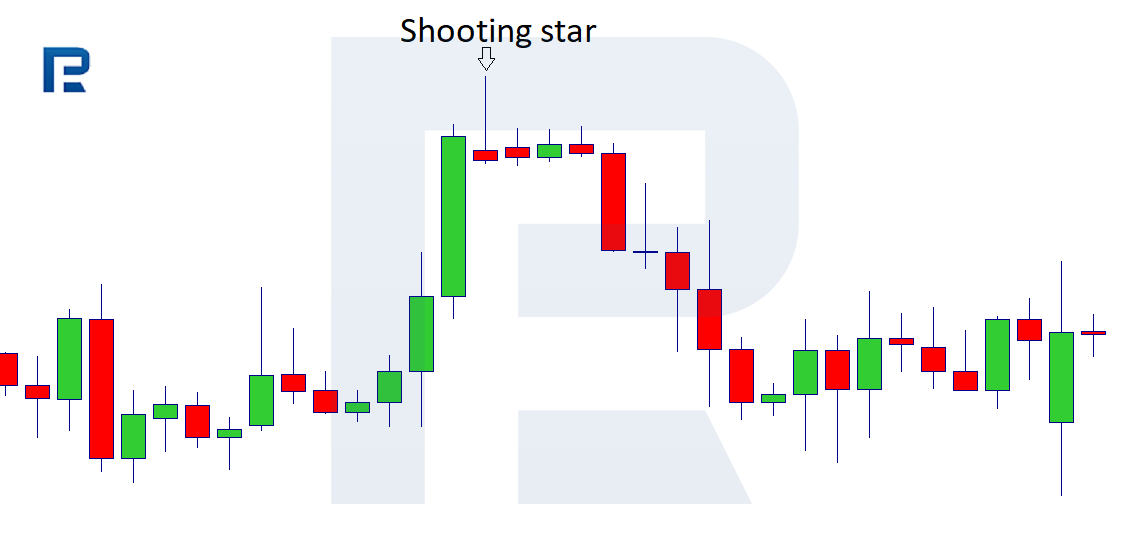
Shooting Star
A Shooting Star pattern has a small body and a long shadow along with the trend. The second shadow is either too small or lacking.
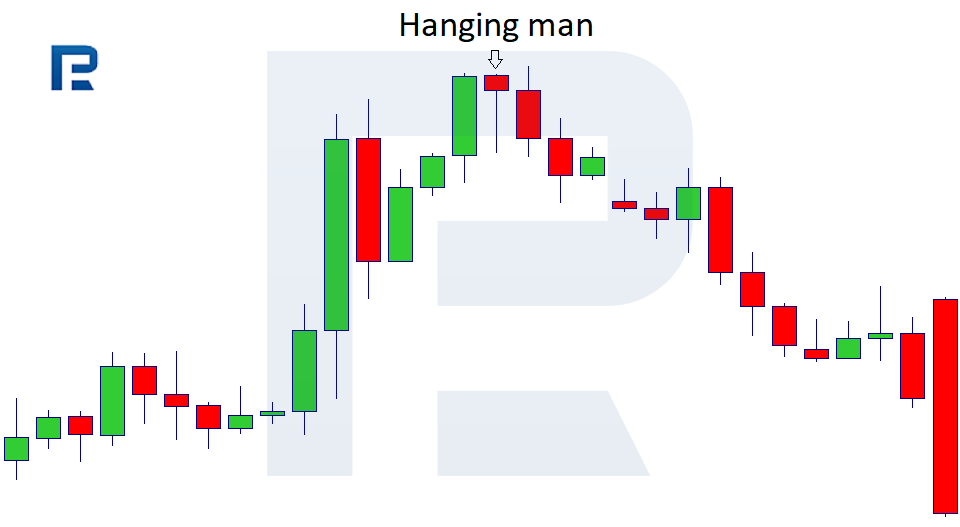
Hanging Man
A Hanging Man has a small body and a very long shadow directed downwards (counter the current trend). The second shadow is very small or lacking.
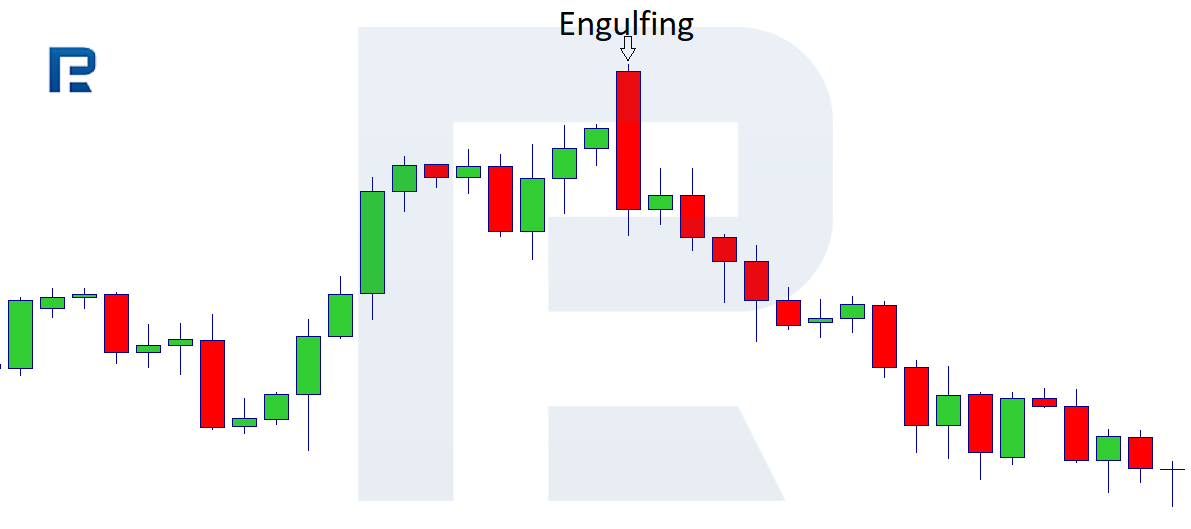
Engulfing Bearish
Engulfing Bearish is a candlestick significantly bigger than the previous one, fully covering it. The shadows play a secondary part here. As the name suggests, the candlestick must be a different colour than the previous one.
Dark Clouds
Dark Clouds pattern is a bearish candlestick opening with a gap; when closing, it covers the gap up, partly engulfing the previous candlestick.

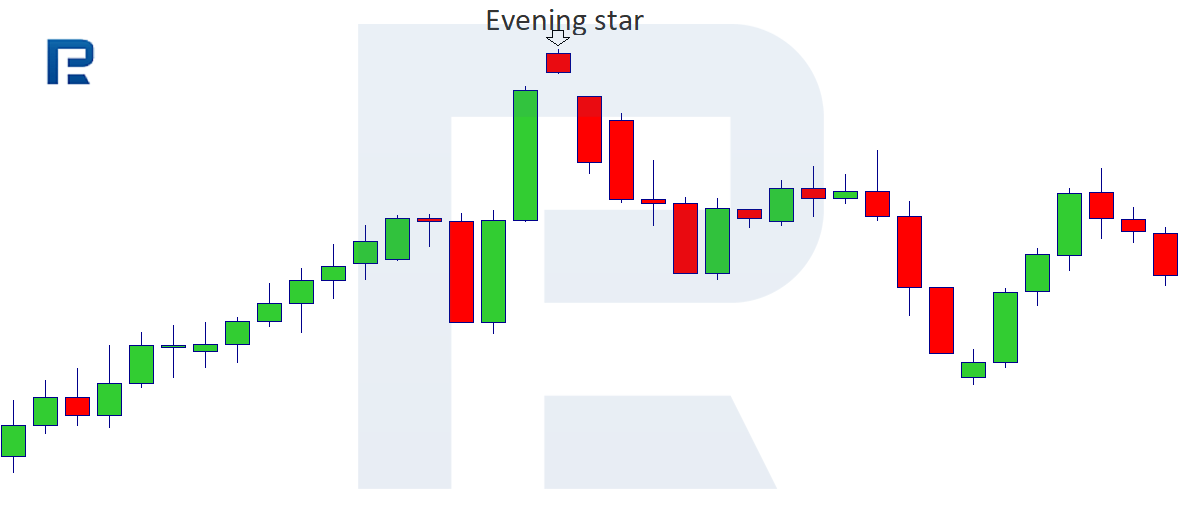
Evening Star
An Evening Star is a pattern composed of three candlesticks. The outside candlesticks have large bodies, the central one has a small body, opens and closes with a gap.
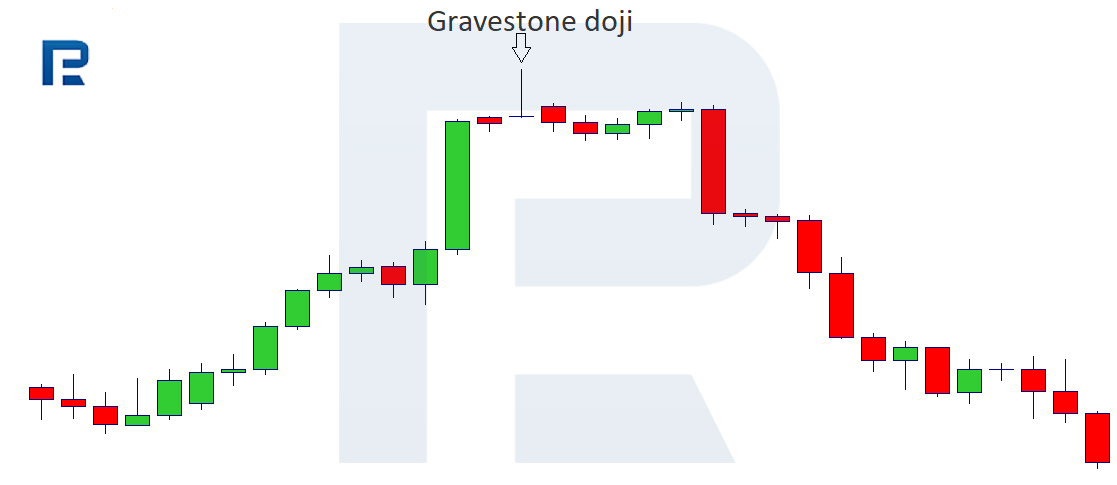
Gravestone Doji
A Gravestone Doji is a candlestick with a totally lacking body (the opening and closing prices are at the same level) or a very small body; the lower shadow is also lacking.
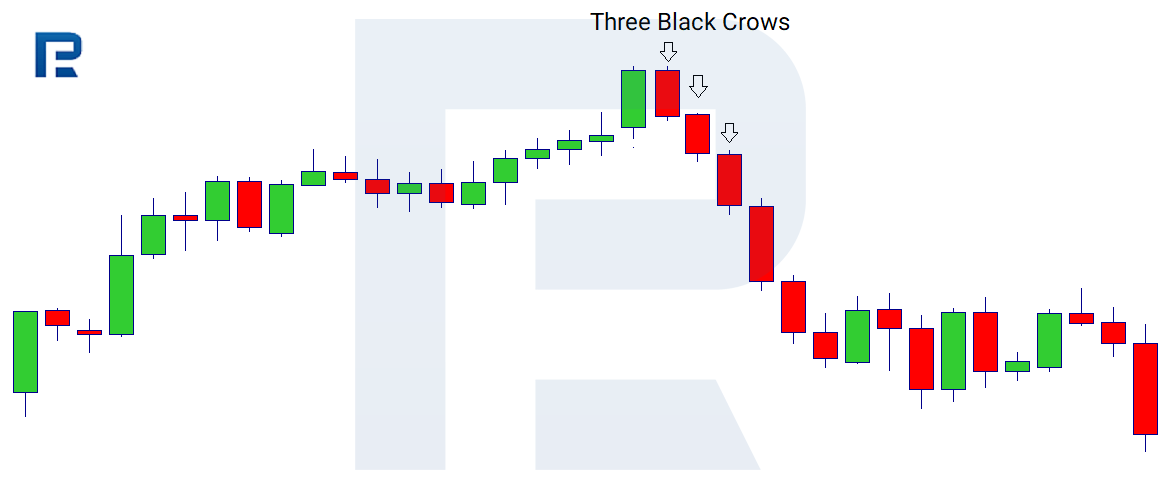
Three Black Crows
Three Black Crows are three candlesticks with large bodies, directed counter the main trend and situated at the top of an uptrend.
Now let us pass on to the candlestick patterns at the bottom of the trend. As a rule, their emergence is also preceded by a strong movement, downwards this time.


Candles formed at the bottom of a trend
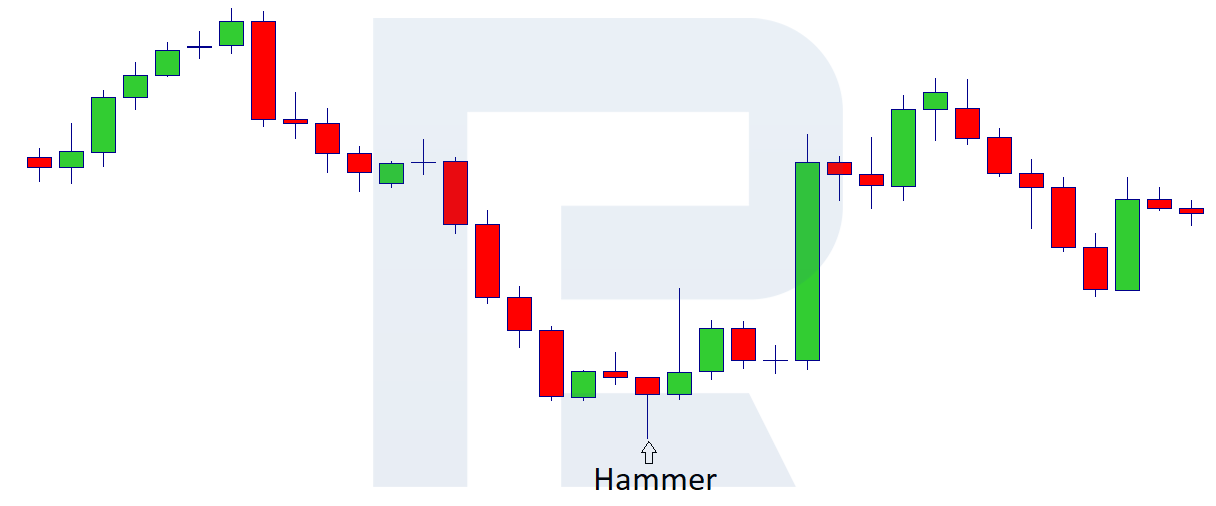
Hammer
A Hammer pattern has a small body and a shadow headed along with the trend, i.e. downwards; the second shadow is either very small or lacking. The Hammer is similar to the Hanging Man, only it forms at the bottom of the trend.
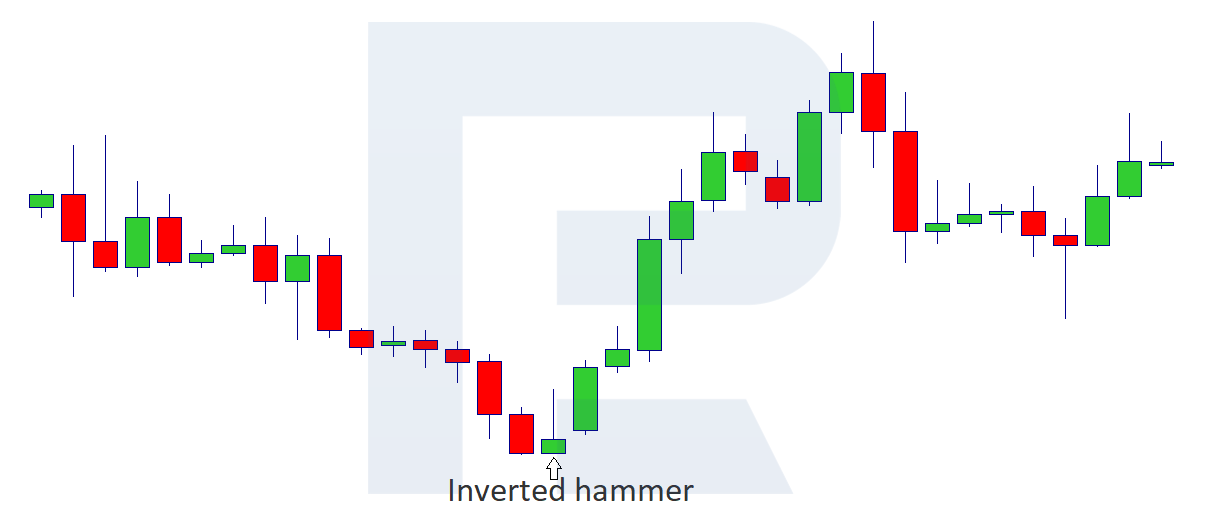
Inverted Hammer
An Inverted Hammer has a small body and one long shadow counter the current trend, the second shadow lacking or being very small. Looks like a Shooting Star, only at the bottom of the trend.
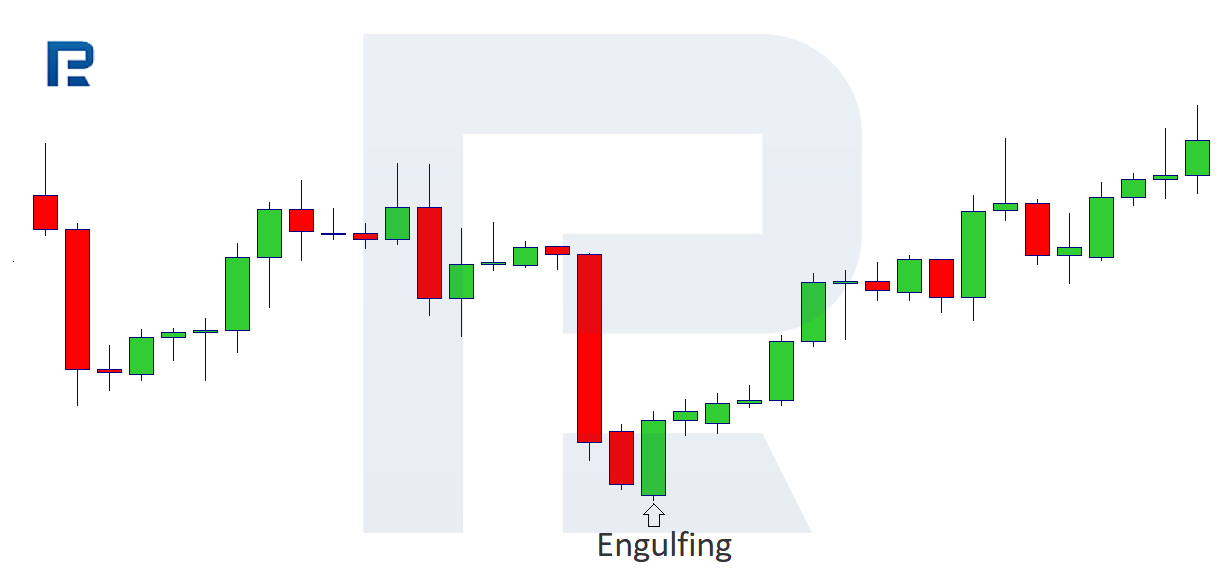
Engulfing Bullish
In the Engulfing Bullish, same as in the Engulfing Bearish, the second candlestick fully covers the previous one, only, in this case, the candlestick is growing (bullish).
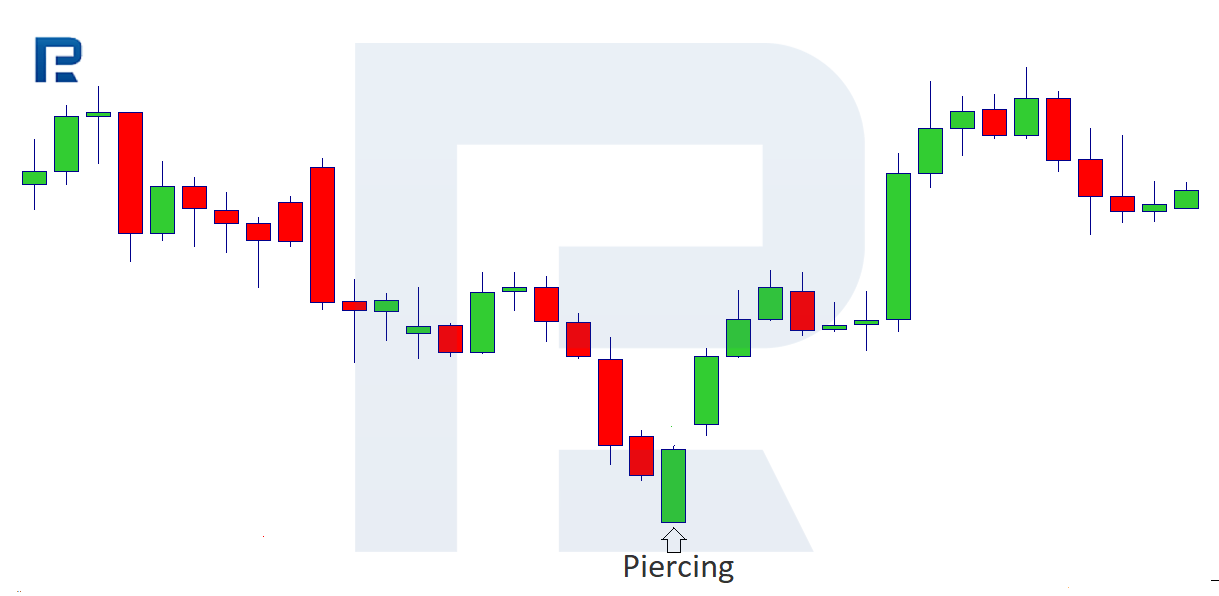
Piercing Line
A Piercing Line is a candlestick opening with a downward gap, then the gap closes with a partial engulfing of the previous candlestick. The closing of the Piercing Line candlestick must be higher than the middle of the previous candlestick. The lower shadow is lacking or very small.
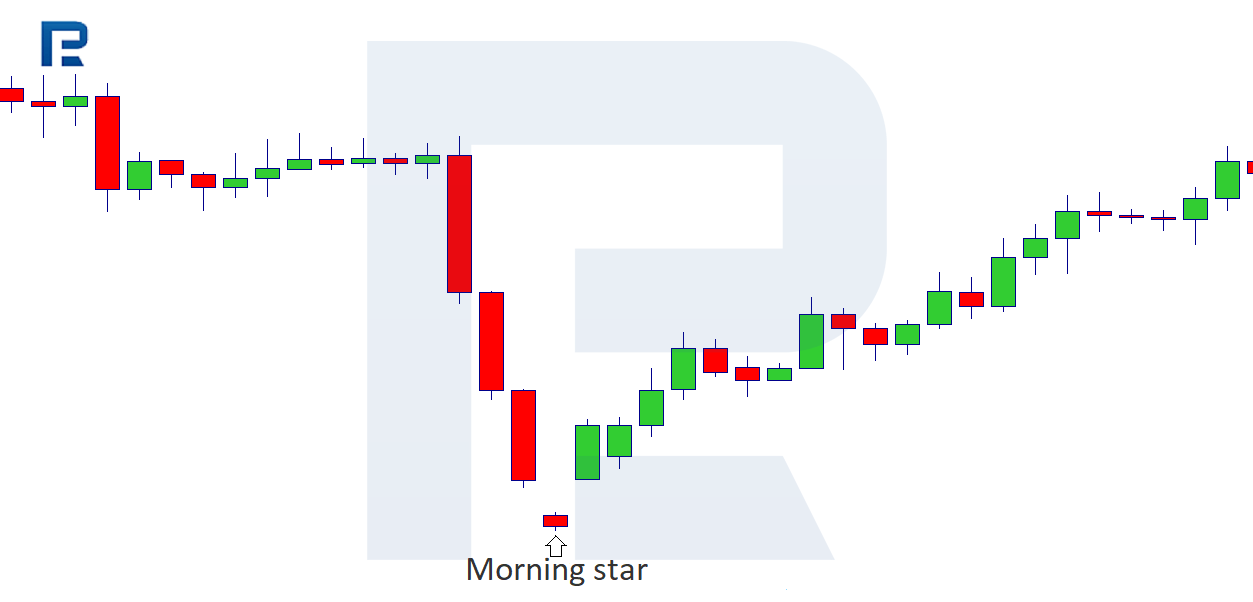
Morning Star
A Morning Star is a combination of three candlesticks: the outer candlesticks have large bodies, while the middle one has a small body and closes with a gap. The colour is irrelevant.
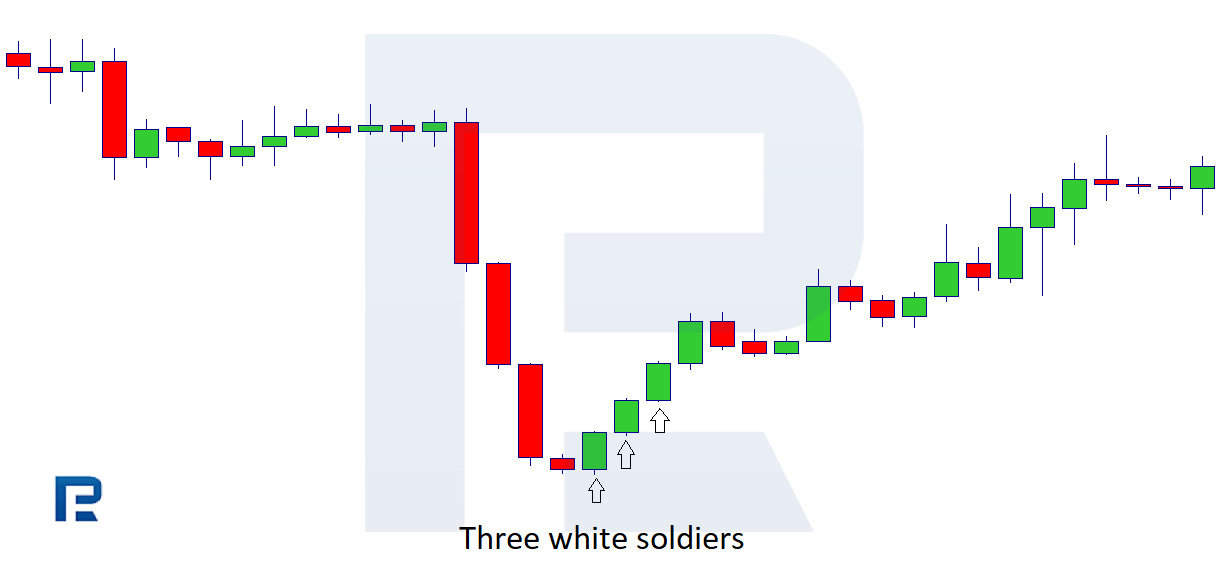
Three White Soldiers
Three White Soldiers: after a decline, three candlesticks form at the bottom of the trend one after another; they have large bodies going counter the main trend (ascending candlesticks).
Let us now have a look at the trend continuation candlestick patterns.
Candlestick patterns of trend continuation
Usually, these combinations, composed of several candlesticks, form a correction of the current trend.
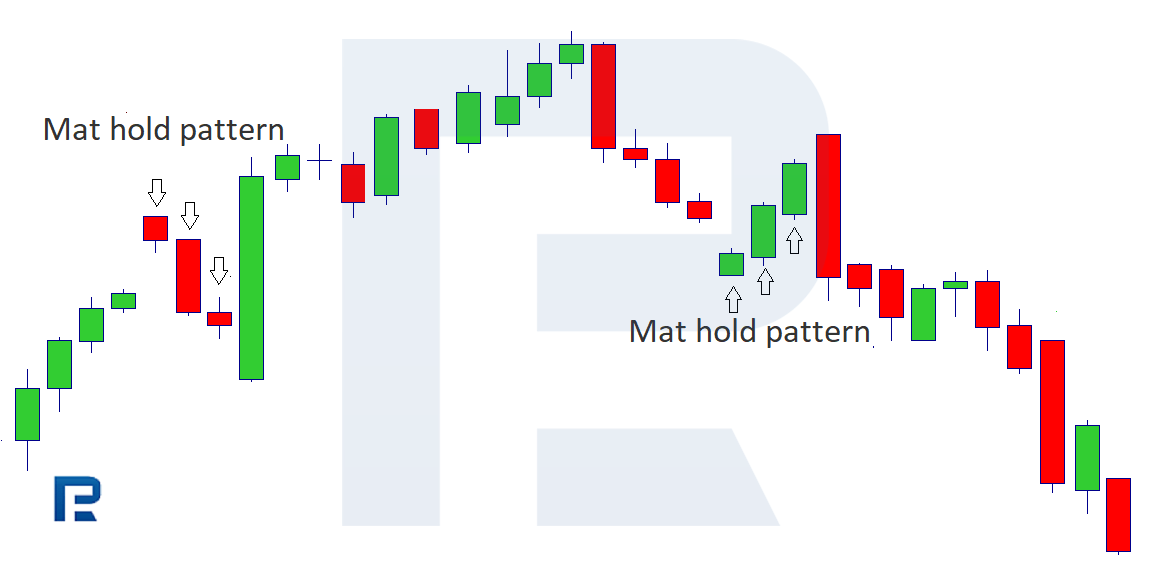
Mat Hold
A Mat Hold is a correction of three candlesticks; the first one opens with a gap, the two remaining candlesticks cover the gap completely. The fourth candlestick engulfs the previous ones and closes at a new maximum/minimum. As a rule, this combination emerges in the middle of the trend and in certain cases gives a false signal of a reversal.
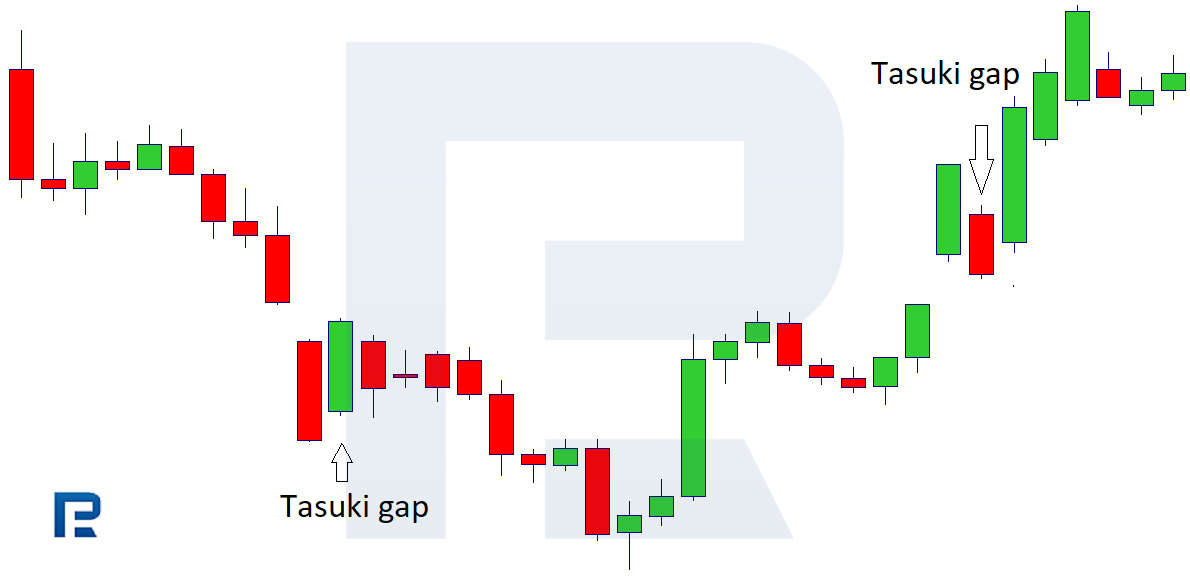
Tasuki Gap
Tasuki Gap pattern: after a gap formed, the price makes a small correction of candlesticks of the other colour and partly covers up the gap. Then the current trend continues.
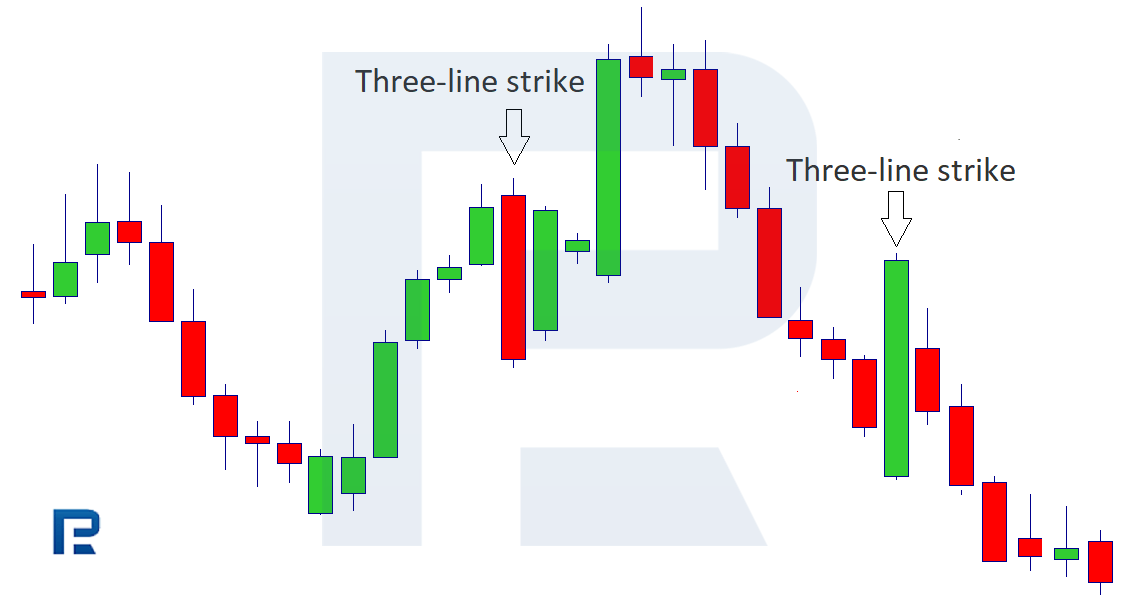
Three-line Strike
A Three-line Strike is a combination of several candlesticks. After a long-term directed movement, the price makes a pullback of one large candlestick, its body engulfing three previous candlesticks completely.
Now to the candlestick patterns, which name does not change regardless of the place of formation.
Candlestick patterns at the bottom and at the top with the same name
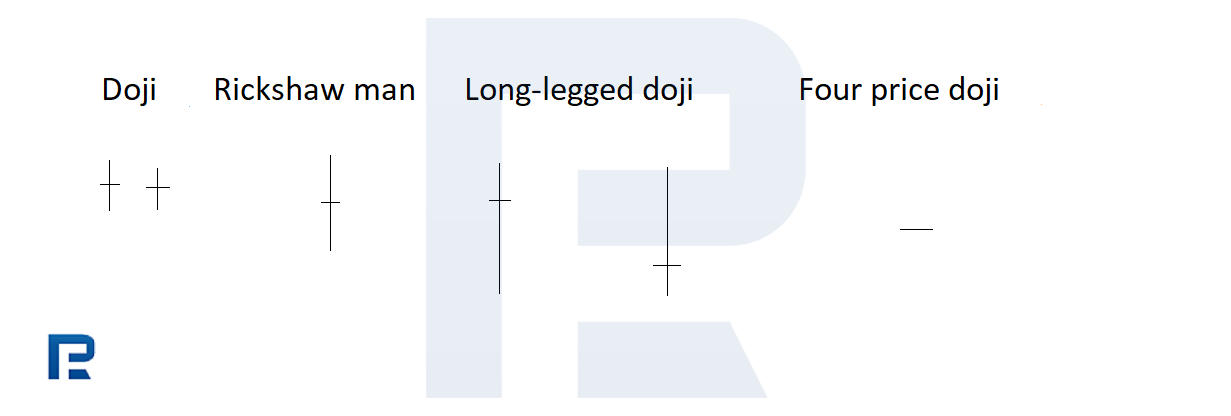
Doji, Rickshaw Man, Long-legged Doji, Four Price Doji are all Doji types with certain peculiarities. The Doji pattern has no body, its closing and opening prices coinciding; the name changes depending on the shadows, though the essence remains the same. The Doji is a quite strong reversal pattern.
Doji
The Doji pattern has small shadows.
Rickshaw Man
The Rickshaw Man pattern has long shadows with a body in the middle (symmetrically situated).
Long-legged Doji
The Long-legged Doji candlestick has long shadows and a body situated closer (not symmetrically) either to the maximum or the minimum.
Four Price Doji
The Four Price Doji candlestick has its opening, closing, maximal and minimal prices gathered at one point.
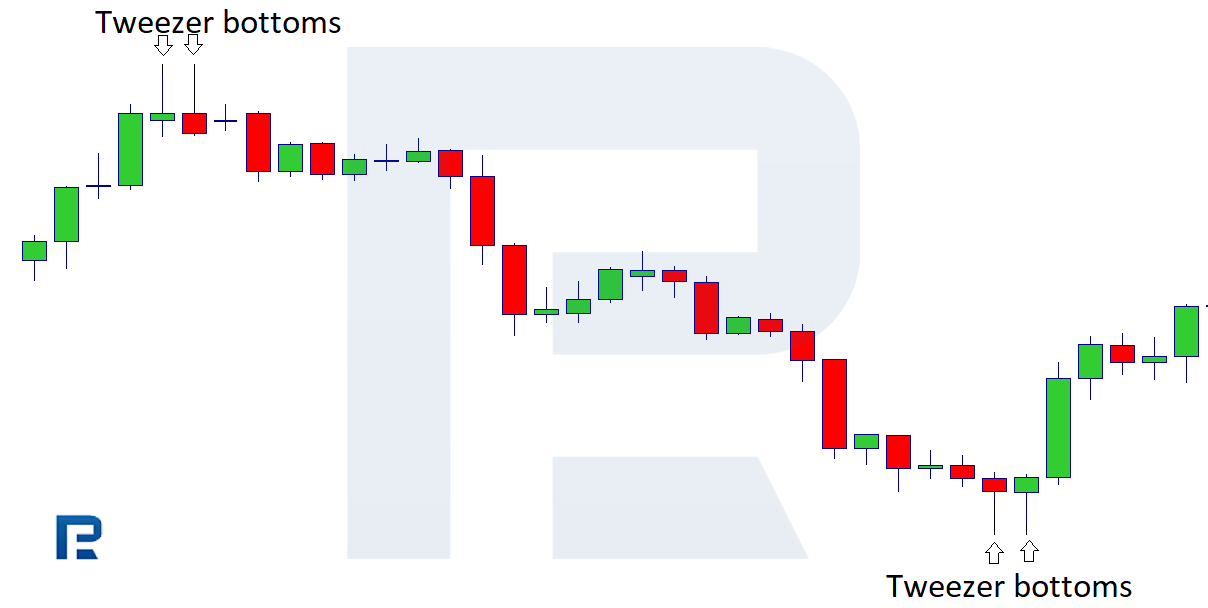
Tweezers
The Tweezers pattern are two candlesticks with roughly the same body size and very long shadows, coinciding in their maximal or minimal values (depending on the place of their formation). The bodies of the candlesticks have different colors.
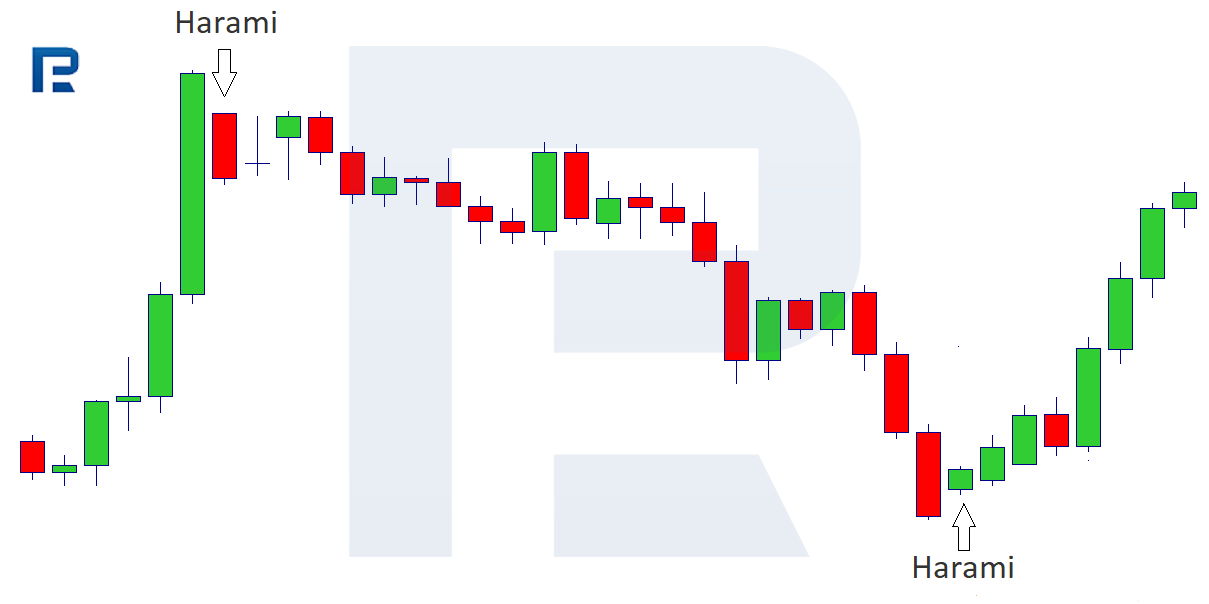
Harami
A Harami is when the body of the candlestick fully hides inside the previous one, including the shadows. The bigger the difference between the bodies of the candlesticks, the stronger the signal of a reversal is. The Harami Cross pattern is similar to the simple Harami, only instead of a usual small candlestick, there is a Doji.
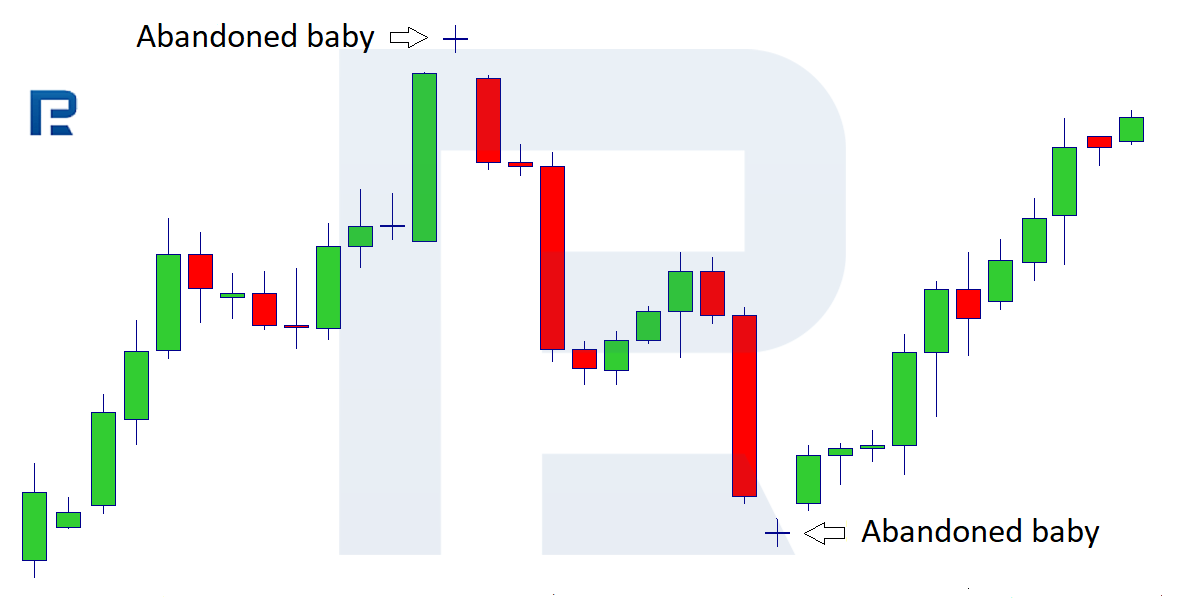
Abandoned Baby
An Abandoned Baby is a Doji formed with a gap. The pattern will be stronger if the first candlestick before the Doji is growing while the next candlestick after the Doji is falling (vice versa in a downtrend).
Summary
It is rather hard to discuss all candlestick combinations in one article. Candlestick market analysis has been in use for a long time, and market players, watching the charts, have made a lot of their own conclusions that may not, perhaps, be in line with those of the candlestick analysis pioneers. Development should have no limits. At first glance, candlestick analysis may seem difficult, however, it may become a strong trading instrument as soon as you master it.