Tech Analysis Patterns: How to Trade Rectangles

4 minutes for reading
In this overview, we will discuss trading the Rectangle pattern. This is a universal tech analysis pattern that may be traded both individually and as a part of other patterns.
How does a Rectangle form?
A Rectangle looks like a sideways channel, limited by the horizontal support and resistance levels, where the price consolidates. The Rectangle is considered fully formed only after the price breaks away one of its borders. The goal of working off this pattern is a movement of the price in the direction of the breakaway for the height of the Rectangle.
Though the Rectangle is considered universal, some traders only trade it as a trend continuation pattern. This is because a relatively small Rectangle may often be a part of another TA pattern – the Flag, which is, indeed, a trend continuation pattern.
In this case, the formation of the Rectangle is preceded by a strong ascending or descending impulse. It stops, reaching a strong support/resistance level, after which the price consolidates in a small horizontal range – a Rectangle forms. The most probable development of the situation is a breakaway of the Rectangle in the direction of the previous impulse and the continuation of the trend.
Conversely, if the Rectangle is rather large, it is hardly connected to the previous price impulse and acts as an independent price pattern. In essence, this is a price movement in a sideways channel (flat), having clear upper and lower borders. In this case, the Rectangle becomes universal and may be traded either way in the direction of the breakaway.
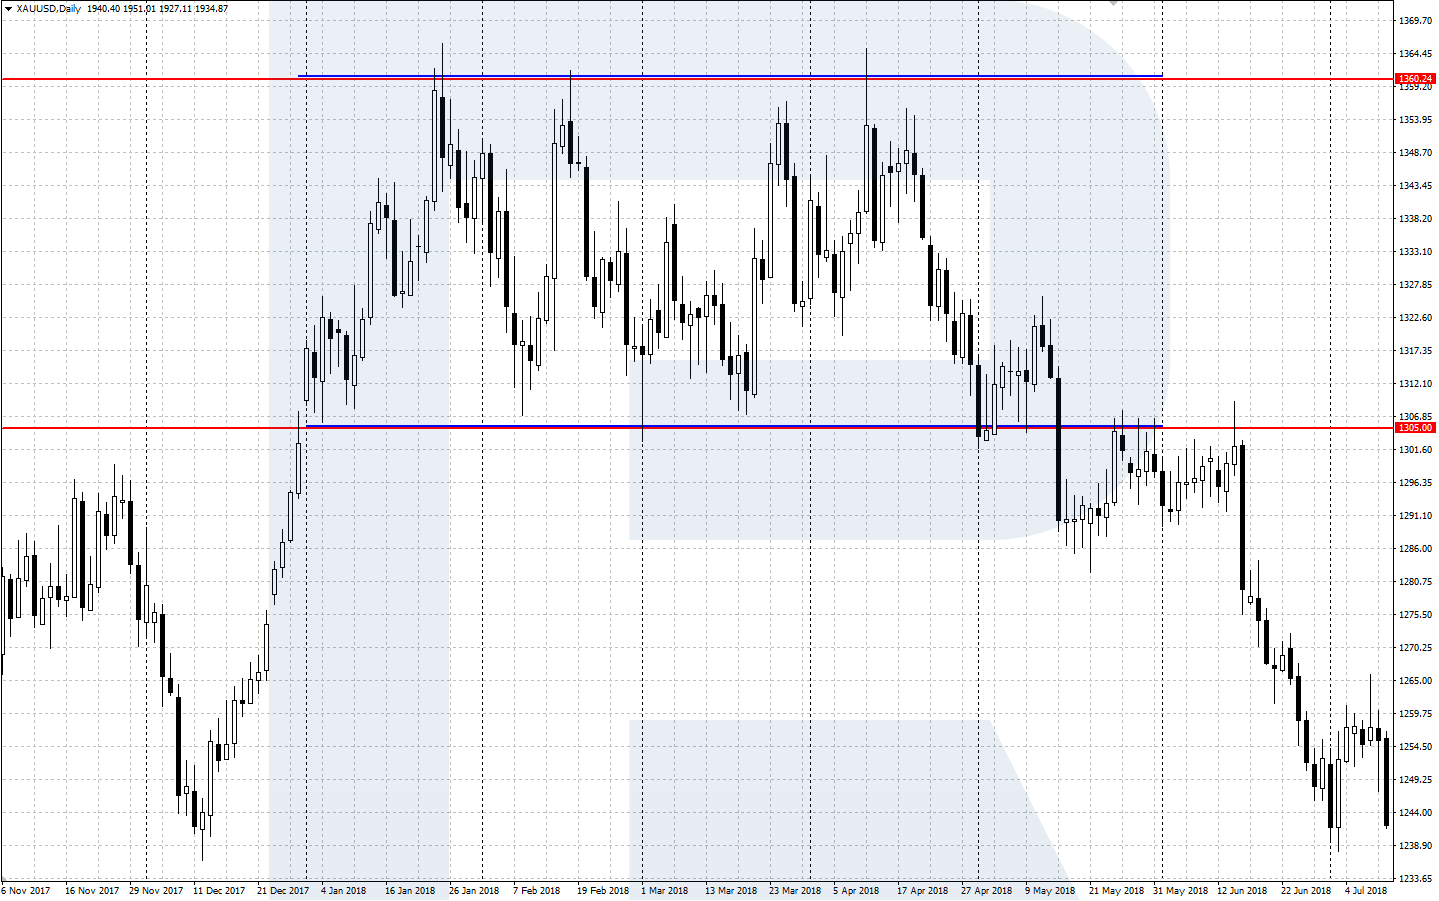
Do we trade inside the Rectangle?
There are different views upon trading inside the Rectangle. For example, famous traders Alexander Elder and John J. Murphy consider trading inside the Rectangle to be perfectly normal, while Jack D. Schwager advises against it.
I suppose every pattern should be approached individually. If we see a rather small Rectangle after a strong impulse – better wait for a breakaway in the direction of the trend. Conversely, if the pattern looks like a large price range, you may easily trade bounces off its borders as you do in normal flats.
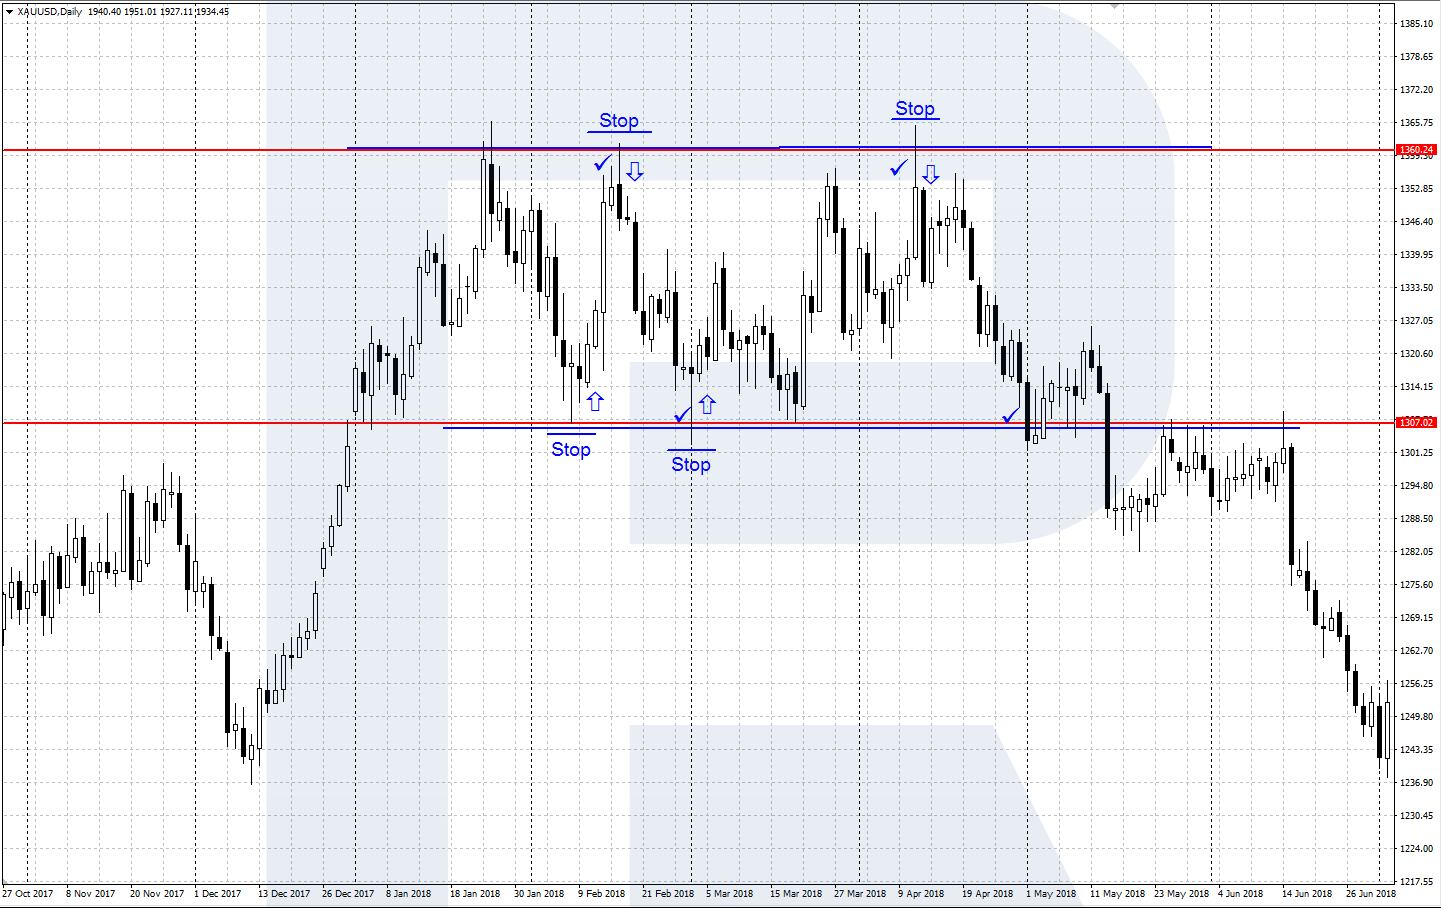
Trading bounces off the borders of the Rectangle goes as follows:
- Open a selling trade when the price bounces off the upper border of the Rectangle. Place a Stop Loss above the upper border of the pattern, slightly above the last local high. Take the profit when the price approaches the lower border of the Rectangle;
- Place a buying order when the price bounces off the lower border of the Rectangle. Place a Stop Loss under the lower border of the pattern, slightly below the last local low. Take the profit when the price reaches the upper border of the Rectangle.


Trading breakaways of the Rectangle
However, the main way of trading a complete Rectangle is trading breakaways of its borders.
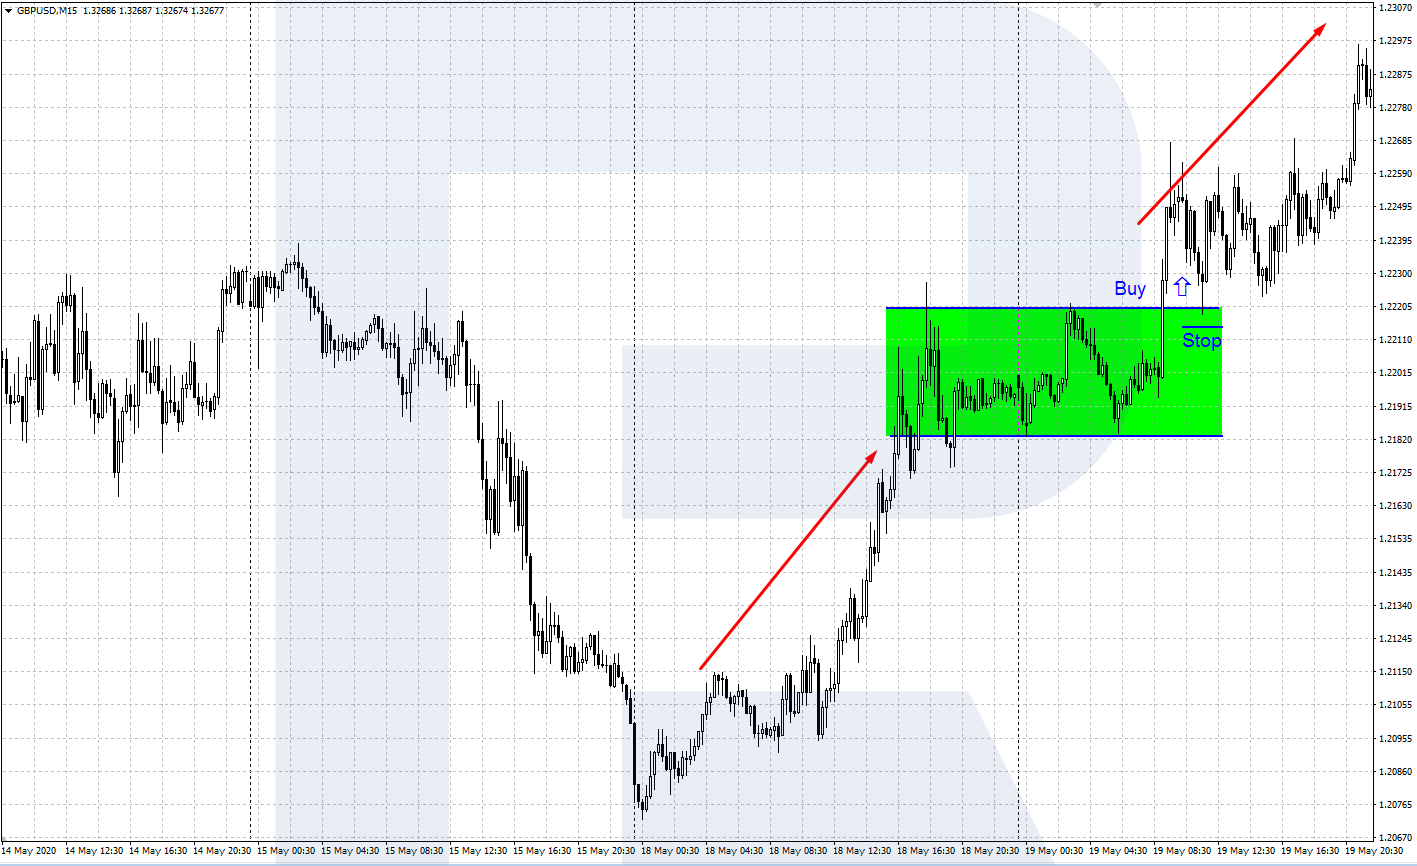
A breakaway of the upper border
- There is a complete Rectangle pattern on the chart. A preceding upward impulse enhances the pattern;
- The price breaks away the upper border – the candlestick closes above it fully or by its bigger part;
- Open a buying position right at the breakaway or after the price pulls back to the upper border;
- Place an SL under the upper border of the channel;
- The main mark for taking the profit is the height (H) of the pattern. Alternatively, close the position when the price reaches a strong resistance level, or some bright signs of a reversal downwards appear.
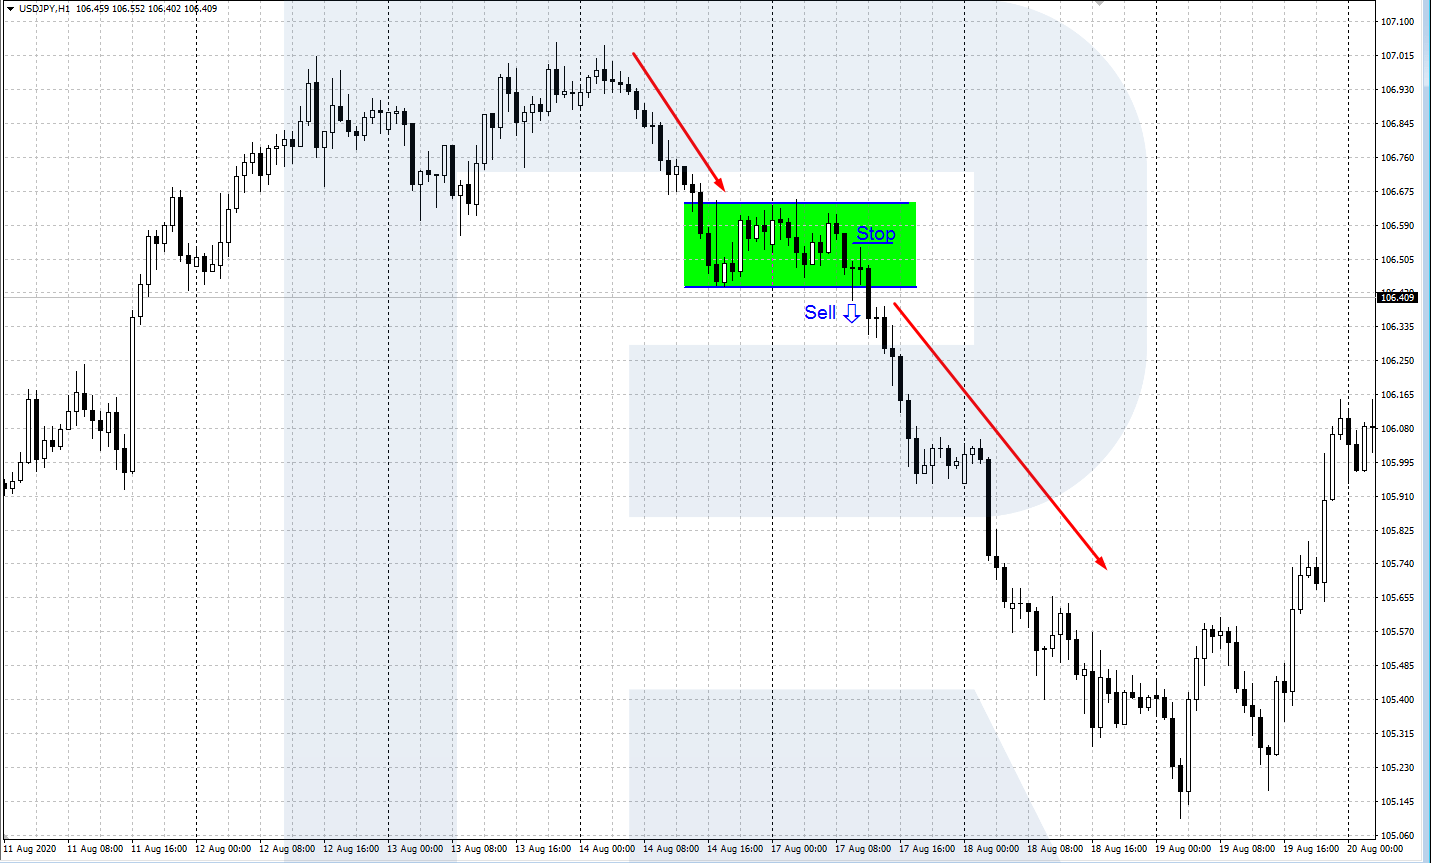
A breakaway of the lower border
- There is a complete Rectangle pattern on the chart. A preceding downward impulse enhances the pattern;
- The price breaks away the lower border – the candlestick closes above it fully or by its bigger part;
- Open a selling position right at the breakaway or after the price pulls back to the lower border;
- Place an SL behind the lower border of the channel;
- The main mark for taking the profit is the height (H) of the pattern. Alternatively, close the position when the price reaches a strong support level, or some bright signs of a reversal upwards appear.
Summary
The Rectangle is a classical universal TA pattern, quite easy to detect on the price chart. It may not only be an independent pattern but also be a part of a bigger trend continuation pattern Flag. Anyway, the right use of the Rectangle in trading may bring the trader some extra profit.