The Flag and Pennant Patterns: Trading Details

4 minutes for reading
Description of the Pennant and Flag: peculiarities of the patterns
The Flag and Pennant patterns appear rather frequently on price charts. They are trend continuation patterns, working in the presence of a strong trend, same as trend reversal patterns. When such patterns appear, we may forecast that the trend will continue. If a Flag or a Pennant forms in an uptrend, this means that the bulls are controlling the market, and after a small descending correction, which the patterns form in, the quotations might go on growing. If a Flag or a Pennant forms in a downtrend, this means that the bears are still strong, and after an upward correction, which the patterns might form in, the price is likely to go on declining.
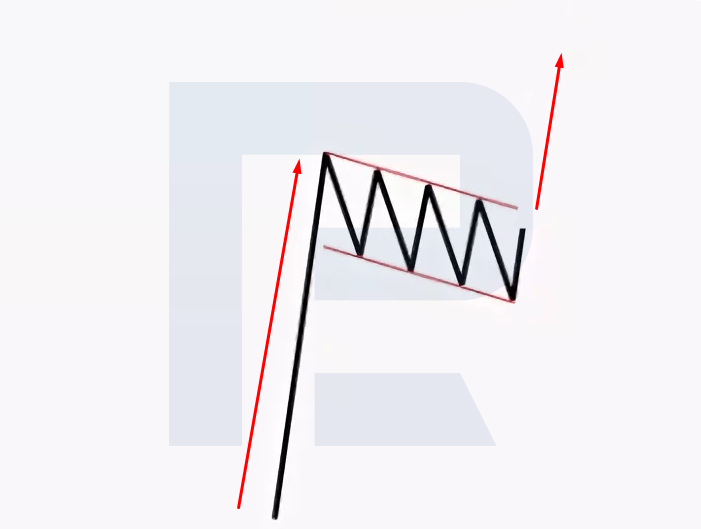
Flag pattern
It appears after a strong price impulse along with the existing trend. First goes the price impulse, called flagpole. Next, a rectangular correction area forms, limited by the parallel lines of support and resistance — this is the cloth of the Flag. An important detail here: the cloth should be inclined against the previous impulse (the flagpole) or might be horizontally-oriented.
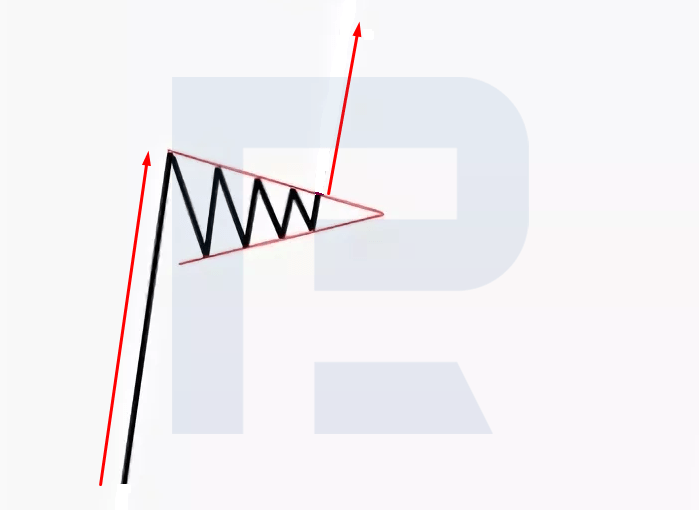
Pennant pattern
Same as the Flag, the pattern emerges after a strong price impulse, which is called pole. Then, the correction area forms, looking like a small converging Triangle or a Wedge (in more detail these patterns are described in the article “Triangle And Wedge Patterns in Technical Analysis”. An important detail again: if the Pennant is formed by a converging Triangle, it may be of any kind (symmetrical, ascending, descending), while if it is formed by a Wedge, it must be inclined against the impulse (the pole).
Trading Flags
The Flag is a trend continuation pattern, so after it is formed, trading the trend becomes the only option.
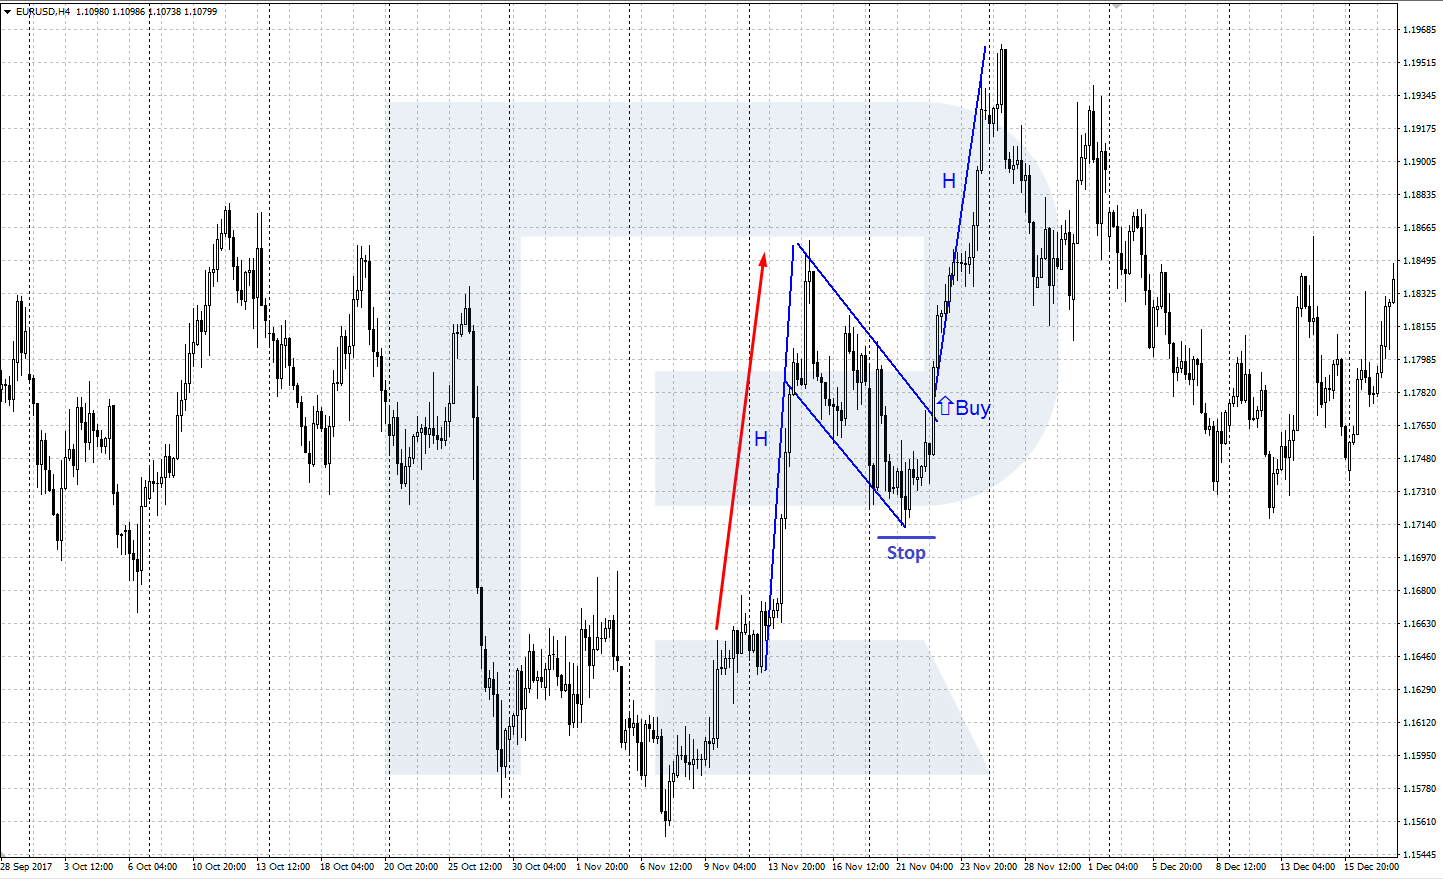
Flag in an uptrend
A Flag formed in an uptrend is called bullish. After the appearance of an ascending impulse (the flagpole), we should wait for the cloth to form and to be broken away upwards. The criterion for the breakaway is a whole candlestick or the biggest part of a candlestick closing above the resistance line of the Flag. Buying is recommended either on the very breakaway or after a pullback to the upper border of the Flag. A Stop Loss is placed behind the closest minimum of the Flag, while the Take Profit is the size of the flagpole H (in points).
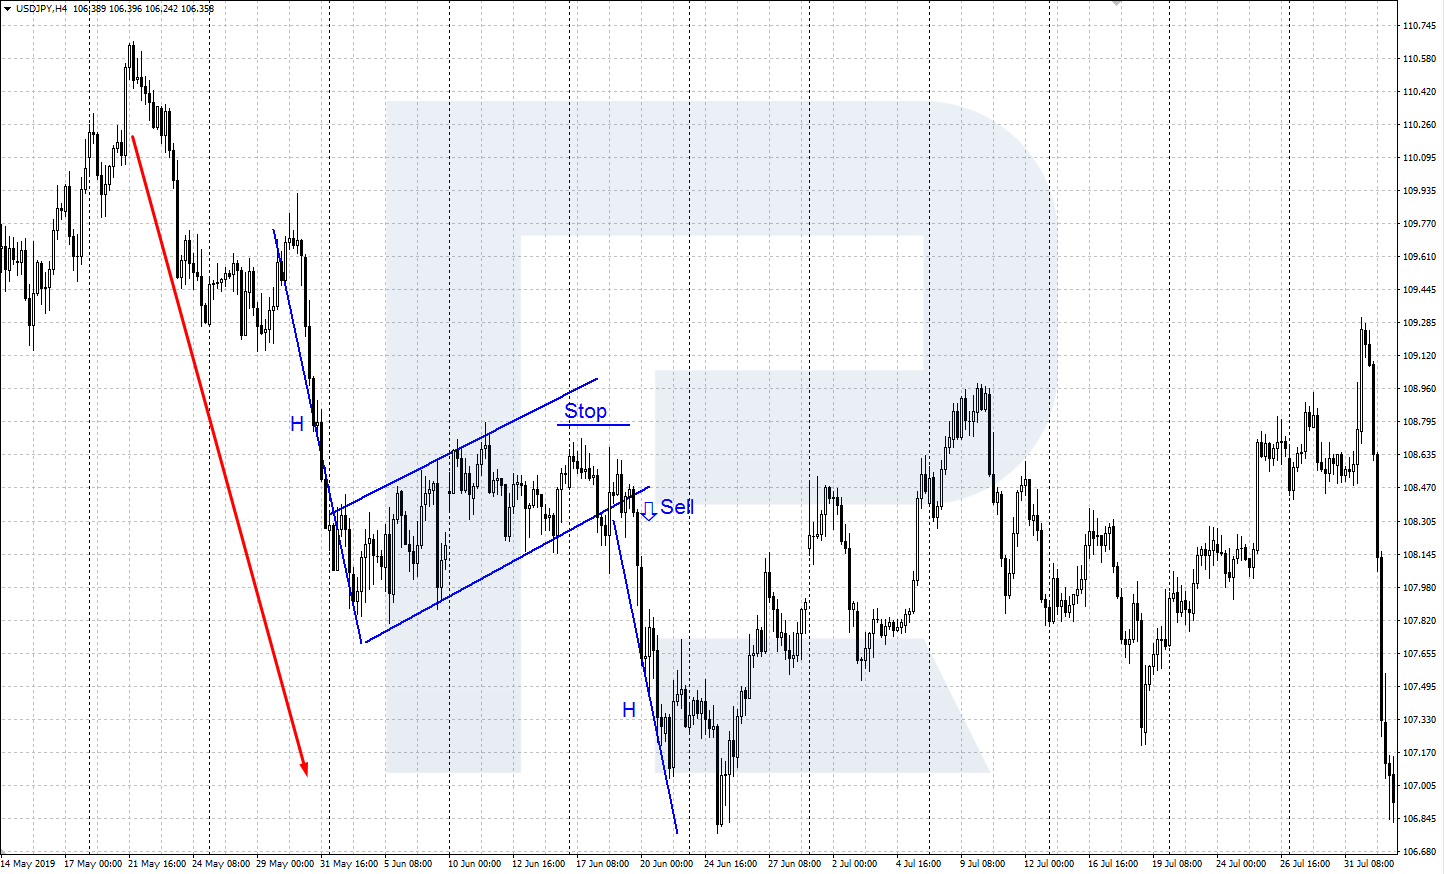
Flag in a downtrend
A Flag emerging in a downtrend is called bearish. After a descending impulse that constitutes the flagpole, we wait for the cloth to form and to be broken away downwards. The criterion for the breakaway will be a whole candlestick or the biggest part of a candlestick closing below the support line of the cloth. Selling is recommended either right at the breakaway or after a pullback to the lower border of the Flag. A Stop Loss is placed behind the closest maximum of the Flag, the profit is expected at the size of the flagpole H (in points).
Trading Pennants
The Pennant, same as the Flag, is a trend continuation pattern, so trading should be in the trend only.
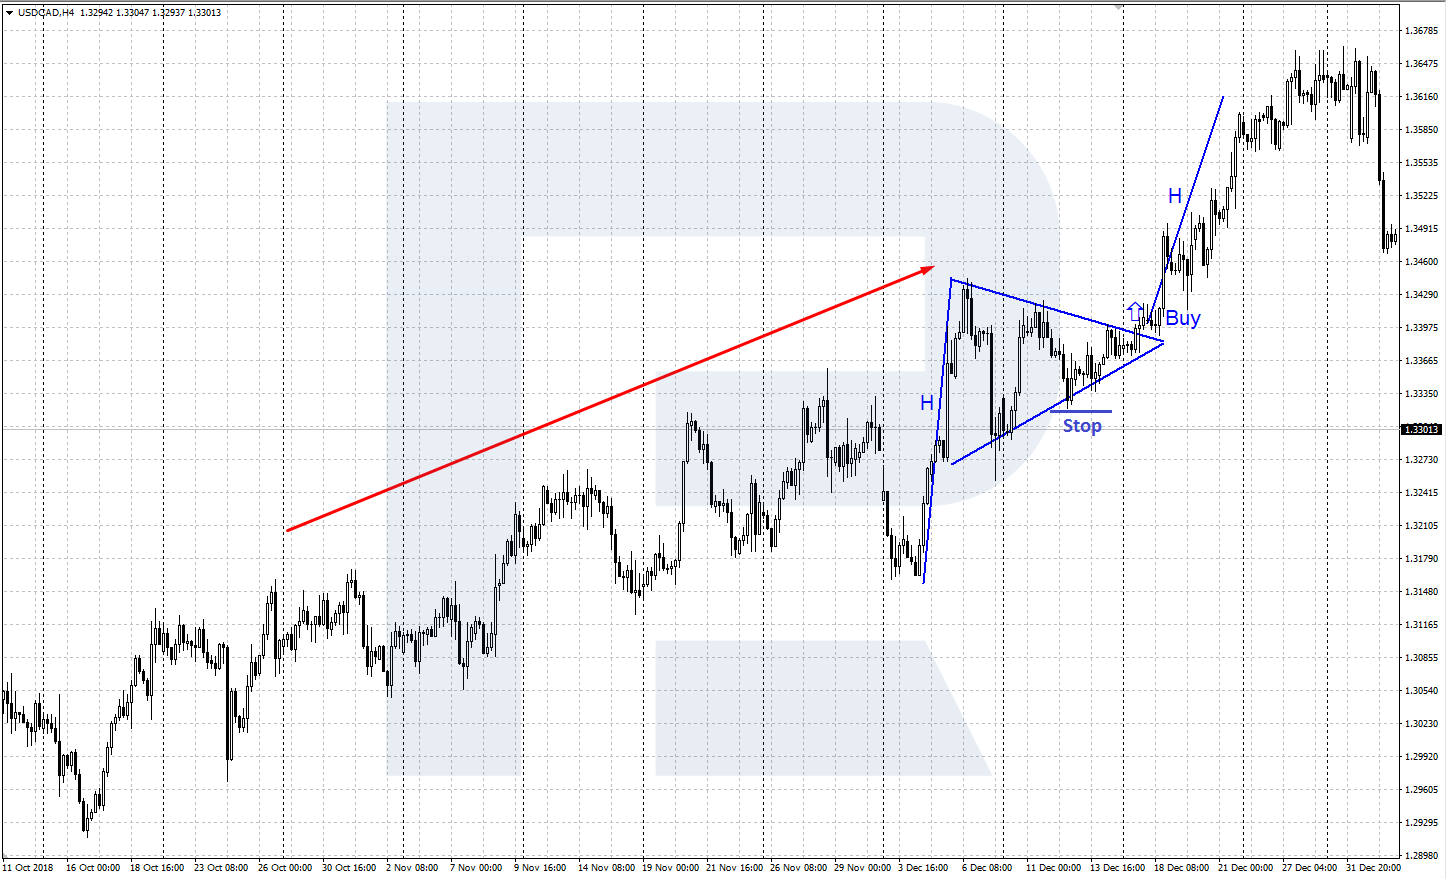
Pennant in an uptrend
A Pennant formed in an uptrend is called bullish. It gives a signal to buy after its upper border (the resistance line) is broken away. Buying is recommended either right at the breakaway if, for example, it is a strong movement upon publication of some news; or at a pullback to the broken resistance line. An SL is placed below the nearest minimum of the Pennant, a TP is estimated as the height of the pole H.
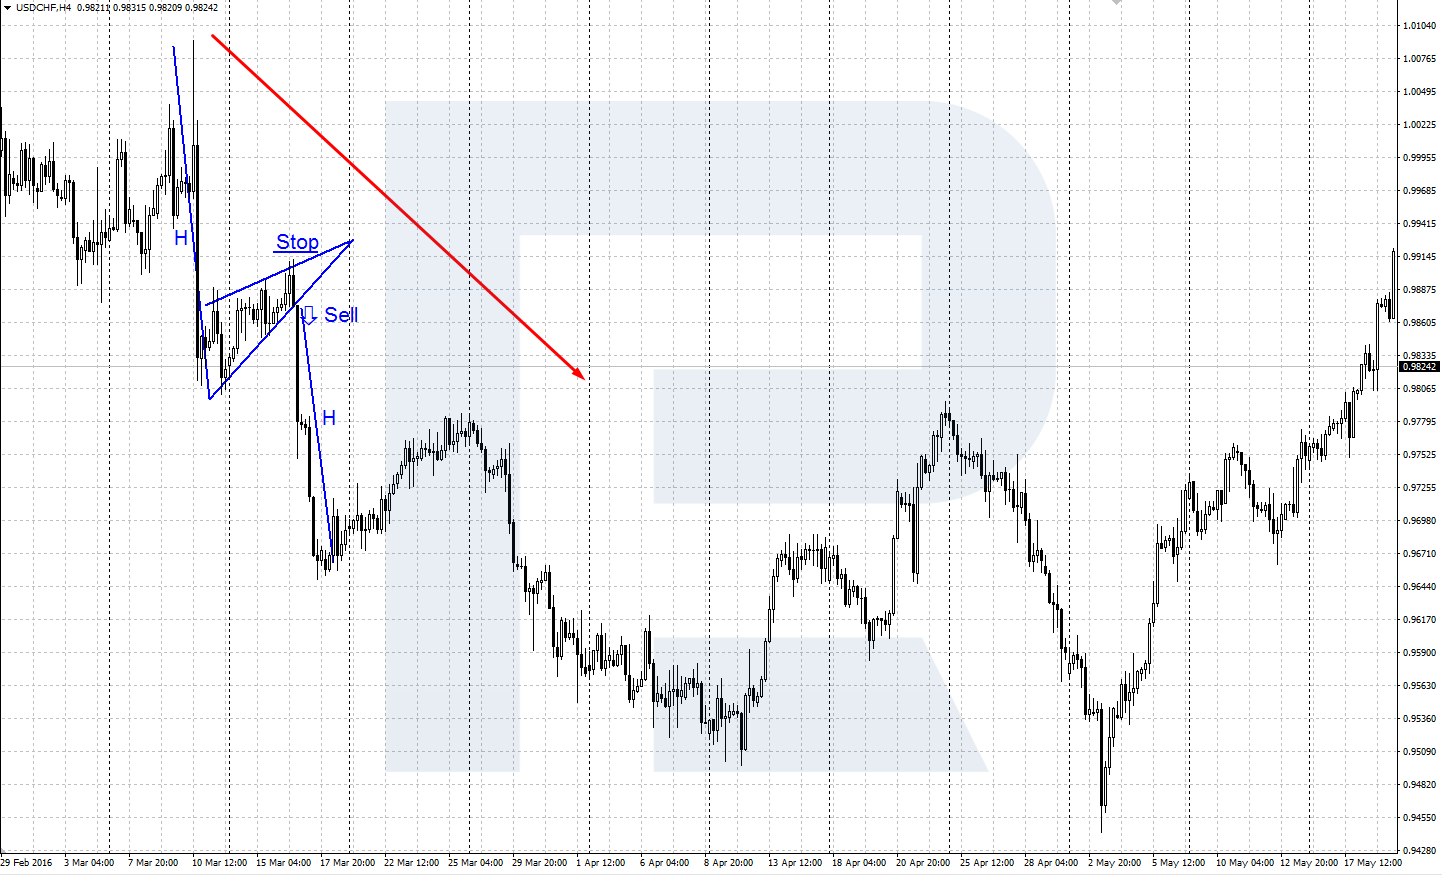
Pennant in a downtrend
A Pennant formed in a downtrend is called bearish. It signals selling after the lower border (the support level) is broken away. Selling is recommended either right at the breakaway, if it is, for example, a strong movement upon publication of certain news, or after a pullback to the broken support line. An SL is placed below the closest maximum of the Pennant, while a TP is estimated as the height of the pole H.
Summary
The Flag and Pennant patterns are two of the most popular trend continuation patterns among traders. They give a clear signal along with the current trend and most often provide an entry to a trade with a good stop to profit ratio of 1:2 or 1:3. The profit from the execution of these patterns is estimated as the size of the price impulse (the pole) H, but the important support/resistance levels are also to be taken into account. It is better to lock in a slightly smaller profit, approaching a strong level, then to lose everything if the price turns against the open position.


