Trading the Trend: Strategy Description and Peculiarities

5 minutes for reading
Almost all authors writing about technical analysis advise trading the trend as it is more promising in the long run. However, most beginner traders do not like moving in the market’s tow; on the contrary, they try to reverse the trend, as soon as their financial instruments demonstrate a maximum or a minimum. This approach is, indeed, working but on flats only; as soon a strong up- or downtrend starts, a beginner usually does not know what to do and may lose large amounts of money. Experienced traders are quite right to say that "a trend is a friend"; this is an important saying to recall when you are tempted to start selling on another maximum.
What a trend is and how to use it?
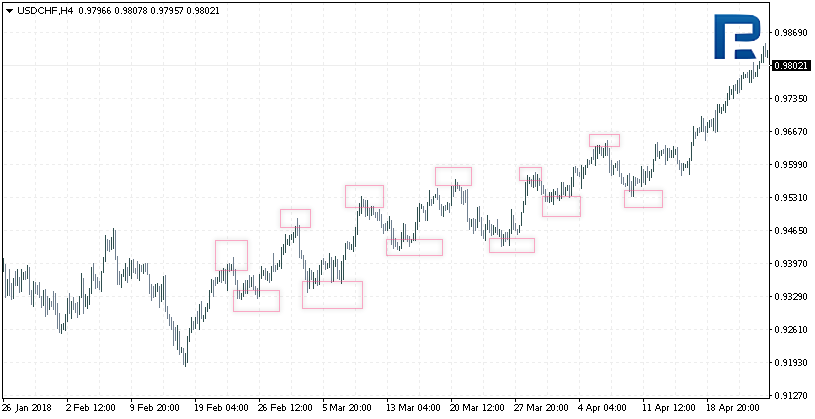
In literature, a trend is defined as a sequence of maximums and minimums. If we say that there is a bullish trend on the market, it means that every next maximum is higher than the previous one and every next minimum is also higher than the previous one. In this case only, we may presume that the trend is ascending and try buying.
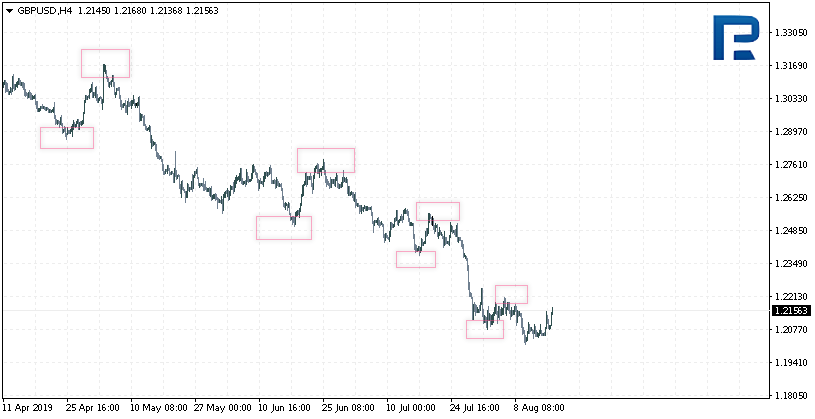
On the other hand, if we see that every next minimum is lower than the previous one and every next maximum is lower than the previous one, the trend is descending. In this case, we should look for selling signals only.
Finally, if minimums and maximums remain at roughly the same level, such a situation is called a flat. Beginners like those as they try to average their positions; if they are lucky, the market will make a pullback, and they will exit with a profit, even having suffered huge losses. Conversely, in a trend averaging rarely helps.
Peculiarities of trading the trend
Usually, experienced traders define the main trend on a longer timeframe, such as the daily one, and move on to smaller timeframes to look for the signals along with the trend. What is more, the importance of the trend and the signals along it is highlighted in the descriptions of the harmonic patterns as well. Curiously, the authors of the method initially suggested trading in any direction, regardless of the market movements. However, they later focused on looking for patterns along with the trend as they are, presumably, more likely to be executed.
Trading the trend in practice
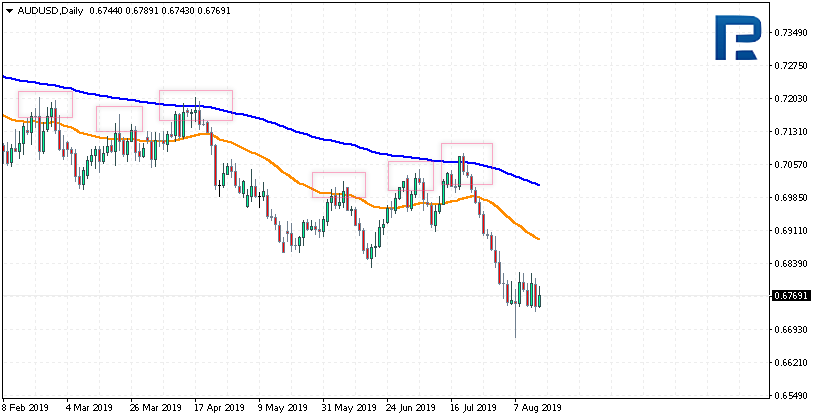
Let us take a daily timeframe of any financial instrument, adding two Moving Averages to define the trend. If the Averages are heading upwards, and the price is growing, then the trend is ascending; you should move on to smaller timeframes and look for reversal patterns of growth only. Such patterns may be the Head and Shoulders, Double Bottom, Wedge and even the Wolfe Waves, but only those that signal to buy.
To enhance the quality of signals, you may use Alexander Elder’s idea: he suggests looking for a buy when the price enters the area between the two Moving Averages. The financial risk in this area is very low because the trader is trying to enter the market at the moment of a correction coming to an end but not at the very top where the risk that the price will drop is very high.
For example, on the 1D timeframe of AUD/USD, we could see several such tests of the area between the Moving Averages, after which the prices bounced off and moved on downwards. Those were not just bounces but the continuation of the current trend with a strong decline.
Strategies for trading the trend
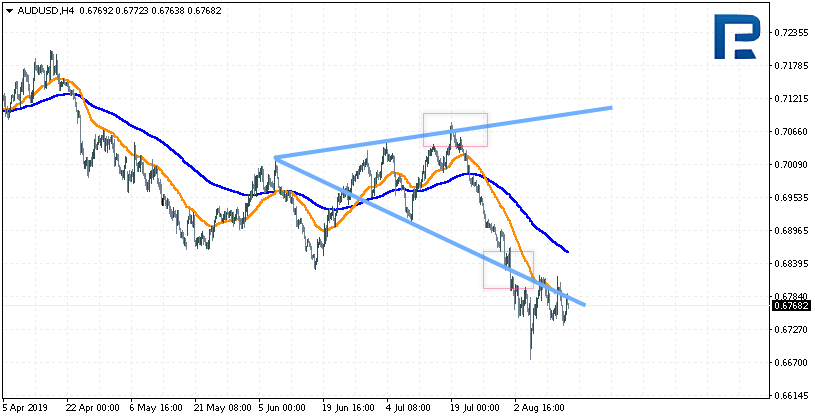
Such strategies are numerous. The main task of the trader who is willing to trade the trend is to define that very trend. And the simplest instrument for this is the Moving Averages; adding them, it becomes quite easy to see where the market is moving. In the example with the AUD/USD pair at the moment of the last growth there formed a Bearish Wolfe Wave on H4 that sent the price down again.
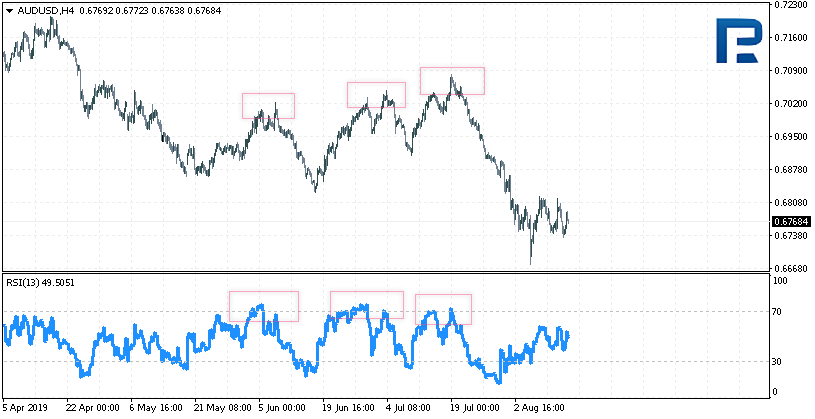
If the trader does not trust graphic patterns, any oscillator may be used, such as the RSI, the Stochastic Oscillator or the super-popular MACD.
If we add the RSI instead of graphic patterns, we will be looking for tests of the level 70; only in such moments, we can try to sell. Signals to buy, forming below 30, are to be ignored. As we can see, the last three signals executed.
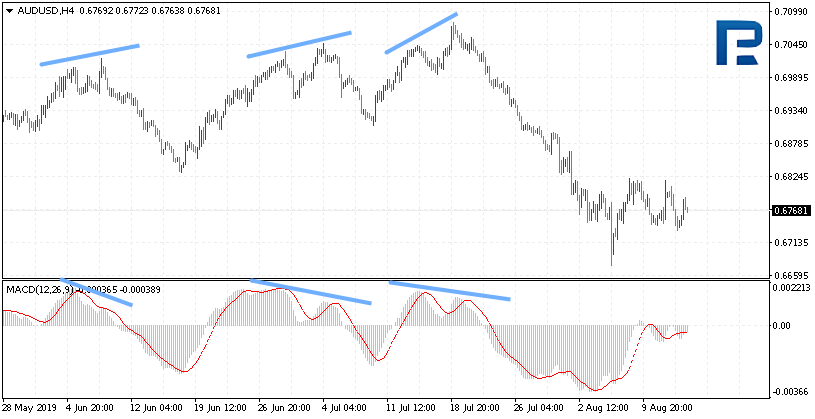
Similar signals can be searched for on the MACD indicator; here, it is important to wait for the strongest signal called Divergence along with the main trend. The Moving Averages on the daily timeframe are descending, so on H4 or H1, we are looking for signals to sell only. The market should be entered when the signal line escapes the histogram, and a Stop Loss placed above the last maximum.
Summary
The strategy of trading the trend is one of the most profitable and exciting ones in the long run if the trader is able to hold the positions as long as possible, which requires psychological readiness. Of course, there are drawbacks: such signals from the daily timeframe will form seldom, and you will have to combine several timeframes for a better search of signals and ideas along with the main trend. Beginner traders are not prepared to follow the market, they try to reverse the current trend; sometimes they succeed, but we should not forget that a trend is our friend, and trading the trend is better. However, it is not that important to catch the beginning of the movement; you can enter in the middle; and if you have some doubts, you better stay out of the market. As Bill Wolfe said in his book about the Wolfe Waves, a suitable situation will definitely emerge, you just have to wait for it and avoid wasting your time on obscure positions.