Basics of Technical Analysis for Successful Forex Trading

10 minutes for reading
To succeed in market trading you should learn how to analyze and build forecasts for the price movements. The market price is influenced by a whole range of various factors, all of which we literally cannot know. A question emerges: in this case, how does forecasting become possible? This question is answered by one of the basic and most necessary types of market analysis — technical analysis.
What is technical analysis?
Technical analysis is a method of forecasting price changes by analyzing price charts of the previous timeframe. A tech analysis is about analysis of price charts. In order to continue the story about the basics of technical analysis, you must first get acquainted with the main chart types.
Main chart types
All changes of the price are reflected on charts, which are of several types:
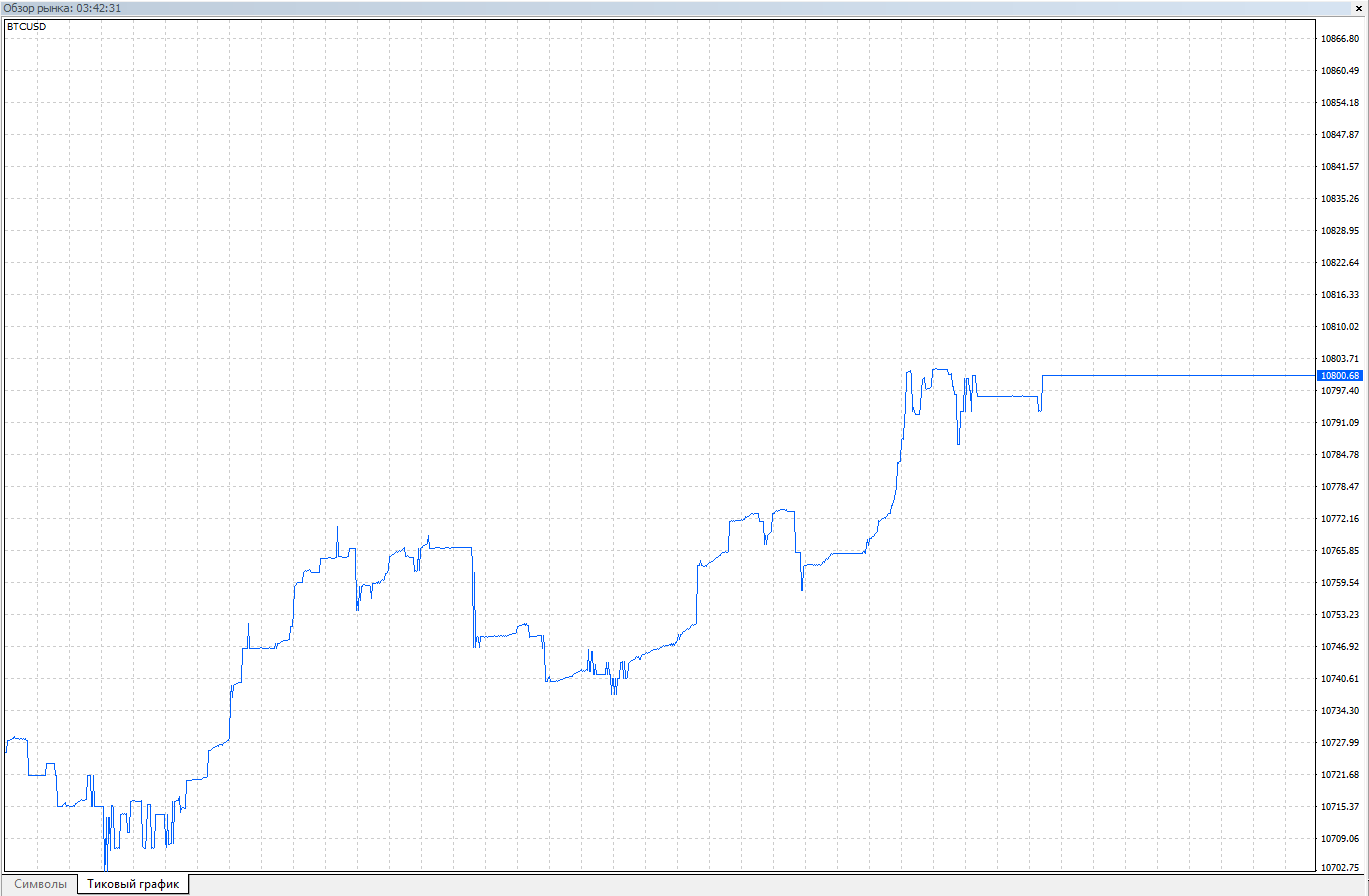
Tick chart
Tick chart reflects every change of the market price on the chart and is not bound to timeframes. As long as there are plenty of trades on the market, there take place plenty of price changes just in a minute. The chart is too chaotic for analyzing, often used by scalpers for day trading.
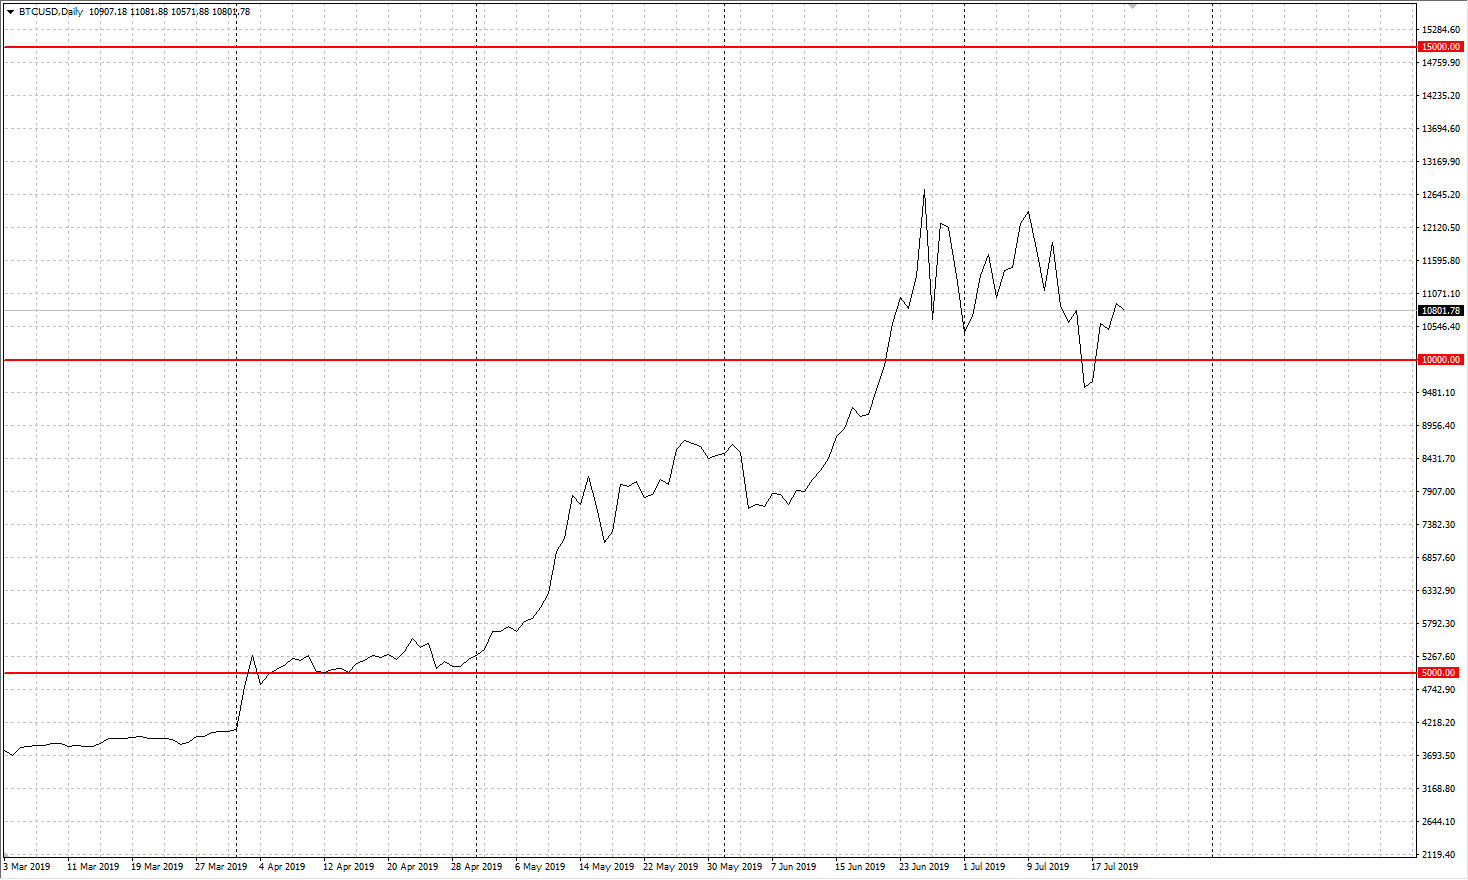
Line chart
Line chart is the simplest of charts, most often drawn on closing prices of each timeframe. Looks like a solid angledline. Practically reflects the result of the competition between bulls and bears on each timeframe. Shows the general direction of price movements.
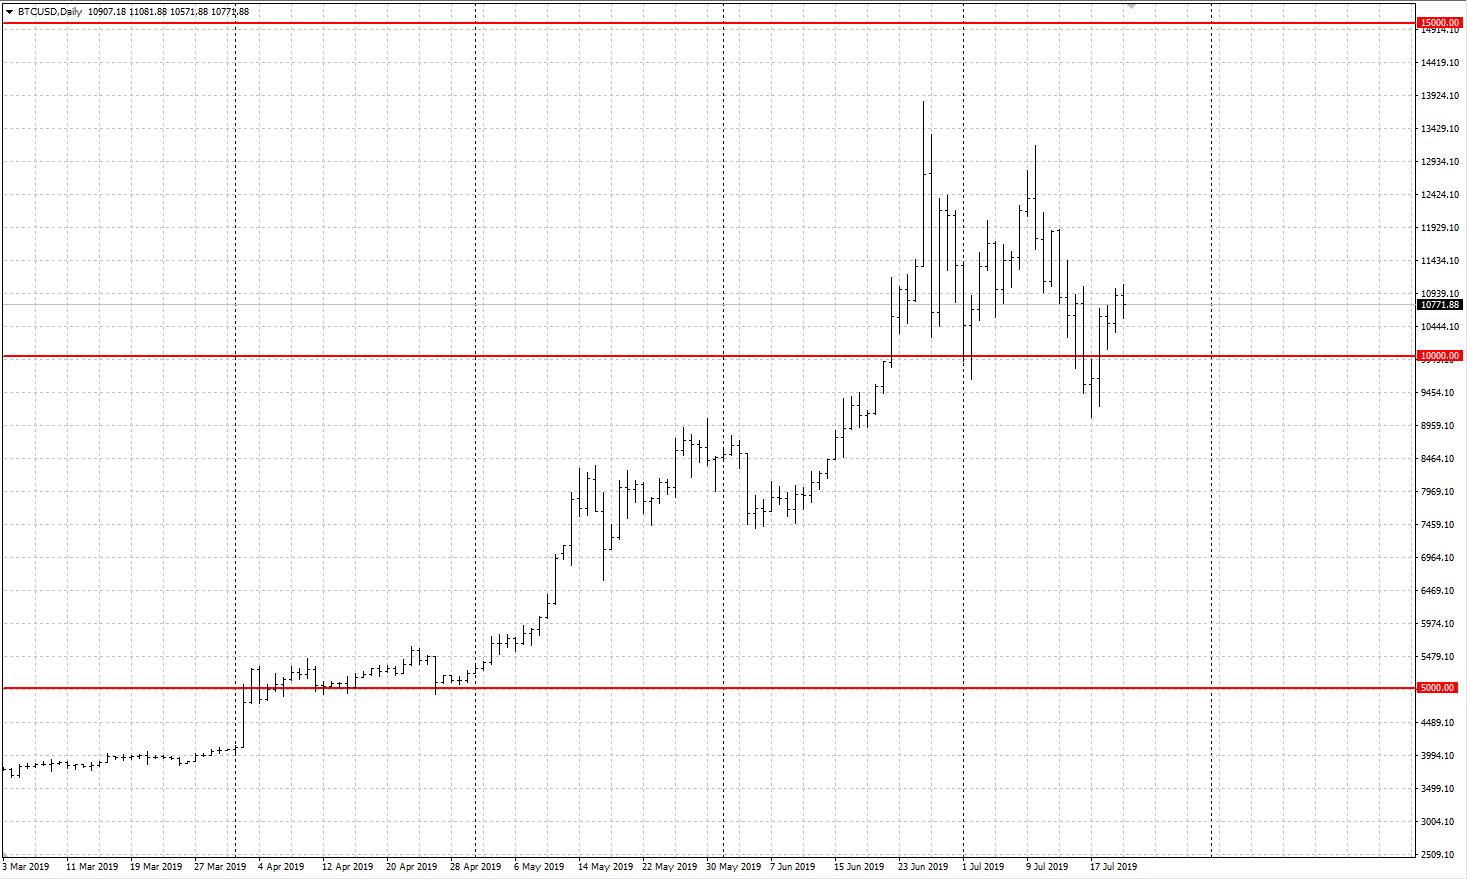
Bar chart
Bar chart reflects the price changes in a compact way, each period looking as a bar showing the opening and closing price, the maximum and minimum. This information is enough to work with such chart.
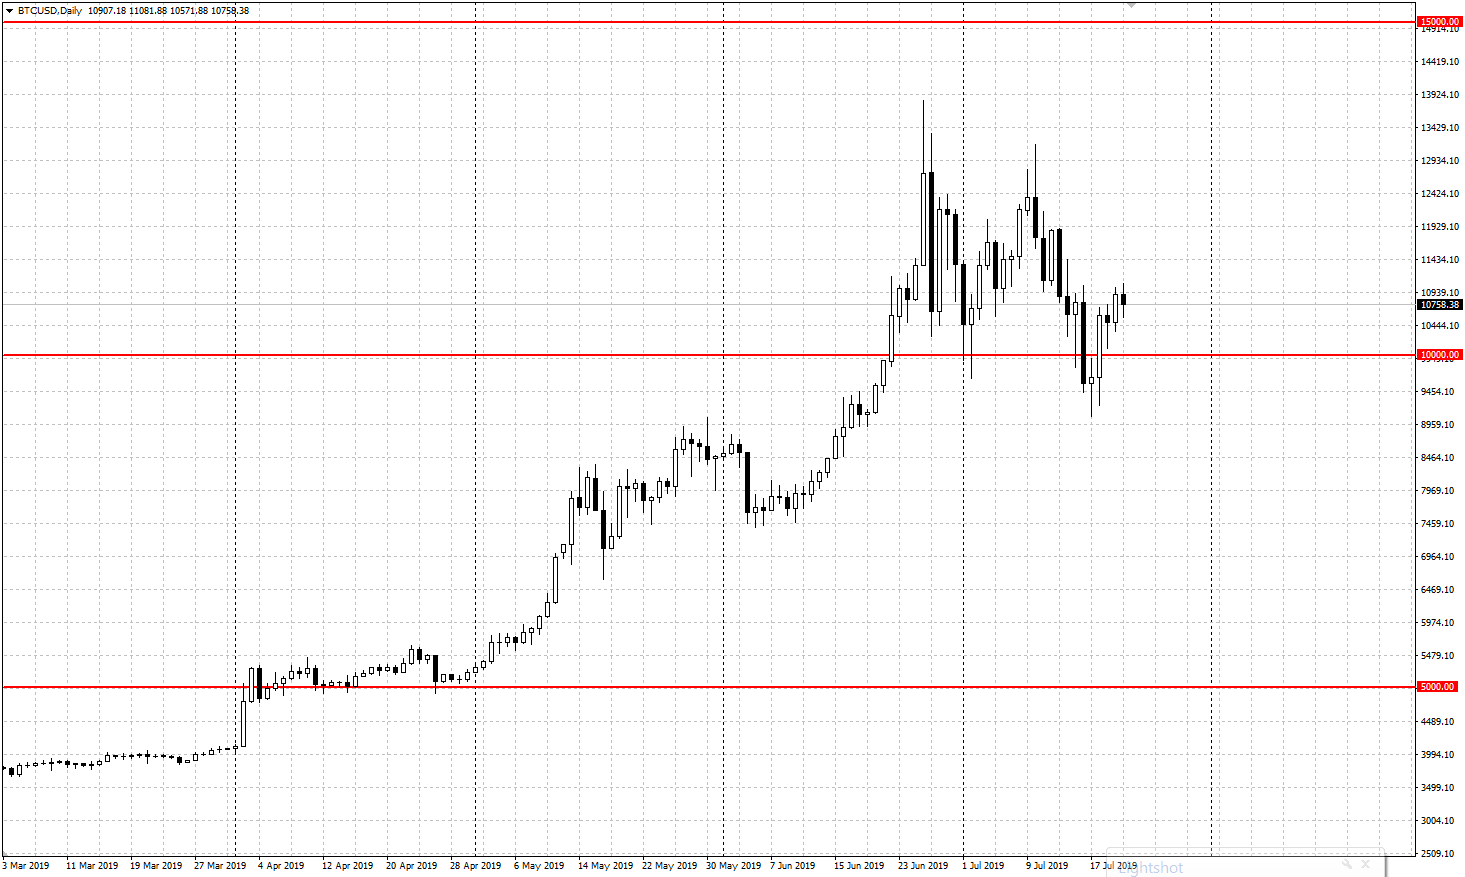
Candlestick chart
Candlestick chart is also called Japanese candlestick chart. It is drawn similarly to the bar chart, but the closing result is called the "body" of the candlestick. This chart is more demonstrative as the bodies are colored.
Postulates of technical analysis
Price reflects everything
The idea is that any factor that can influence the price is taken into account by the market and immediately included into the price, which is reflected on the chart. In other words, the price chart at any moment of time reflects and reacts upon all the factors influencing it — economical and political rumours, expectations, etc.
Price movements are subject to trends
This means that on the market there are timeframes when the price is moving predominantly in one direction (is rising or falling). In other words, a trend is a one-way price movement. The reasons for a trend to appear may be economical, political and other factors. It is thought that the existing trend is more likely to continue than to change and will remain in force until it weakens and shows explicit signs of the upcoming change.
Depending on the length, trends might be divided into 3 types:
- Short-term trends exist from several days to several weeks
- Mid-term trends exist from one to several months
- Long-term trends last from 6 months on.
History repeats itself
There are certain laws on the market. This means that the rules whch used to work in the past will probably work in future and at present. Analysis of historical data allows for carrying out not only technical, but also statistical analysis. Basing on the gathered and analyzed statistics of the previous timeframe, market behaviour may be forecast with some certainty. And though the market may change and has its peculiarities at certain times, in general the laws do work.
Trend and its types in technical analysis
As a famous market saying goes, trend is your friend. In technical analysis we single out 3 types of trends: an uptrend, a downtrend and a flat.
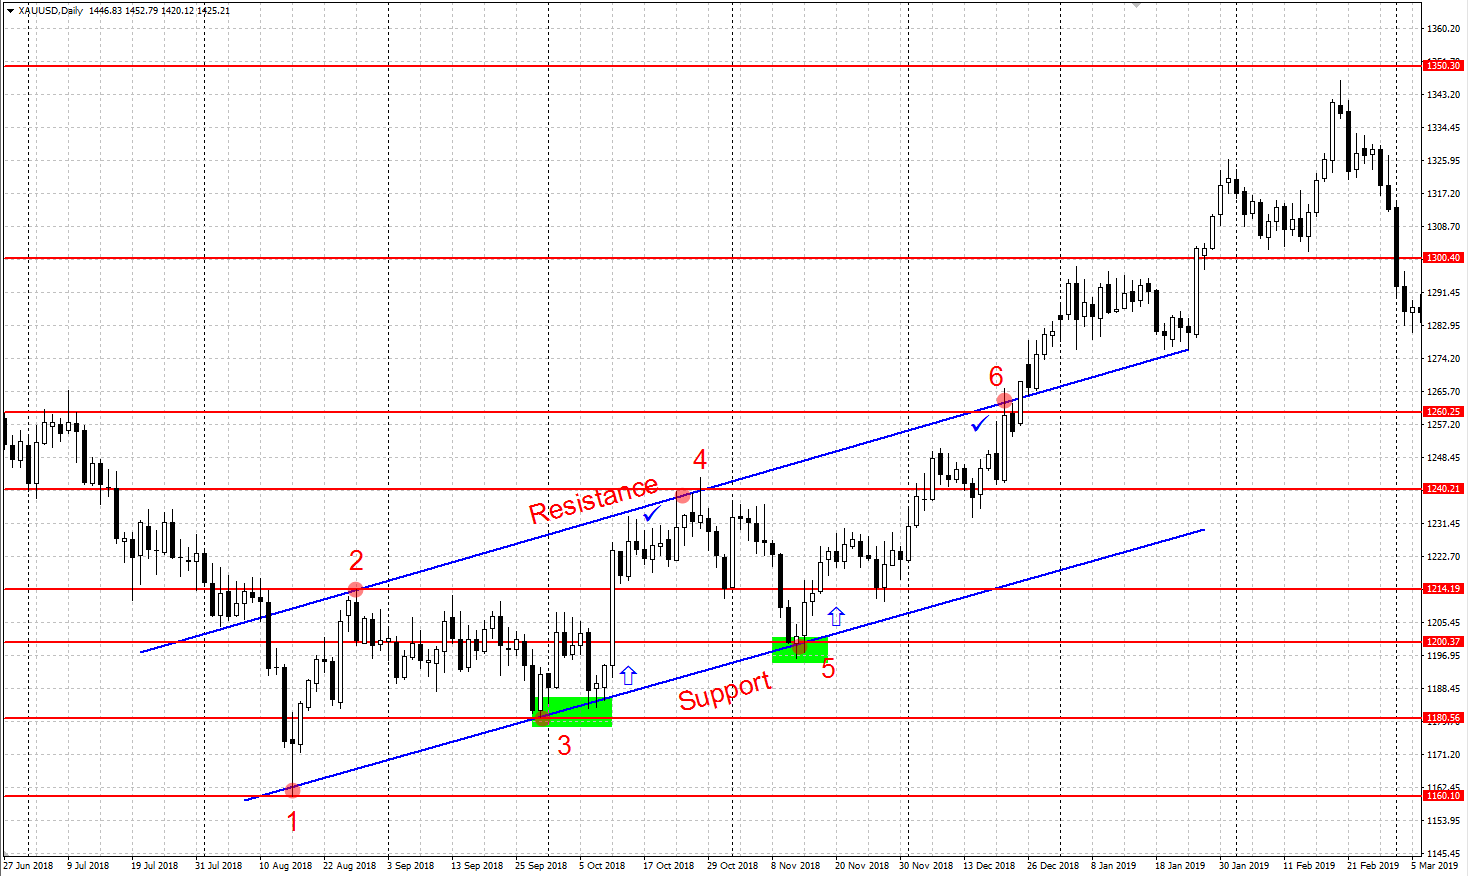
Uptrend
An uptrend means that the price grows. The main condition of the uptrend’s existance is that every next maximum is higher than the previous one, as well as every next minimum is also higher than the previous one. The trend remains ascending until trading goes in compliance with this rule, but as soon as the next maximum or minimum is below the previous one, the trend is over. Through the local minimums we draw a horizontal line which we call support. In an uptrend the support line is called trendline and lies low. Through the local maximums we draw another line called resistance. When the support and resistance lines are parallel, a so-called price channel formes.
A price channel is the fluctuation of the price between parallel support and resistance lines inside the existing trend.
The main rule of trading in an uptrend is to buy at the support level and close your positions at the resistance line.
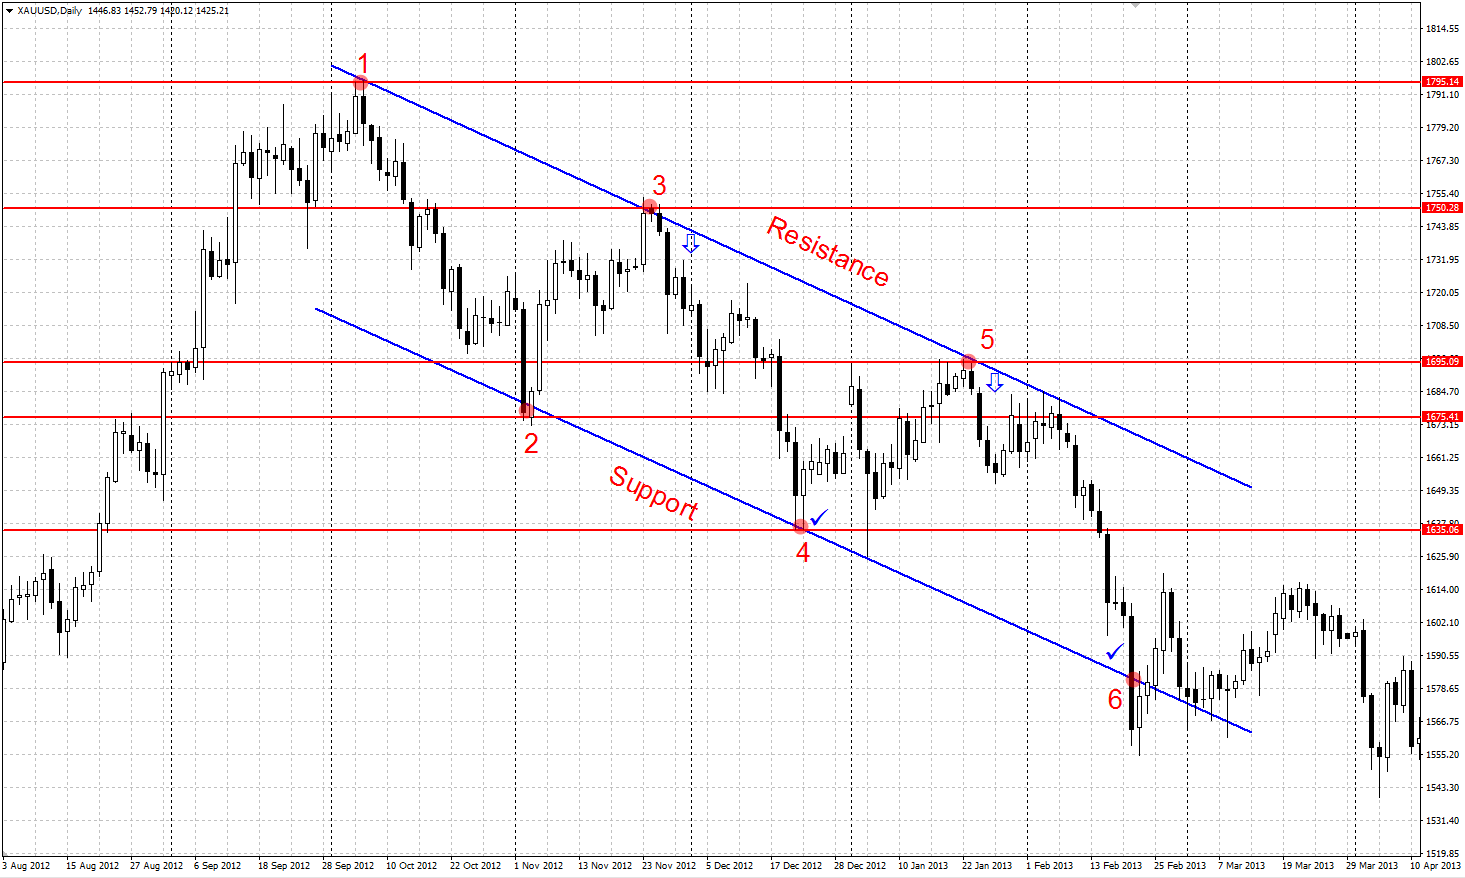
Downtrend
A downtrend is a trend of price declining. The main condition for a downtrend to exist is for each next maximum to be lower than the previous one, and same with minimums. The downtrend continues until some maximum or minimum turns out above the previous one, then we consider the trend over. Through the local maximums, we draw the resistance line. In the downtrend it is called trendline and lies high. Through the local minimums, we draw a straight line called the support line. If the resistance and support lines are parallel, they form a price channel (descending, in this case).
The main rule of trading in a downtrend is to sell at the resistance and close your positions at the support.
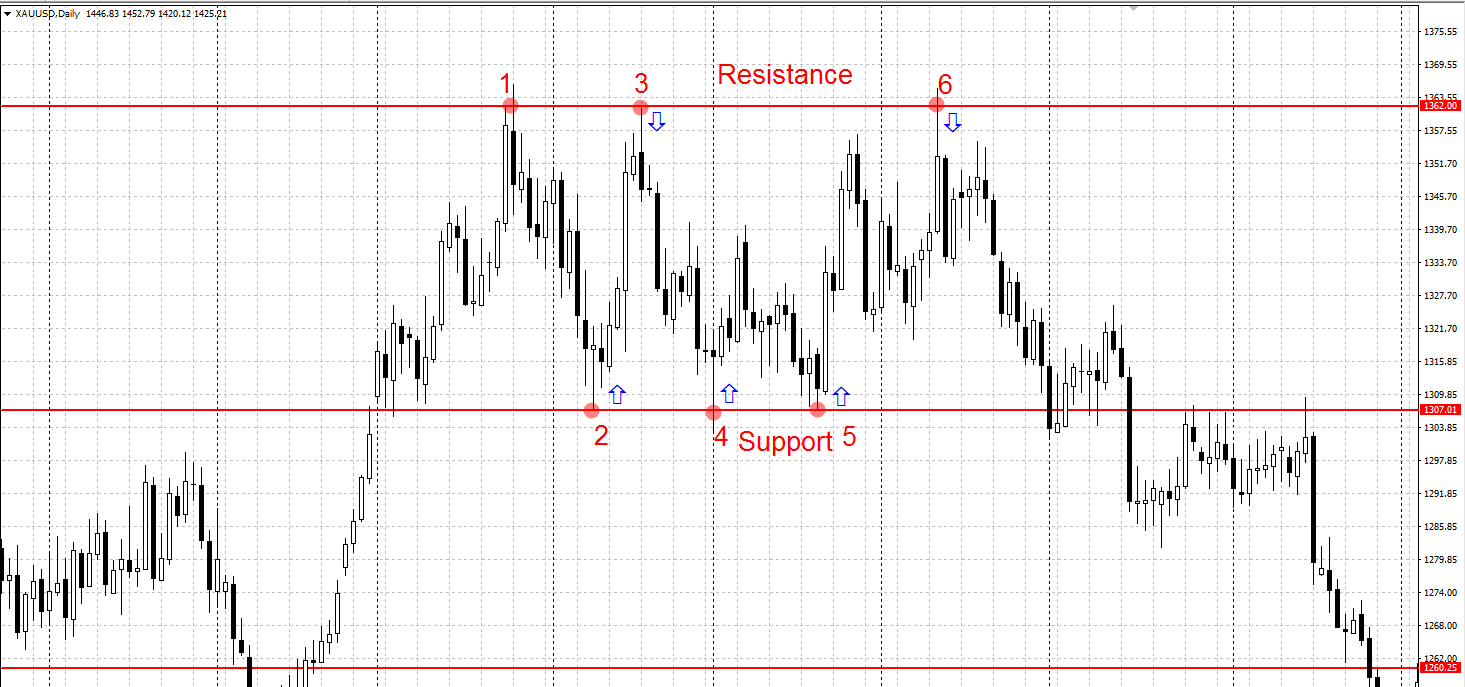
Range, Flat
A range, or a flat, is fluctuation of price in a sideways range when there is neither significant growth nor clear decline. Price changes in a flat are restricted by the support line from below and the resistance line from above, the lines forming a price channel. When the price escapes the channel up or down, the flat ends.
From the borders of a flat, you can trade equally up and down. The main rule is to sell at the resistance line and close your positions at the support line, and vice versa — buy at the support line and close your positions at the resistance line.
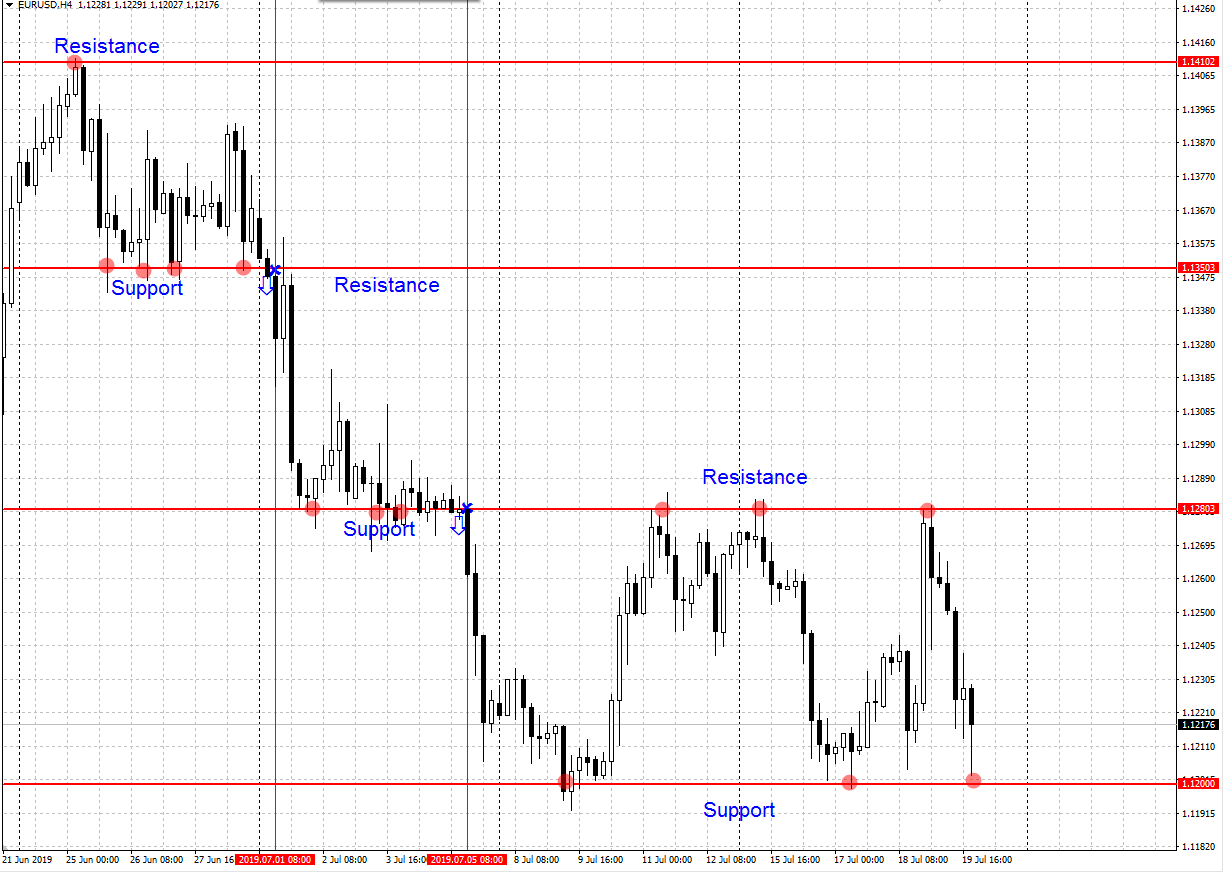
Support and resistance levels in technical analysis
Important instruments of technical analysis are the support and resistance lines, i.e. the lines drawn through the important maximums or minimums and having a concrete price value.
- Support is a price area where active buying may put the trend on a pause or reverse it for declining.
- Resistance is a price area where active selling may put the trend on a pause or reverse it for rising.
The support and resistance lines are drawn through those points on the chart where correction starts from. The longer the timeframe, the more important the levels drawn.
The principle of level polarity: if the resistance level is broken through and the price goes up, the level becomes the support. And vice versa: if the price goes below the support line, the latter becomes the resistance level.
Technical analysis chart patterns
As a result of long-term studies of the market, it was noted that periodically there appear price patterns on the chart that let forecast future behaviour of the price. There are patterns, signalling a reversal of the trend, and patterns, signalling its continuation. It is worth noting here that there is no 100% guarantee that the forecast will realize; however, it is high enough to use patterns in trading.
The most famous price patterns are:
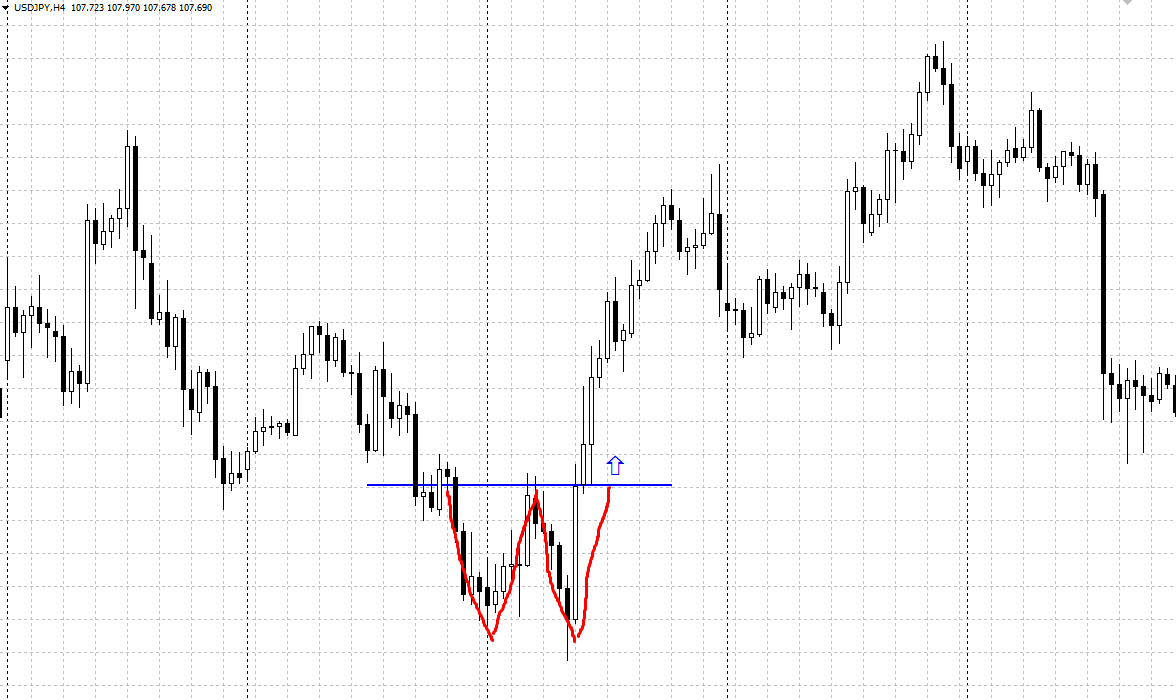
Head and Shoulders, Inverted Head and Shoulders chart patterns
Head and Shoulders, Inverted Head and Shoulders are reversal patterns forming on price maximums and minimums.
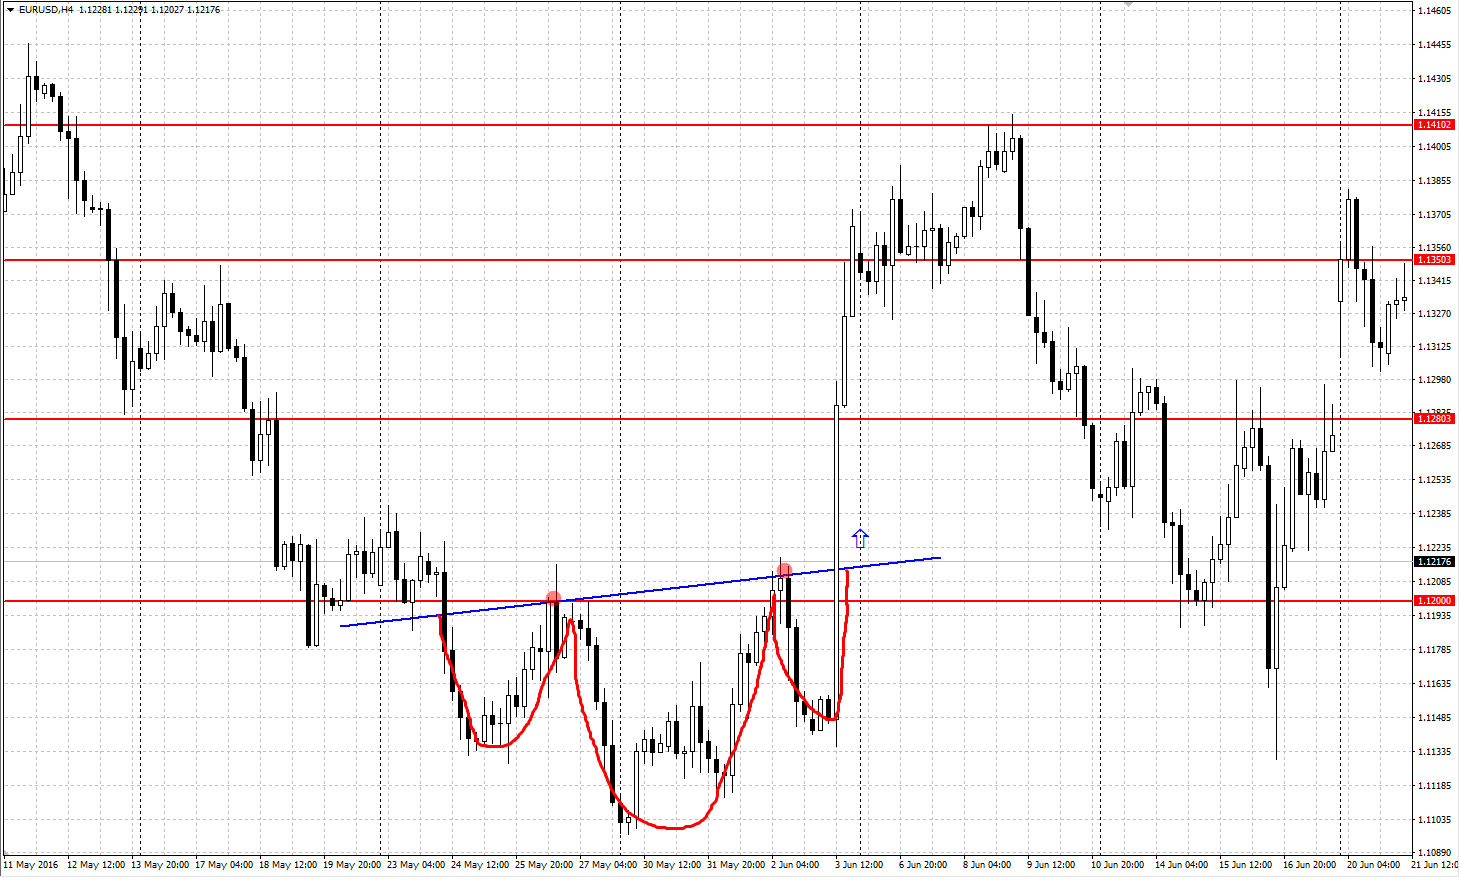
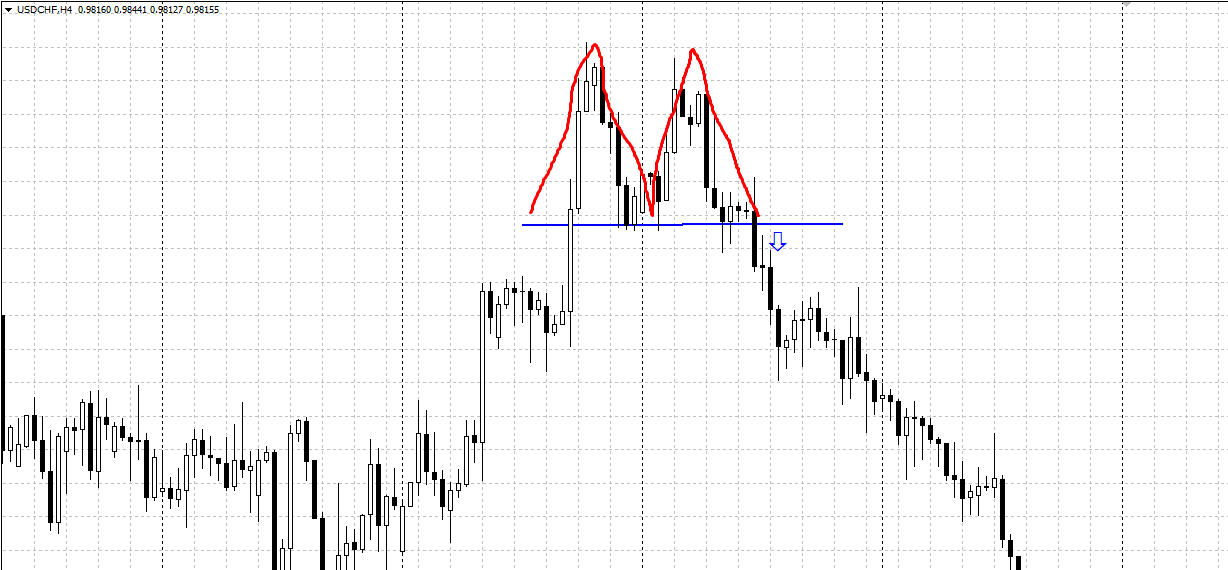
Double Top, Double Bottom chart patterns
Double Top, Double Bottom are reversal patterns forming on the price maximums and minimums.
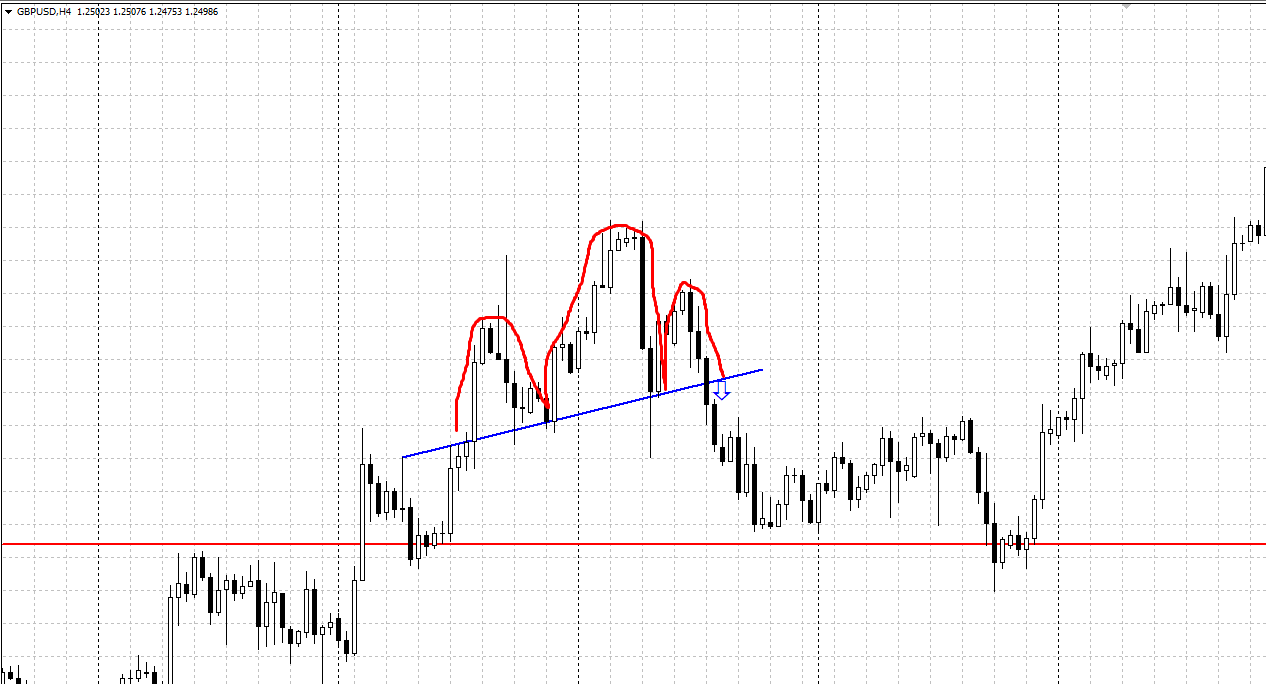
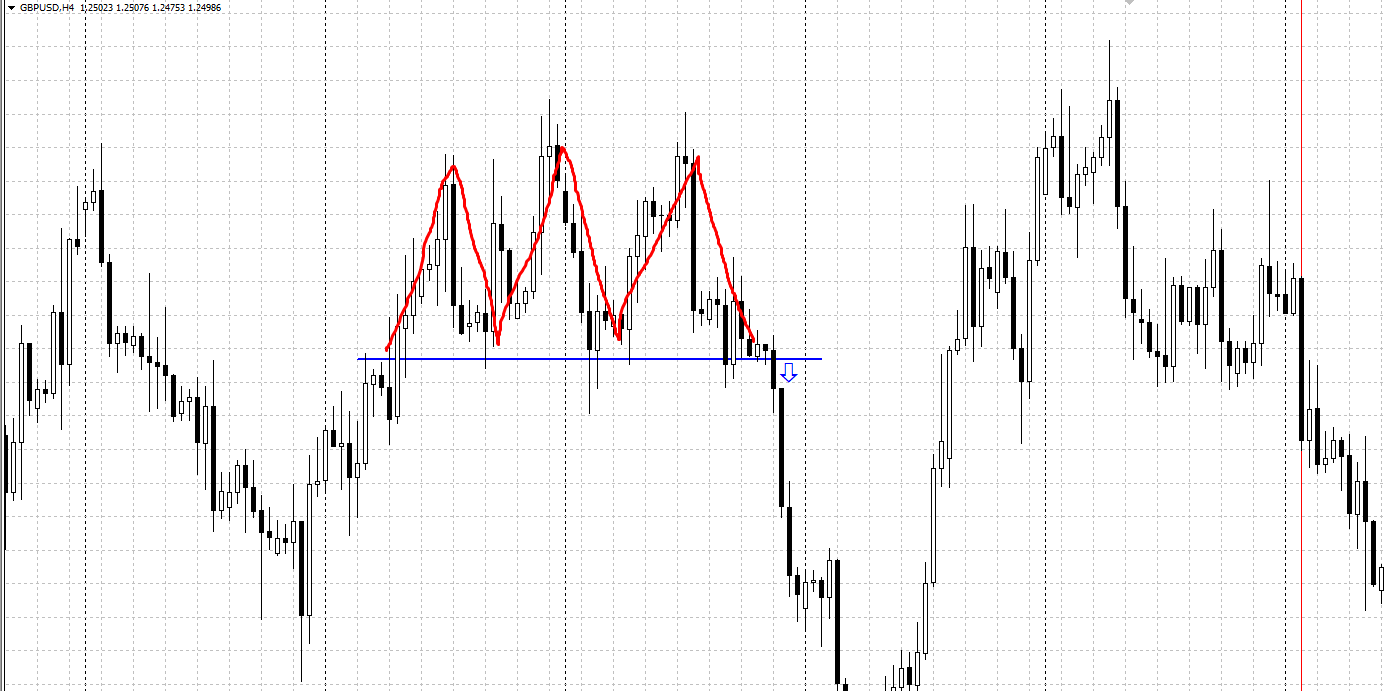
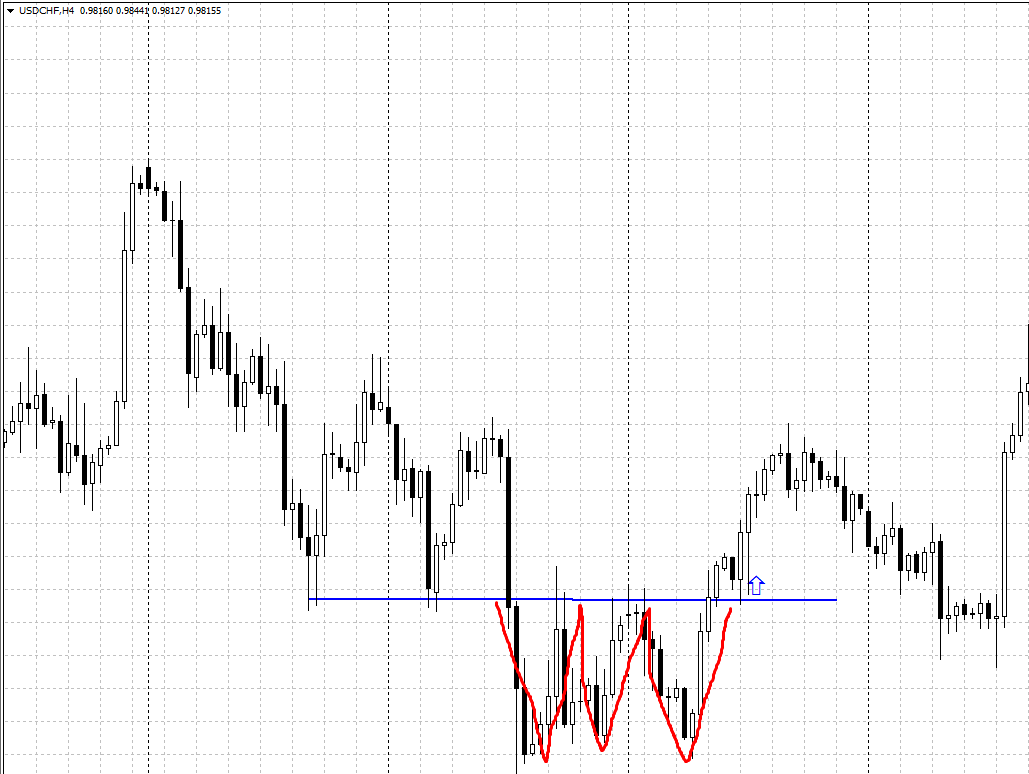
Triple Top, Triple Bottom chart patterns
Triple Top, Triple Bottom are reversal patterns forming on the price maximums and minimums.
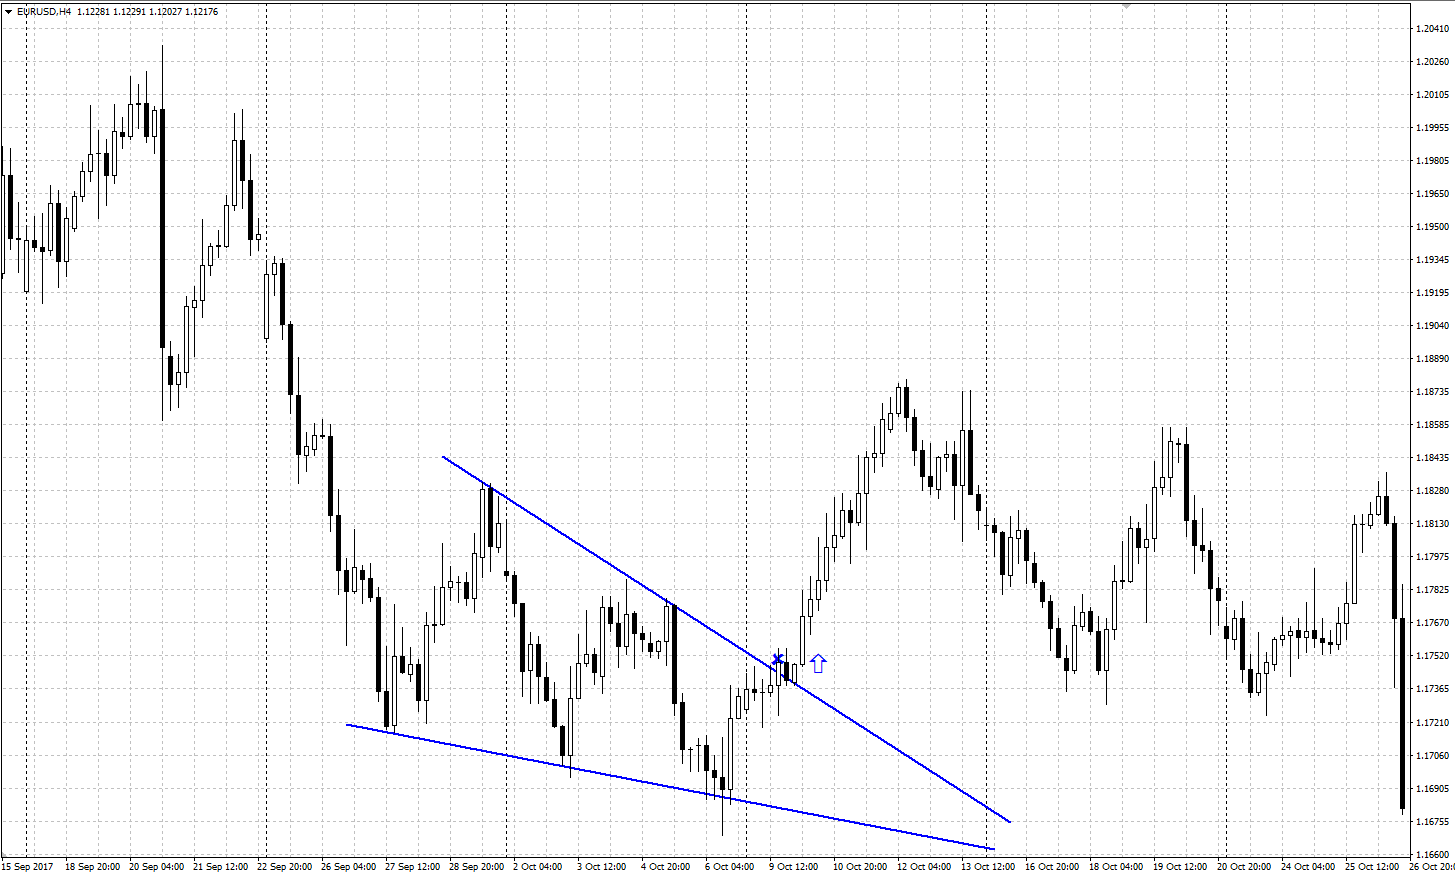
Wedge chart pattern
Wedge is a reversal pattern forming on the price maximums and minimums.
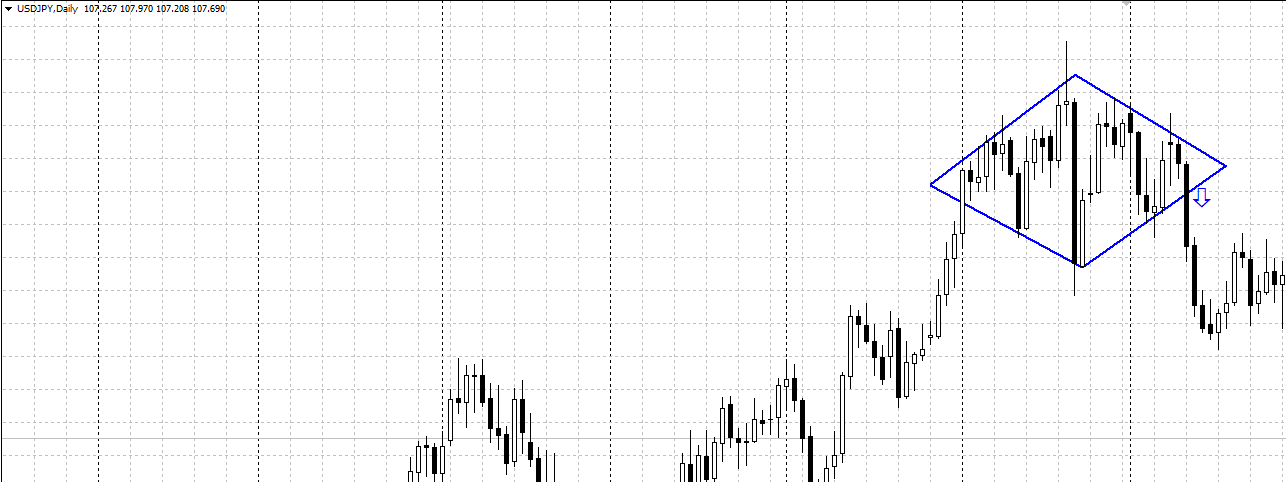
Diamond chart pattern
Diamond is a reversal pattern forming on the price maximums and minimums.
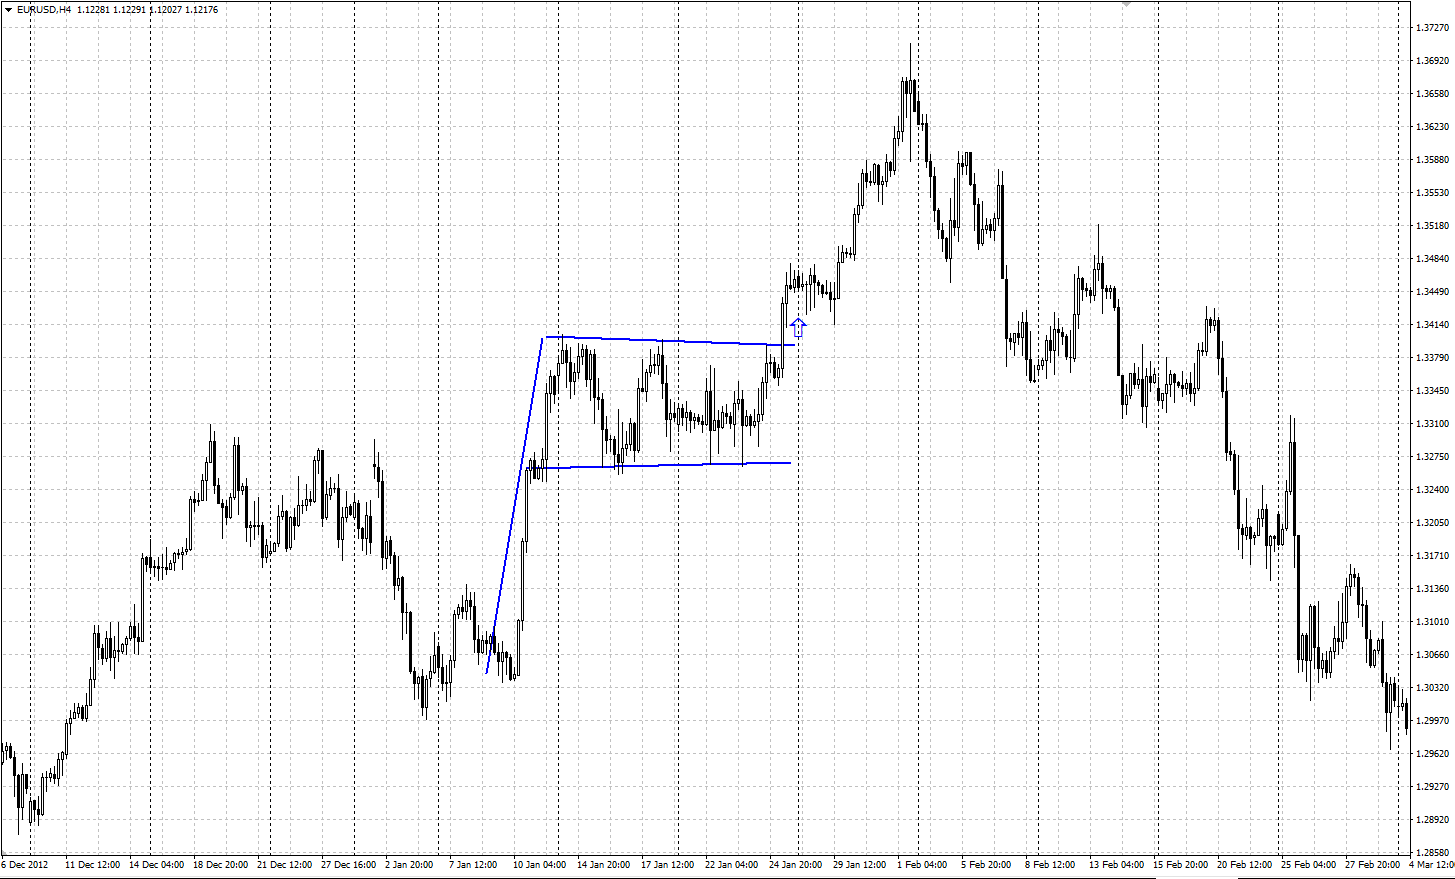
Flag chart pattern
Flag is a pattern of trend continuation.
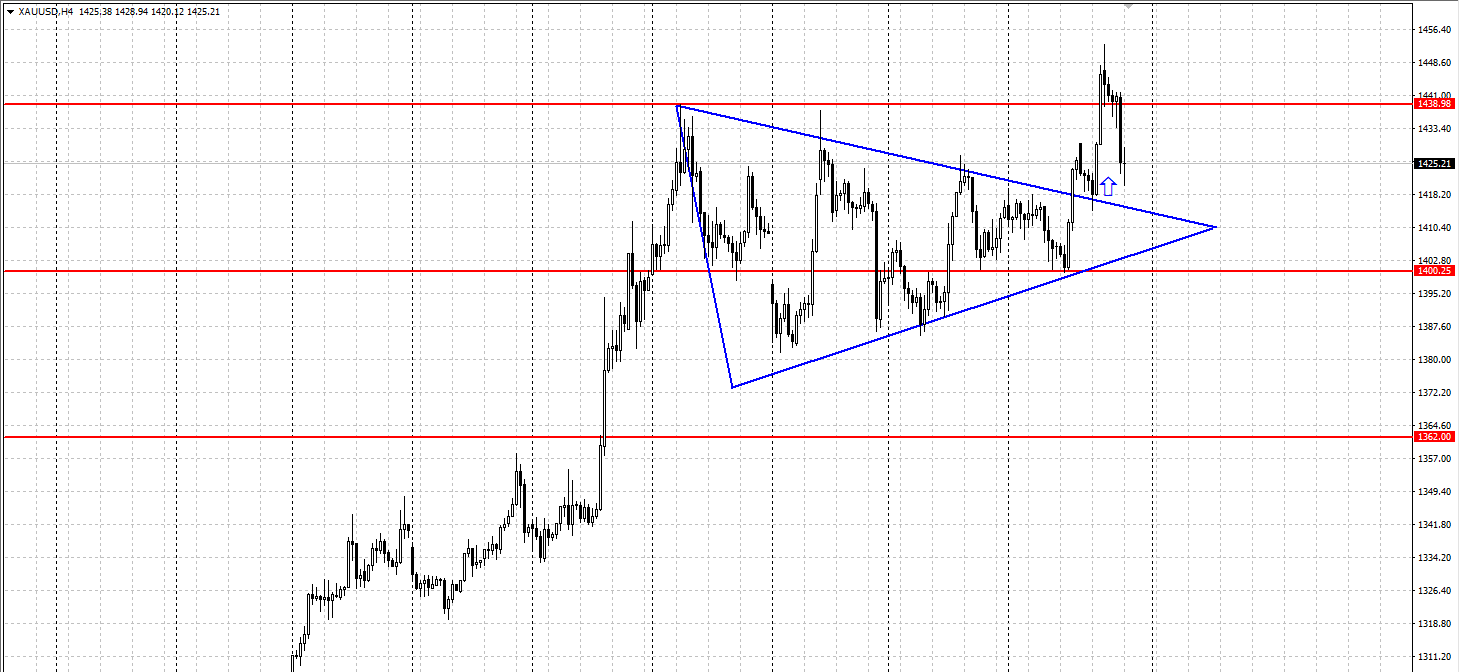
Triangle chart pattern
Triangle is a pattern of trend continuation.
In more detail, these figures are discussed in the article below.
Technical analysis with the use of indicators
Since computers were first used for trading, there has been created a wide range of various indicators helping traders make complex market analyses.
Technical indicators are mathematical functions based on the price or volumes. They may not only help analyze the market but also directly give trade signals. Some indicators work well in a trend, some do so in a range; there are also universal indicators.
The most popular indicators probably are:
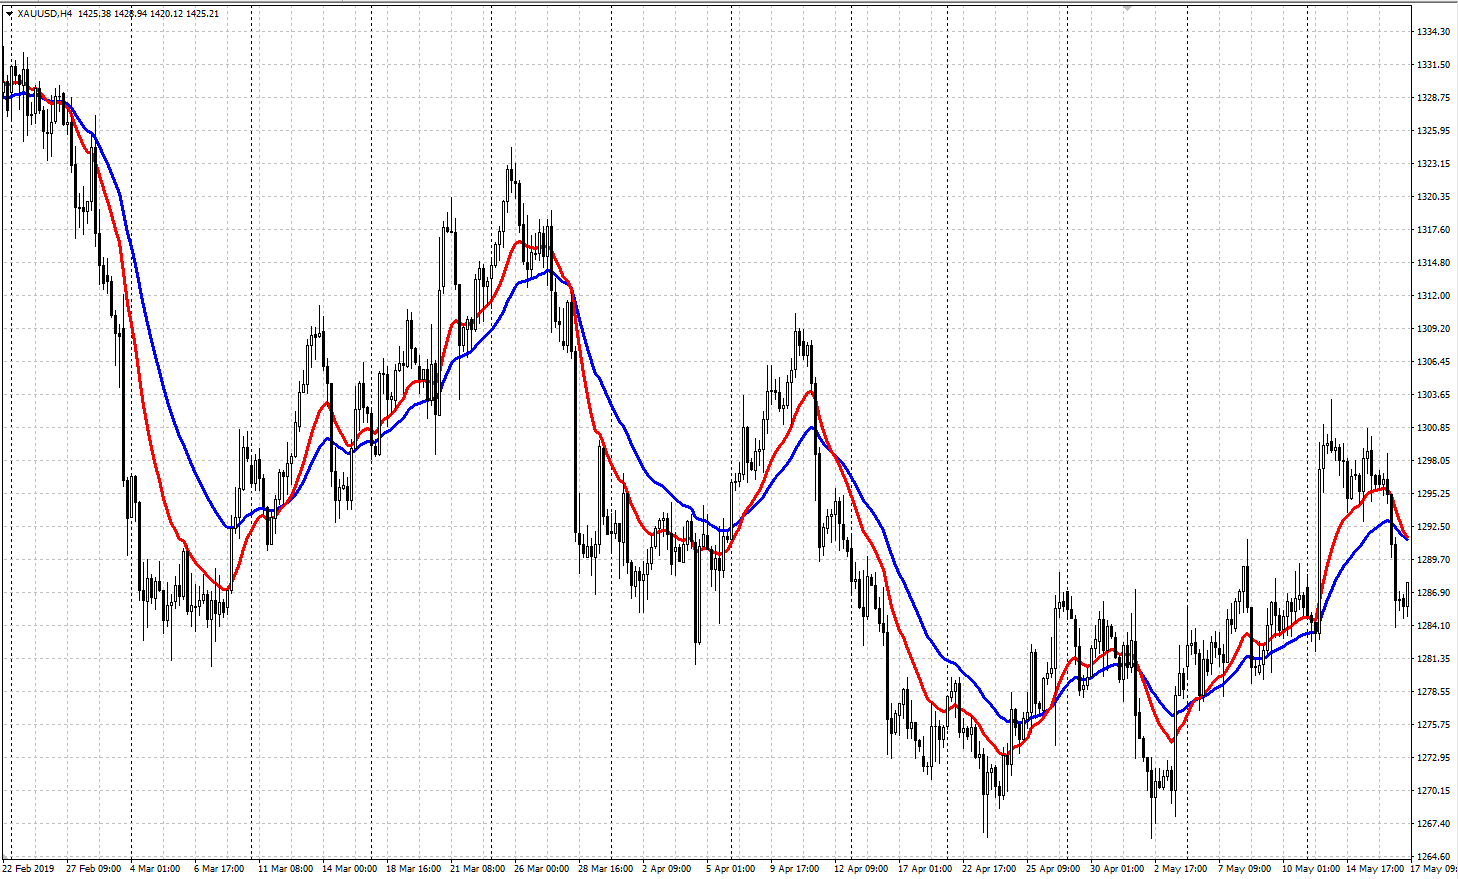
Moving Average (МА)
Moving Average (MA) is an indicator of average price movement. It is an instrument of computer analysis smoothing out price fluctuations by averaging them in a certain period of time.
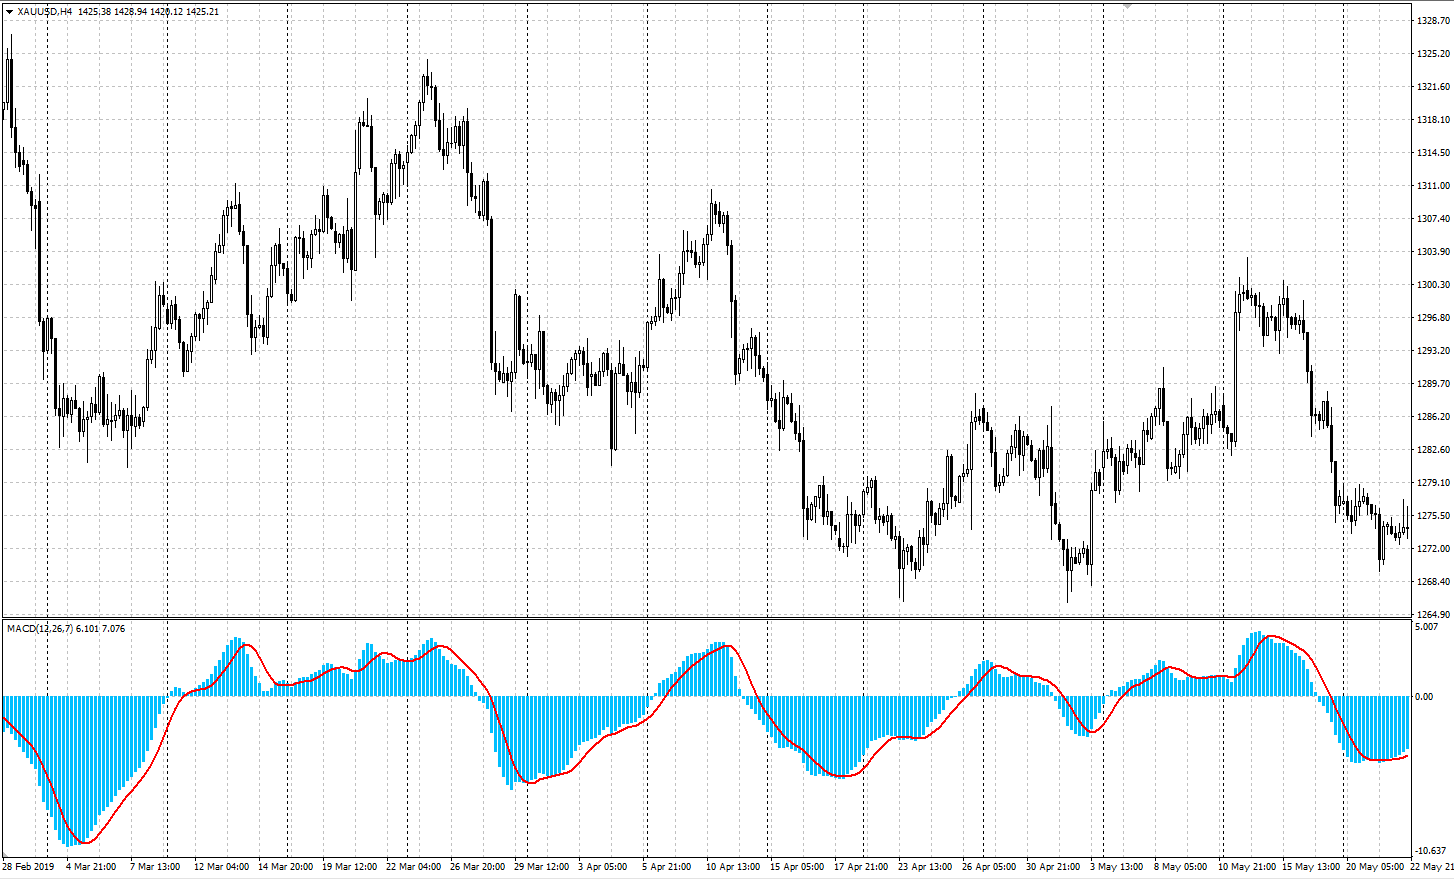
Moving Average Convergence-Divergence (MACD)
Moving Average Convergence-Divergence (MACD) is a combination of three exponentially smoothed moving averages. The indicator looks like a histogram with a signal line upon it.
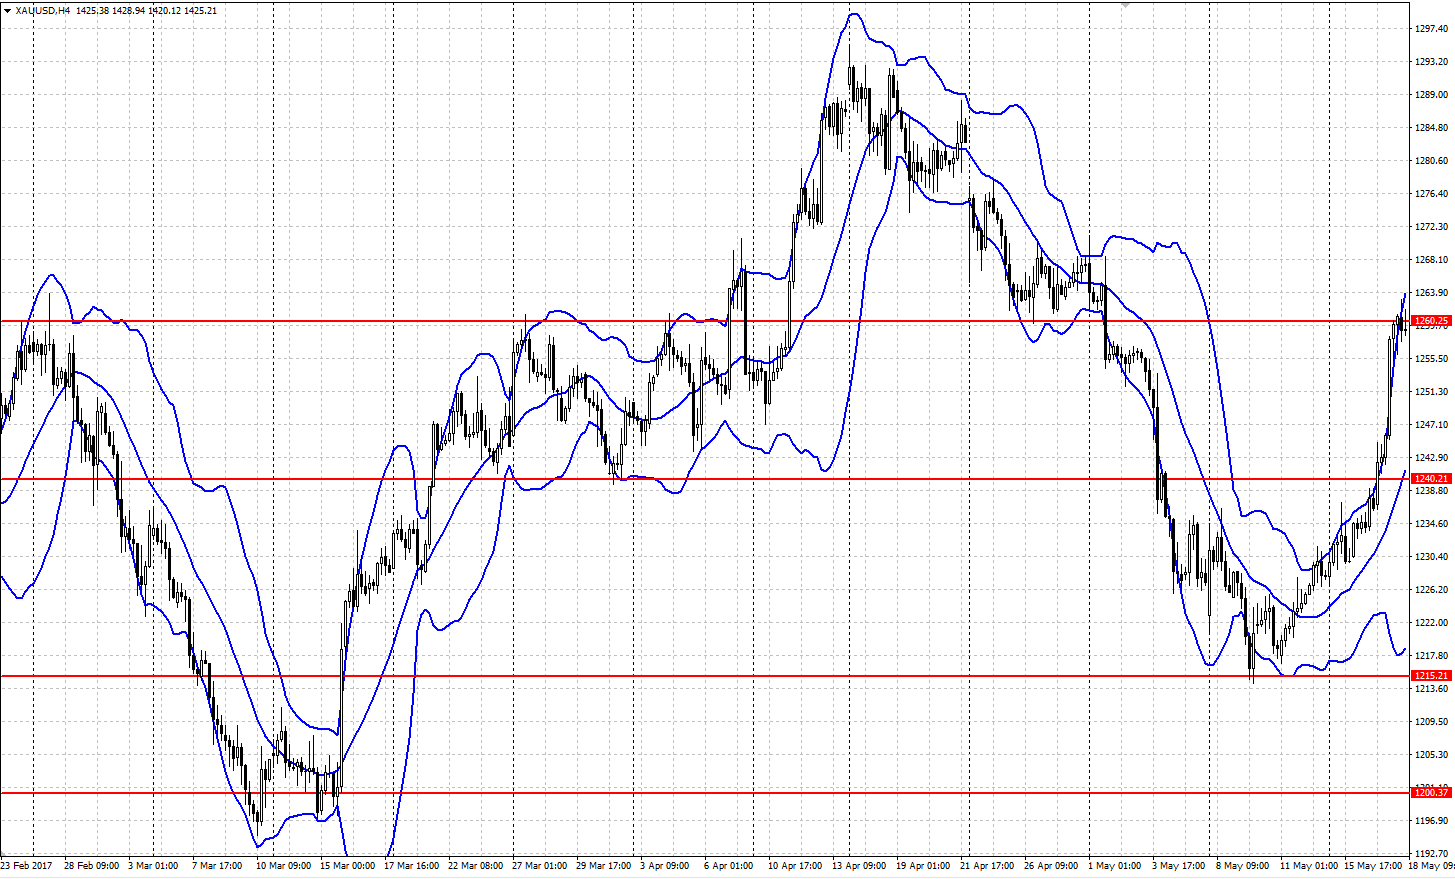
Bollinger Bands (BB)
Bollinger Bands (BB) help define the moment of the market transition from calm to active state and vice versa. The indicator is placed upon the price and is comprised of three moving averages with fixed deviations.
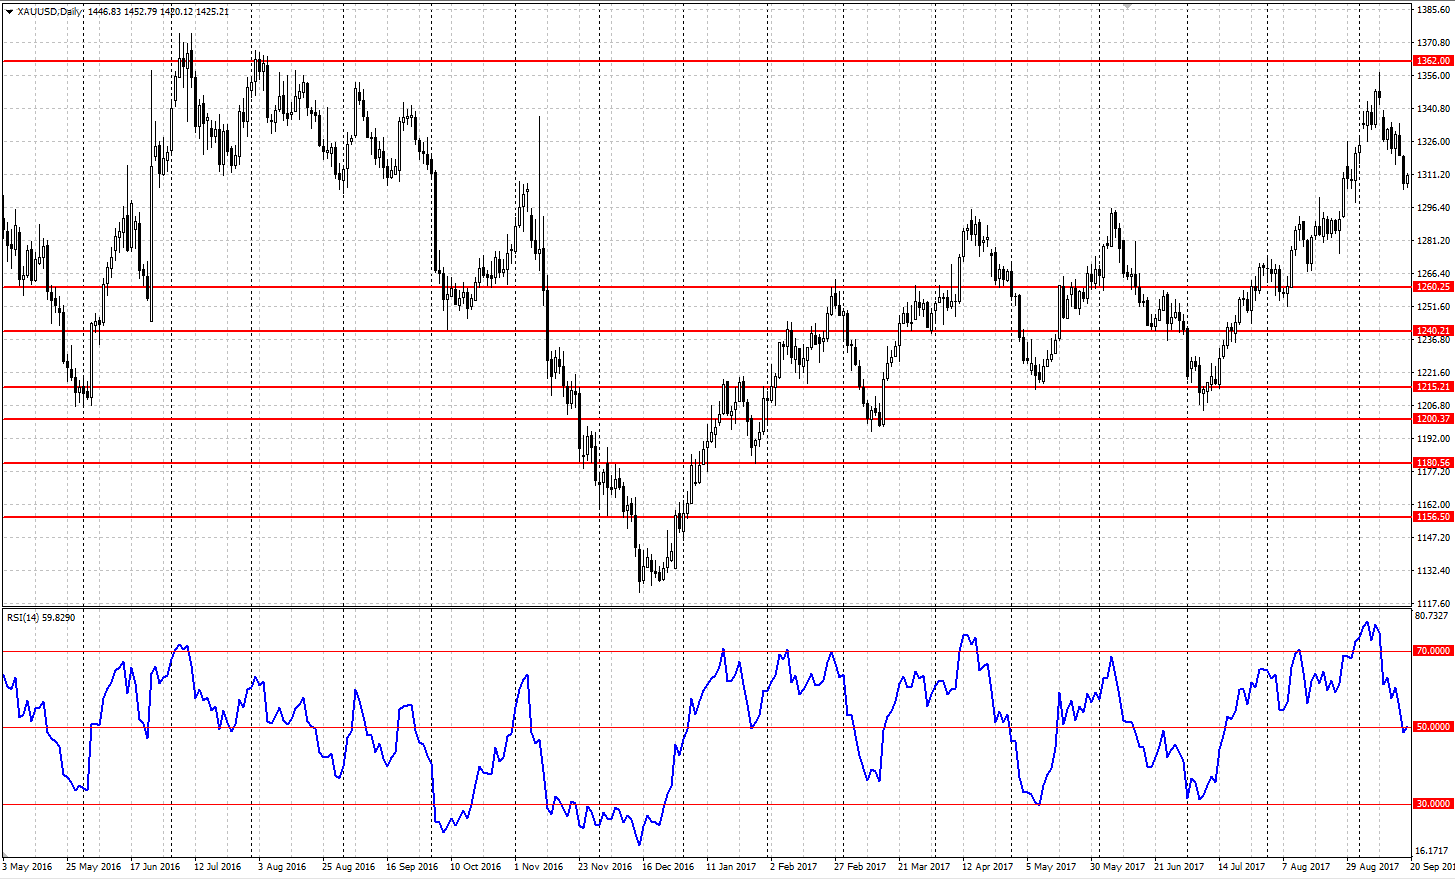
Relative Strength Index (RSI)
Relative Strength Index (RSI) is an oscillator that measures the relative strength of the market, comparing absolute values of the market growth and falling.
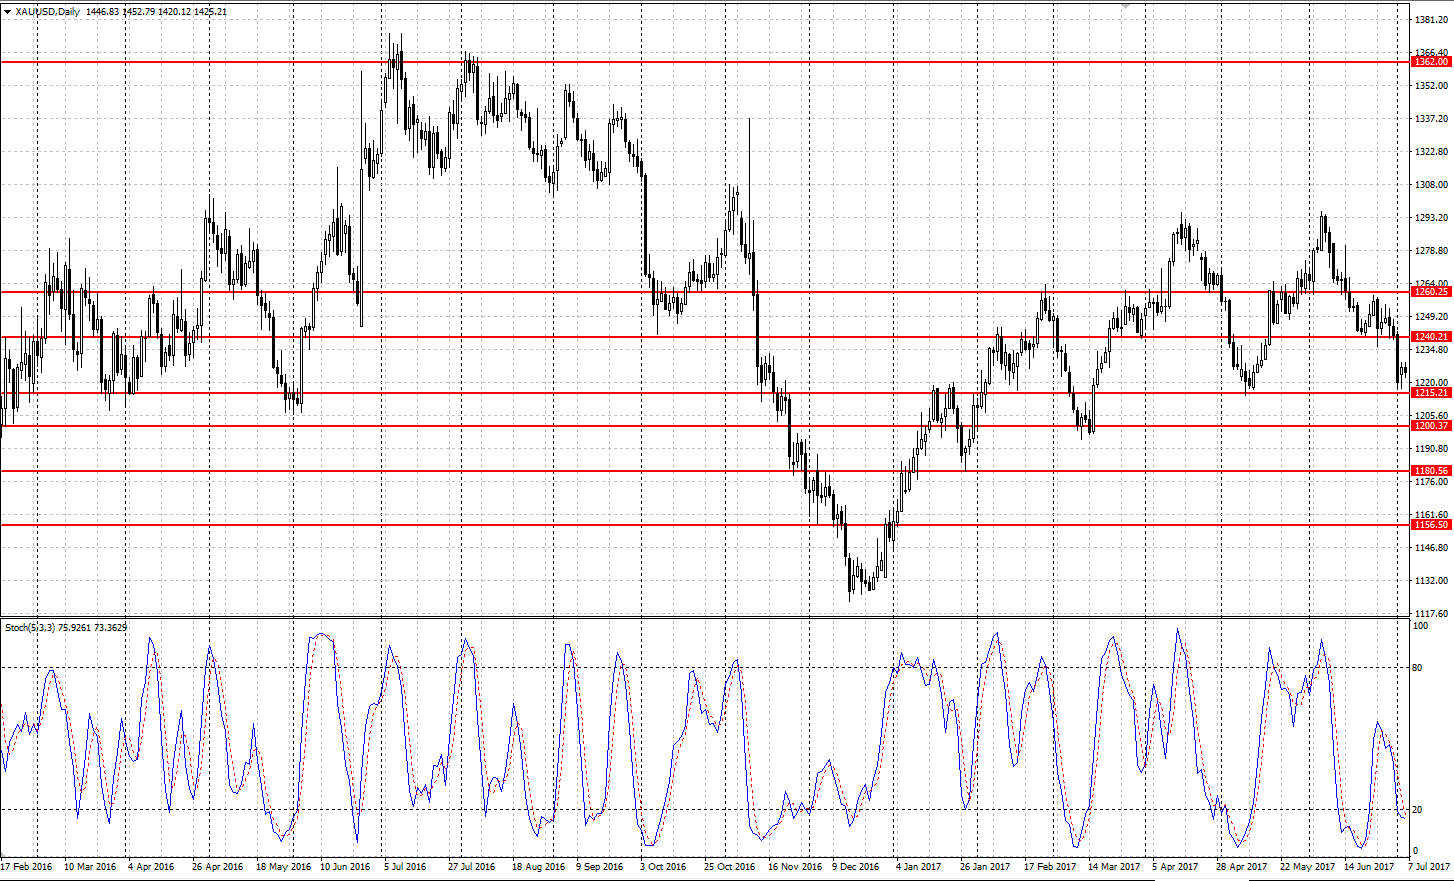
Stochastic Oscillator
Stochastic Oscillator uses the following condition: in an uptrend, the closing price aims at the maximums of the timeframe, and in a downtrend — at the minimums.
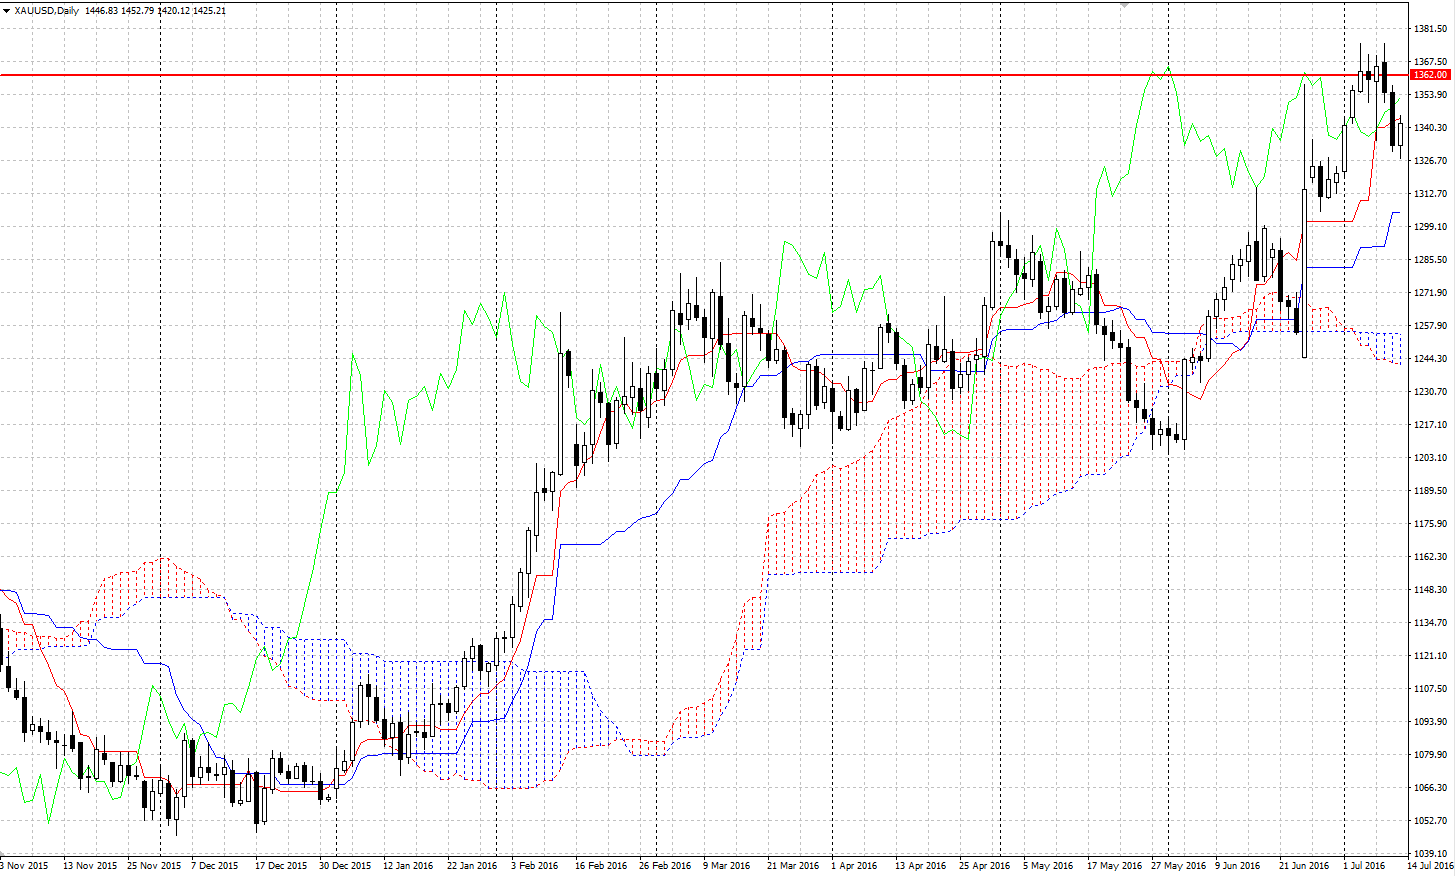
Ichimoku Kinko Hyo (Ichimoku)
Ichimoku Kinko Hyo is a complex indicator comprised of 5 lines, 3 of which are moving averages and 2 are their derivates. Ichimoku does not only define the presence of a trend but also provides information about the placement of the support and resistance areas.
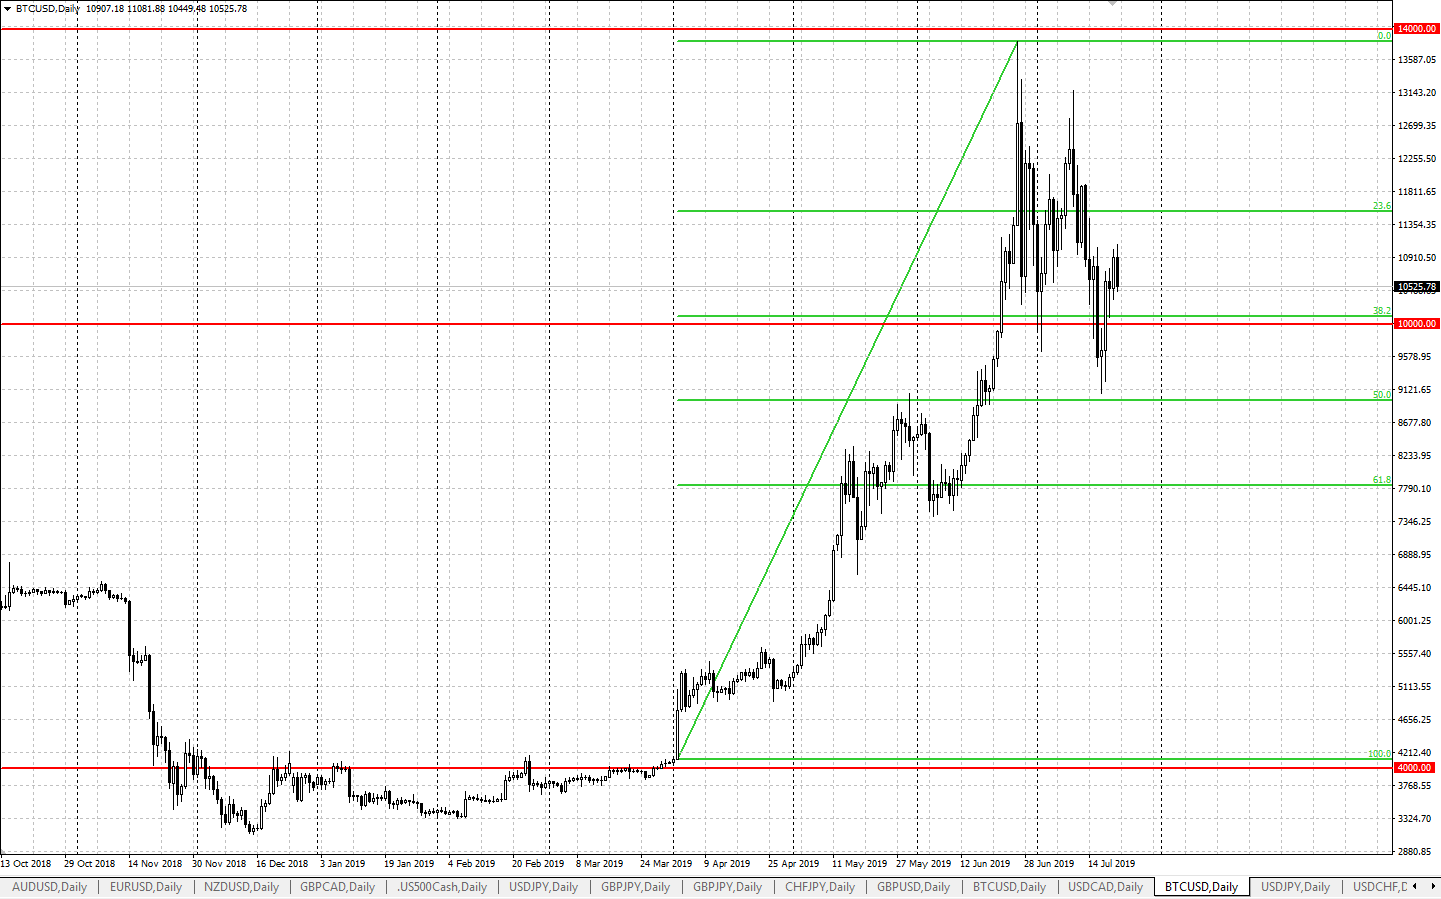
Fibonacci levels
Fibonacci represents approximate correction levels on the chart, calculating them on the basis of the row of numbers, discovered by the famous mathematician.
Summary
Technical analysis is that necessary minimum that provides for serious trading. The same way we need alphabet to learn to read and multiplication table to learn to count. And though the knowledge of technical analysis itself does not guarantee success in trading, it serves as the starting point for mastering all secrets of the market and forming your own trading system.