What are Fibonacci Levels? How to Use Them on Forex?

7 minutes for reading
Introduction
One of the most known and popular trading instruments on Forex are the Fibonacci levels (or lines). They appeared thanks to a famous Italian mathematician Leonardo from Pisa, better known by his nickname Fibonacci (son of Bonacci). He studied an endless mathematical sequence later named Fibonacci after him. It looks as follows: 0, 1, 1, 2, 3, 5, 8, 13, 21, 34, 55, 89, 144, etc. where each next number is the sum of the previous two numbers. The relationships between the numbers in this sequence turned out to be quite interesting: dividing a preceding number by the next one we get 0.618; dividing a number by the number after the next one, we get 0.382. These ratios are considered main, the supplementary ones being 0.236 and 0.764.
The Fibonacci numbers and their ratios have been noticed to emerge in the world around us: in nature, art and music. For example, the famous golden section represented as a rounded off percentage is the division of a number as 62% and 38%. As soon as trading appeared, the Fibonacci sequence came to the exchange market as well.
Almost any trading terminal features an instrument called Fibonacci lines. There are the following levels on the scale: 0.0, 23.6, 38.1, 50.0, 61.8, 76.4, 100.0. These values are expressed as percents and show how much the price has corrected after another movement.
Fibonacci settings
In the MetaTrader 4 and MetaTrader 5 terminals, there is a fast-access key"Drawing Fibonacci Lines". The default settings of the instrument are as follows: 0.0, 23.6, 38.2, 50.0, 61.8, 100.0, 161.8, 261.8, 423.6. The levels from 0.0% to 100.0% are used as landmarks for correction, while the levels from 100.0% to 423.6% are possible landmarks for further movement along with the trend upon the completion of the correction. For a better visual representation, the color and the style of the lines are customizable. Upon customizing, the instrument is ready for use. The lines are applied on the desired chart by a left click of the mouse; first, we set up the first point where the price movement begins; then, holding the left key of the mouse pressed down, we drag the correction levels to the second point where the price movement ends. And then, we may start looking for trading signals.

Classic trading with the indicator
The classic trading with the indicator goes as follows: we put the Fibo lines on the last complete price impulse of an instrument with the first point at the beginning of the movement and the second one — at its completion, the local maximum/minimum. Then we wait for a correction to the Fibonacci levels and see which level a bounce will form off (the correction will end) in order to enter the market at trend continuation. The most important correction levels are 38.2%, 50%, and 61.8%, while others are less important. If the correction goes confidently beyond 61.8%, the previous impulse is unlikely to continue and is more likely to reverse.
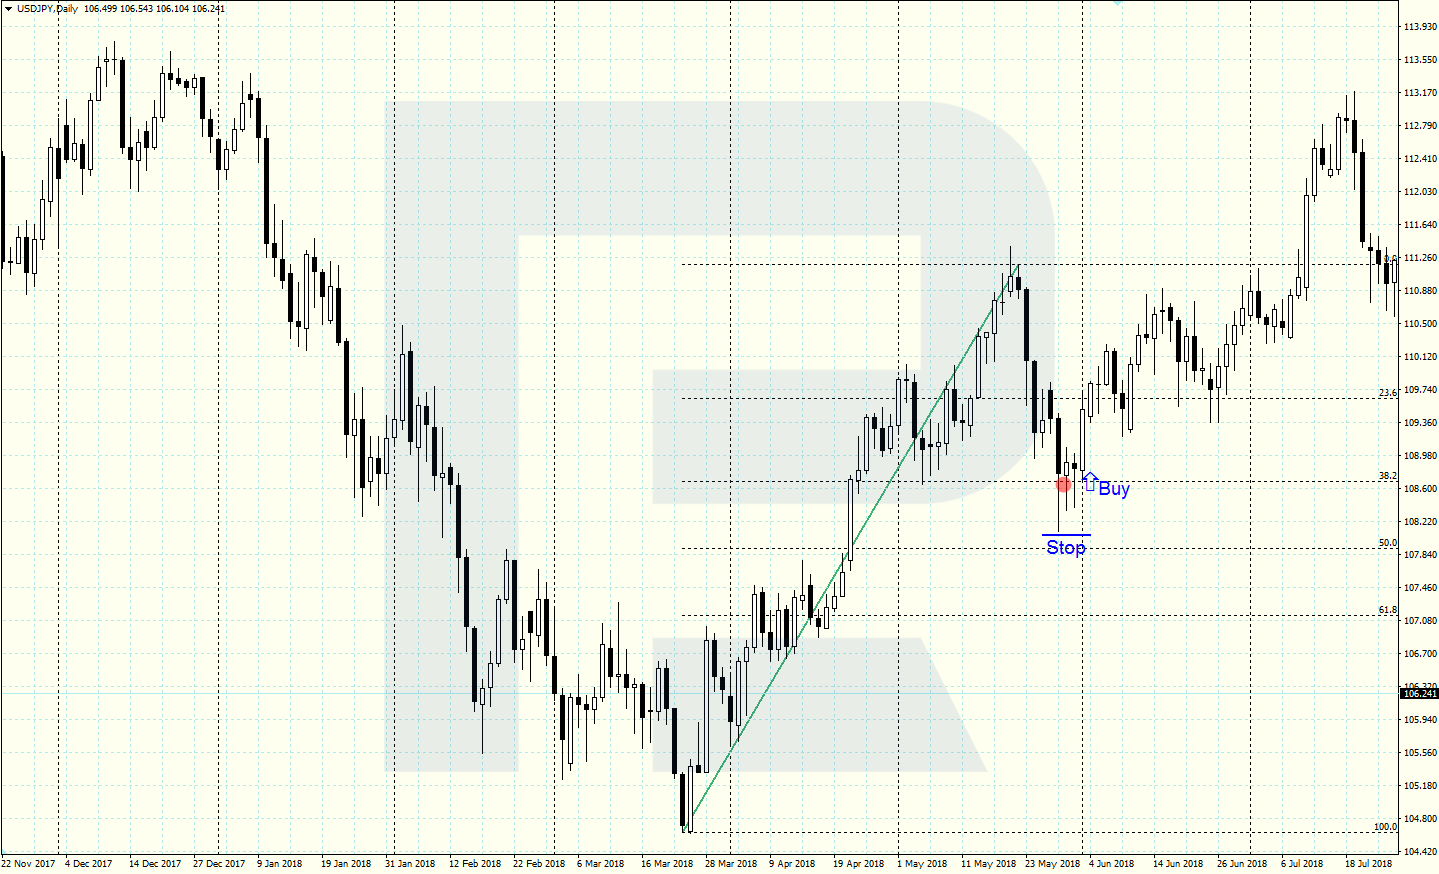
Buying after an ascending impulse
Upon completion of an ascending impulse, we apply the Fibo lines on the chart, extending them from the minimum to the maximum, and watch the correction. After a bounce off 38.2%, a buying position may be open, placing the SL below the local minimum; the profit is likely to be received after a return to 0.0% with a possible breakaway and a further movement upwards.
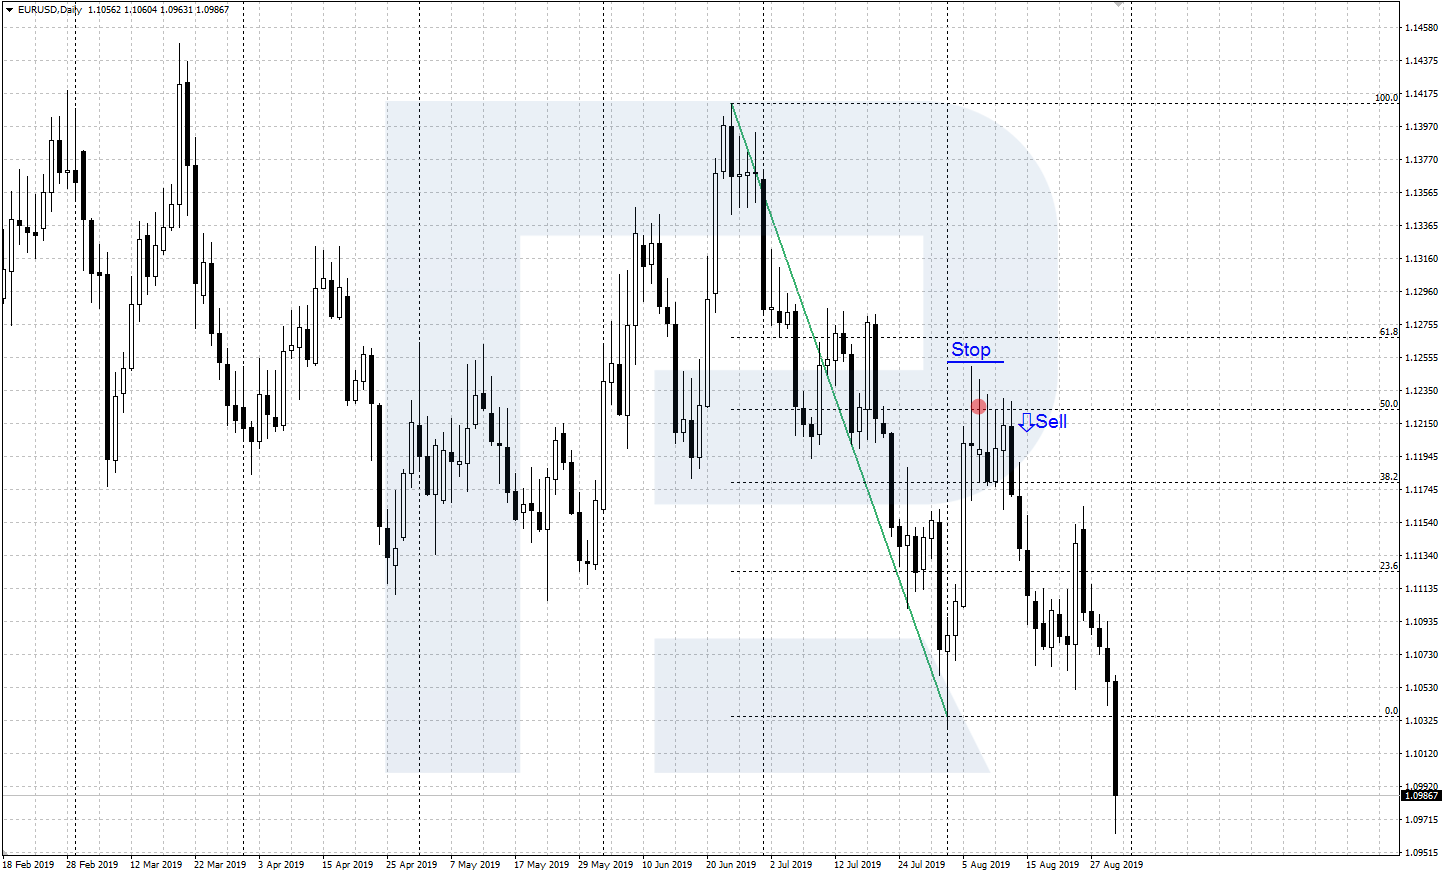
Selling after a descending impulse
We find a complete descending impulse, apply the Fibo lines on it from the minimum to the maximum and wait for a correction. After a bounce off 50% and formation of the local maximum in this area, we may open a selling position, placing the SL beyond the maximum; the aim of the profit is a return to 0.0%, and in the case of a breakaway, a further decline.
Fibo + Ichimoku
To enhance your trading, you can add some supplementary instruments, giving confirming signals, to the Fibonacci lines. In this case, apart from a strong correction level of 61.8% we also use the Ichimoku Kinko Hyo indicator with the default settings. In more detail, the Ichimoku indicator is described in the article "How To Use The Ichimoku Kinko Hyo".


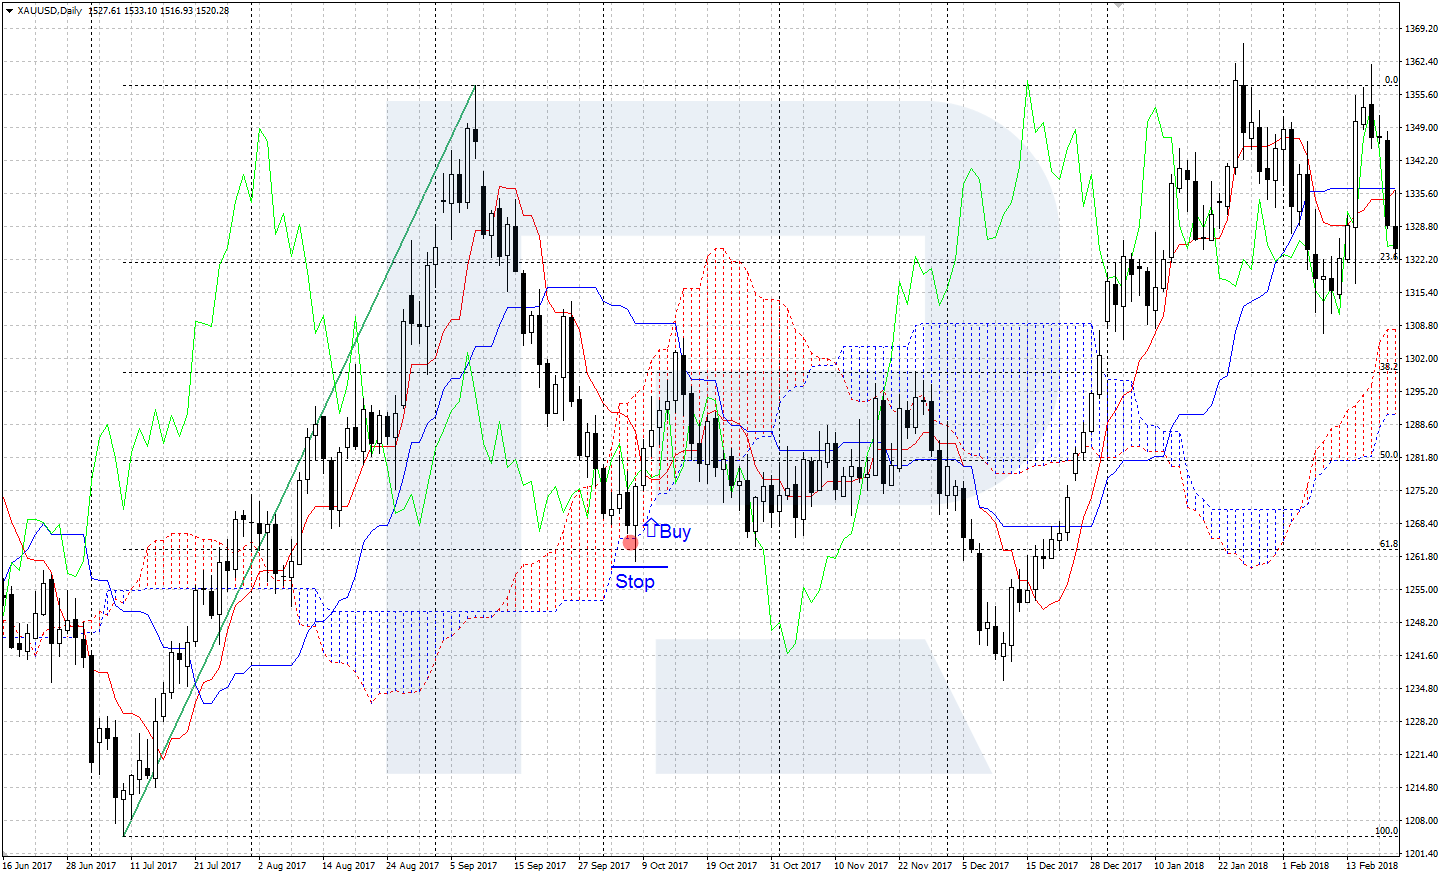
Buying after a correction to 61.8% + Ichimoku
Upon completion of an ascending price impulse, we wait for a descending correction to 61.8% Fibo; an additional filter will be the coincidence of this level with the lower border of the Ichimoku Cloud. If this additional condition is executed, we open a buying position, placing the SL beyond the closest minimum and the TP — near the upper border of the Cloud.
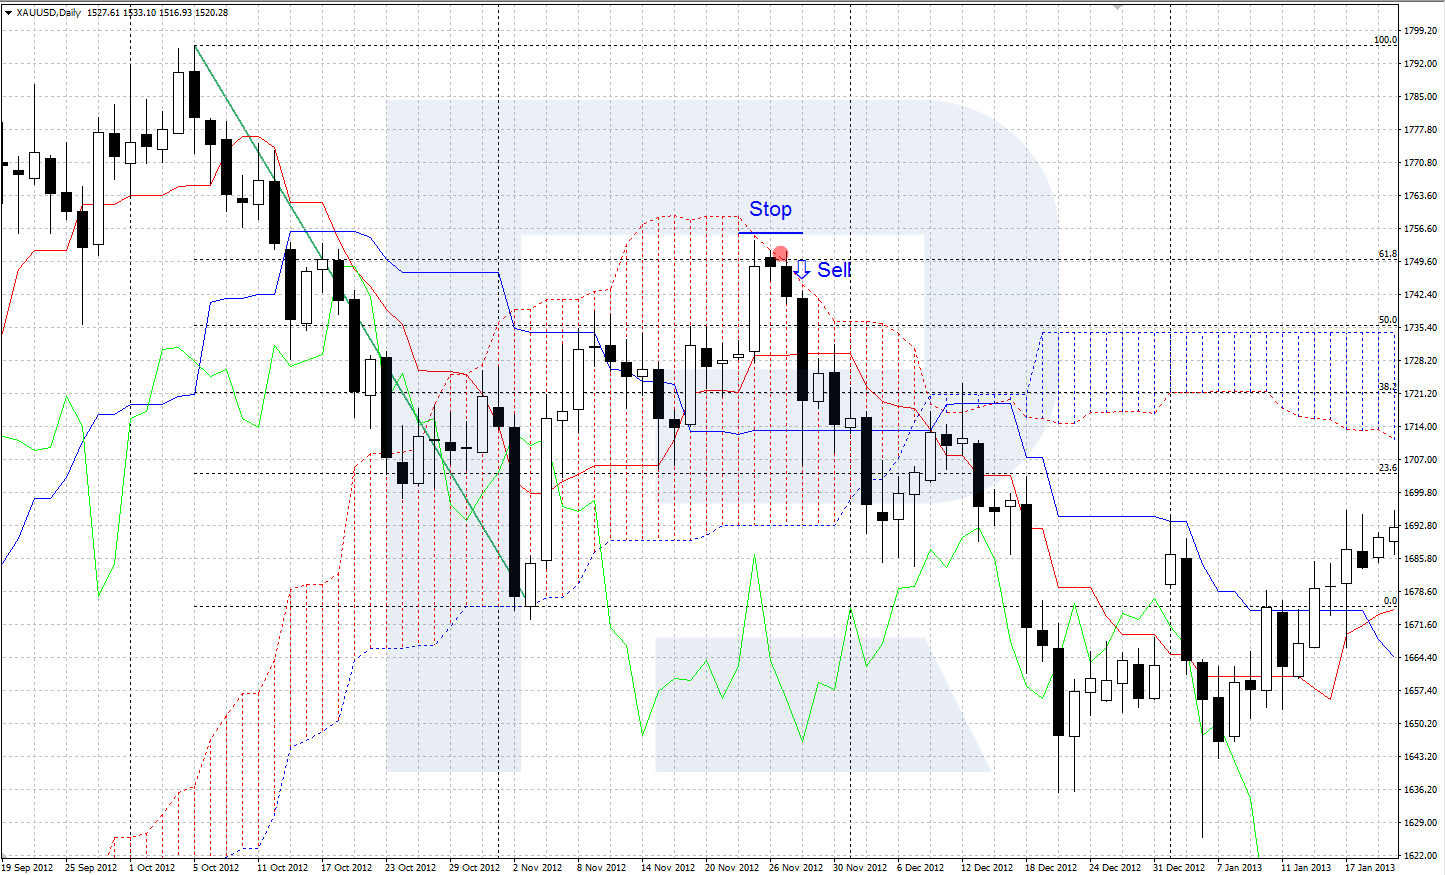
Selling after a correction to 61.8% + Ichimoku
Upon completion of a descending impulse, we drag the Fibo lines from the minimum to the maximum, wait for an ascending correction to the area around 61.8%; the confirming signal will be the coincidence of this level with the upper border of the Ichimoku Cloud. If the signal is confirmed, we open a selling position, placing the SL beyond the local maximum and the TP at the lower border of the Cloud.
Summary
The Fibonacci levels are a very popular and useful instrument, working equally well on large and small timeframes. The Fibo lines on the chart let the trader see the landmarks for correction and, upon its completion, open positions along with the current trade. For more efficiency, the Fibo levels are to be supplemented by confirming signals of technical analysis (strong support/resistance levels, price patterns), candlestick analysis (candlestick patterns) and other indicators (Ichimoku, etc.).


