How to Trade Tweezers Candlestick Pattern?

5 minutes for reading
This article is devoted to the Tweezers pattern: how it forms and trades. This candlestick pattern precedes a correction or reversal of the current trade.
How Tweezers form
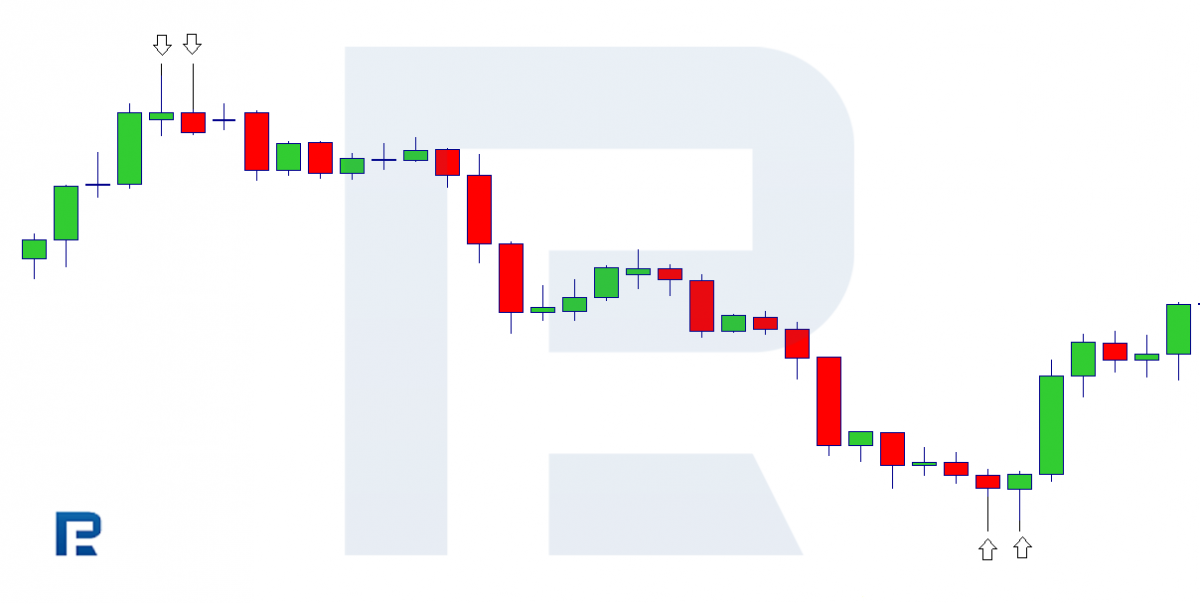
This candlestick pattern is a reversal one. It can be seen in the charts of various financial instruments: currency pairs, stocks, futures, etc. The pattern consists of two candlesticks that have the same highs and lows.
As long as Tweezers are a reversal pattern, they either appear at the top of the chart in an uptrend or at the bottom of the chart in a downtrend. The pattern is based on a classic tech analysis principle: if the price fails to reach over the support/resistance level twice, a correction or even a reversal become highly probable.
In Tweezers, the extremes of both candlesticks are on the same level. A minor difference of a couple pips regardless of the timeframe is admissible
Types of Tweezers
Depending on whether the pattern forms on the highs or lows, it can be called either Tweezers Top or Tweezers Bottom.
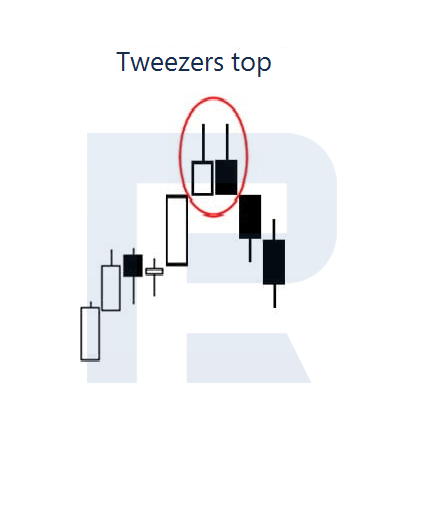
Tweezers Top
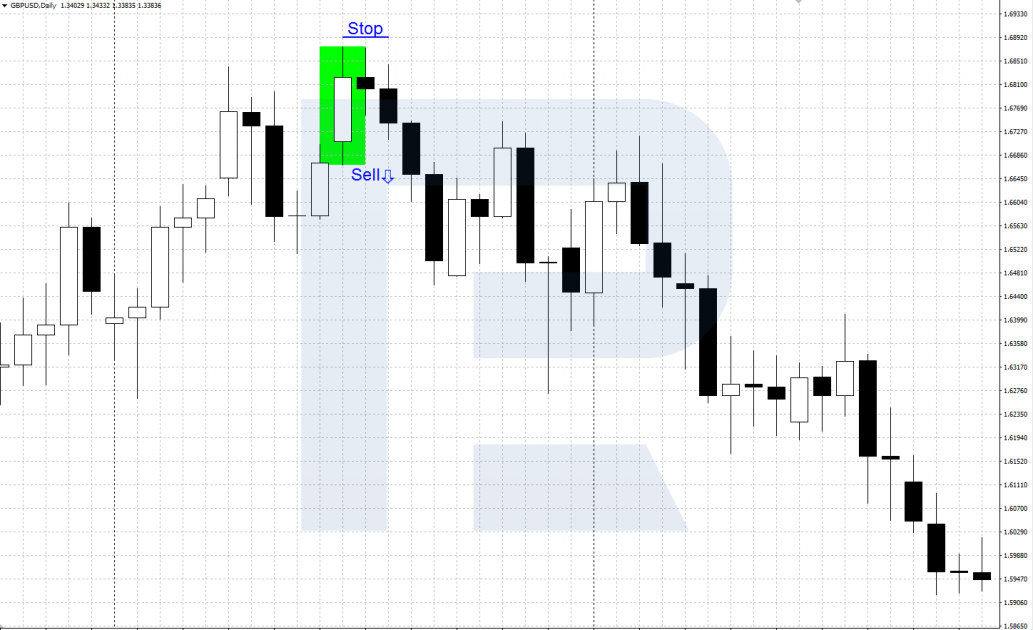
This is a bearish pattern that forms after an ascending movement on the local high of the price chart. The first candlestick of the pattern is normally bullish, with a white body and an upper shadow. The second candlestick of the pattern can have a large black body, or a small body of any color, or no body at all, being a Doji candlestick. Both candlesticks of the pattern have the same high.
In essence, at the second candlestick, the price bounces off a strong resistance level for the second time. This means that bears have collected forces and will be trying to capture the initiative. Further price movement downwards indicates a beginning correction. Falling of the quotations under the low of the completed pattern confirms the beginning of this correction.
Tweezers bottom
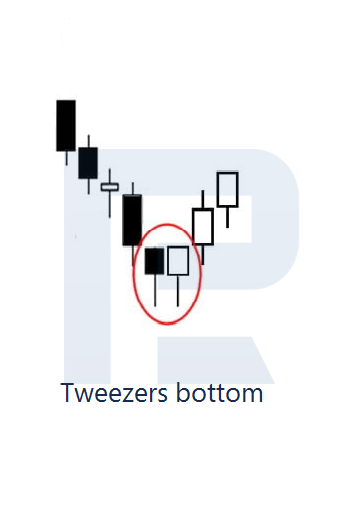
Tweezers Bottom is a bullish pattern that appears on the local lows of the price chart after a downtrend. The first candlestick is normally bearish, with a black body and a pronounced lower shadow. The second candlestick of the pattern can have a large white body, or a small body of any color, or no body at all, being a Doji candlestick. The candlesticks of the pattern must have the same low.
As the second candlestick forms, the price bounces off a strong support level for the second time. This means that bulls are eager to stop the decline and start advancing. Further growth of the quotations indicates the beginning of an ascending correction. Power of the bulls is confirmed by growth of the price above the high of the candlestick pattern.
Trading by Tweezers
Tweezers are a reversal candlestick pattern, hence, look for it at the high and lows of the price chart after an ascending or a descending movement, respectively. In a flat, this pattern is less efficient, avoid using it there. The larger timeframe, the better: start from H1. Almost any liquid asset with acceptable volatility will do.
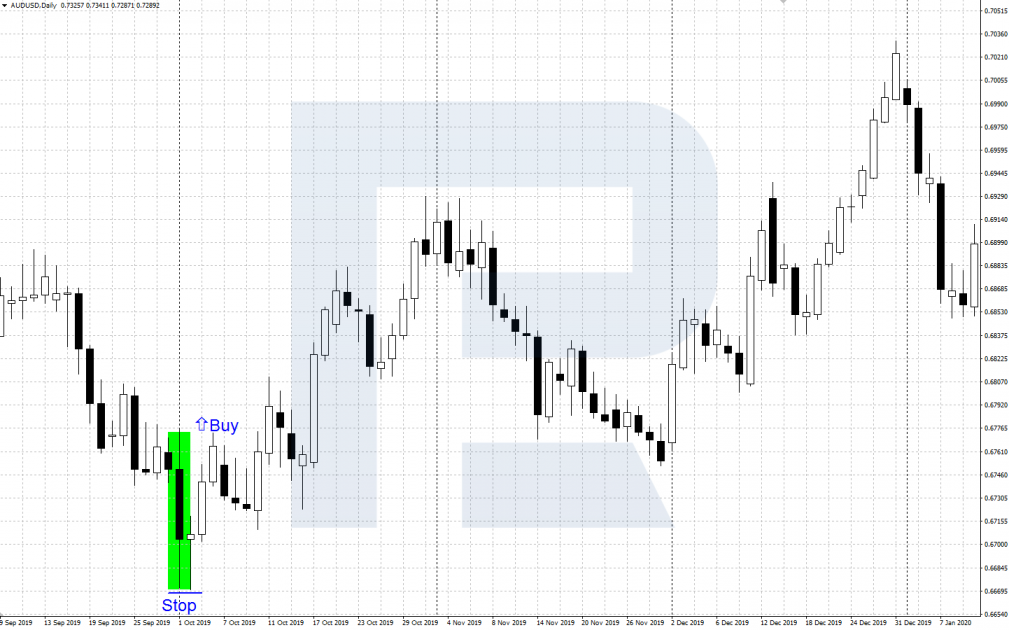
Tweezers Bottom: buying
The algorithm of trading by the bullish pattern is as follows:
- After a descending movement on the local lows of the chart, a reversal Tweezers pattern appears.
- When the quotations reverse upwards and rise over the highs of both candleeticks of the pattern, open a buying position.
- Upon opening your position, limit risks by a Stop Loss order a bit lower than the lows of both candlesticks of the pattern.
- To take the profit, use as headlines strong resistance levels or Fibo levels that show corrections, bouncing off the previous decline.
Tweezers Top: selling
The bearish pattern trades as follows:
- After an ascending price movement at the local highs a reversal Tweezers pattern forms.
- When the quotations go down and renew the lows of the candlesticks in the pattern, sell the asset.
- After opening the position, limit losses by a protective SL order above the highs of the pattern.
- To take your profit, check important support levels or correctional Fibonacci levels.
What enforces Tweezers
There are several factors that enhance the pattern, i.e. make it's signals more probable.
- A complete Tweezers pattern is simultaneously some other candlestick pattern, such as Engulfing, Clearance in Clouds, Dark Clouds, etc.
- One or both candlesticks of the pattern are Dojis that confirm general market ambiguity and precedes a correction/reversal.
- Other supporting signals of tech analysis or indicators.
Bottom line
Tweezers can be found on the local lows and highs of the chart after an ascending or descending momentum. It predicts a correction or even a reversal of the current trend. If there are some supporting factors, the probability of a decent correction grows.
Tweezers work well with tech analysis patterns, support/resistance levels, trading indicators. Before beginning real trading, practice on a demo account.
In more detail, other candlestick patterns are described in our blog.


