Getting Acquainted with the Pivot Points

8 minutes for reading
The history of the Pivot Points indicator began in the early 30s of the twentieth century when a mathematician and a that-time famous trader Henry Chase decided to create an indicator meant for the security market. The synonym for a pivot would be a reversal, so a pivot point is a level on which the price reverses. So, the basis of the Pivot Point indicator is the idea that the market takes everything into account and repeats itself with time. The indicator was created in such a way that the opening and closing prices may serve as the support and resistance levels in the future.
Thus, a trader who uses large timeframes draws levels and uses them in trading, passing on to smaller timeframes. For example, the levels are calculated for the D1 or older charts, while trading takes place on M30 or smaller timeframes. It is worth noting that the Pivot Points are not some particular numbers or prices on the chart but a range where the price belongs during some time. On the chart, the Pivot Points look like horizontal lines, the central line highlighted, while the support and resistance ones are dotted by default (the color and the style of the lines may be customized in the settings).

Below, we are going to discuss the practical use of the Pivot Points.
Pivot Points types
After Henry Chase developed the formula for Pivot Points calculation, some traders and analysts considered it not quite correct and developed their own formulae; the following list of Pivot Points types emerged:
- Traditional
- Classic
- Fibonacci
- Woodie
- Demark
- Camarilla
The principle of these Points is quite similar; however, certain differences exist. For example, the Traditional and Classic Pivot Points are rather similar, but their difference from the Demark type is significant.
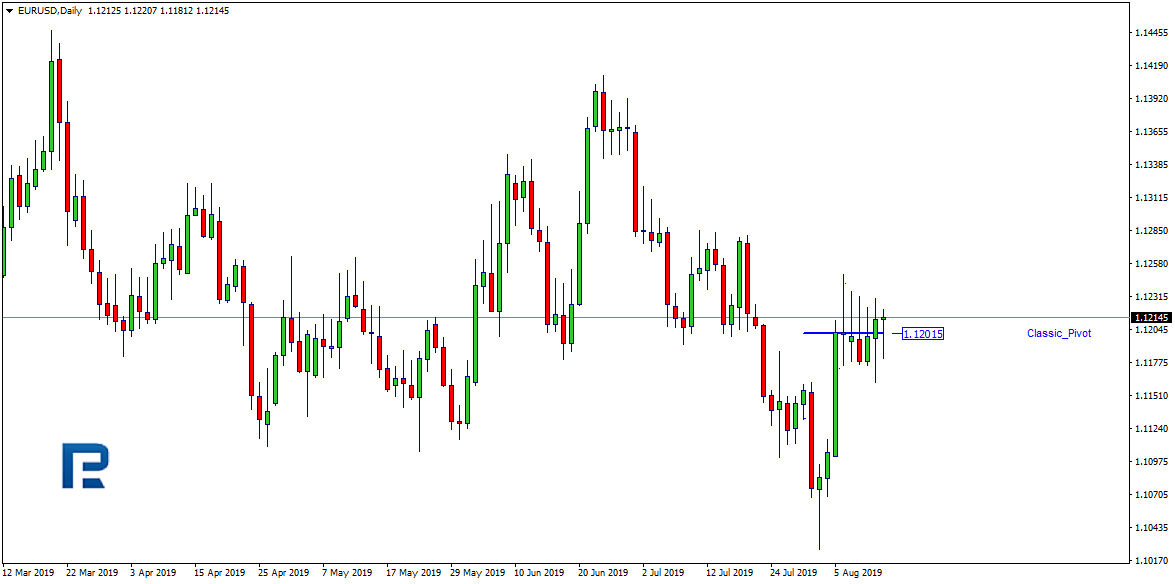
In this article, we are not going to discuss all variants of Pivot Point calculation; instead, we shall look at the traditional formula as Henry Chase designed it. Keeping in mind that the calculation can be carried out for any timeframe, we shall pick up D1. The main line is calculated as the average value of the closing price of the candlestick, its maximum and minimum.
Pivot (PP) = (High + Low + Close)/ 3.
Where:
- High is the yesterday maximum.
- Low is the yesterday minimum.
- Close is the yesterday closing price.
Calculations for other timeframes remain the same.
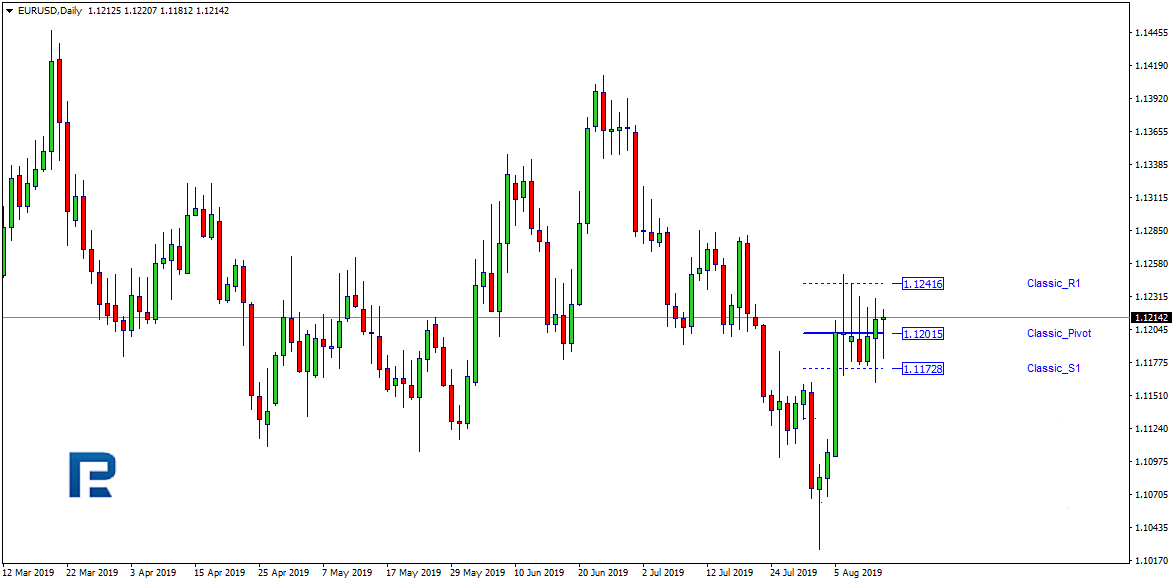
Then we calculate the support and resistance levels S1 and R1 and so on, basing of the data received.
Let us have a look at the formula:
S1 = (PP × 2) – High
Where:
- PP is a Pivot Point.
- High is the price maximum.
R1 = (PP × 2) – Low
Where:
- PP is a Pivot Point.
- Low is the minimal price.
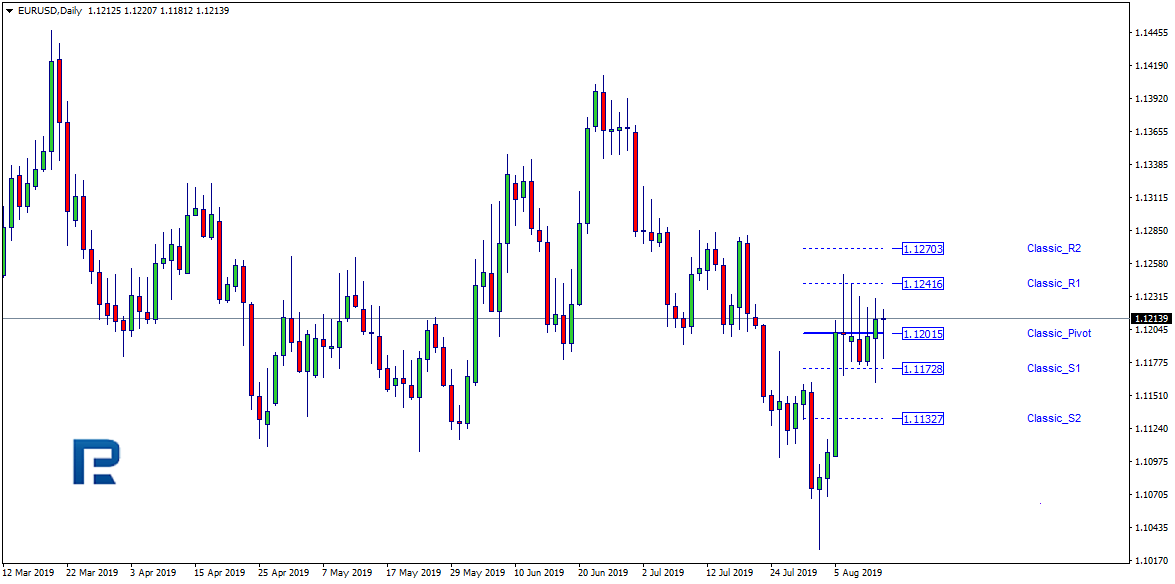
Next support and resistance levels S2 and R2 are calculated as:
- S2 = PP – Low – High
- R2 = PP + (High – Low)
Where:
- Low is the min price.
- High is a max price.
- PP is a Pivot Point.
S3, R3 formula are as follows:
- S3 = Low – 2 × (High – PP)
- R3 = High + 2 × (PP – Low)
Where:
- Low is the min price.
- High is a max price.
- PP is a Pivot Point.
In the traditional method of the Pivot Point calculation, three levels of support and resistance are used. Presently, there is not much reason in manual calculations, taking into account the level of computer technologies; there is plenty of indicators based on the Pivot Points that work independently in accordance with the trader's requirements. Some indicators can calculate more levels: S4, R4 and so on.
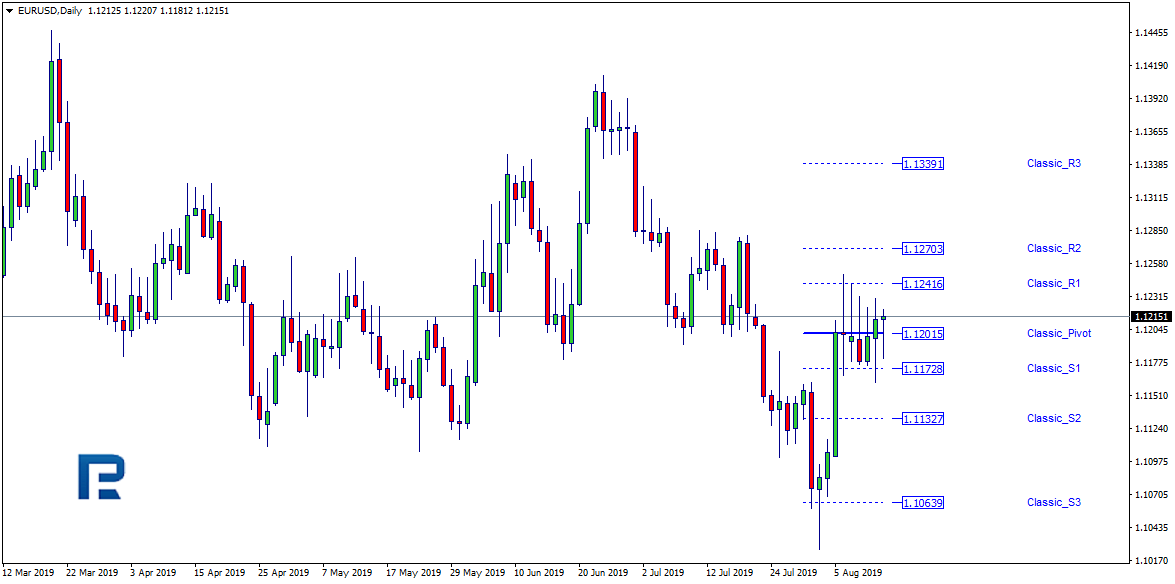
Application of the Pivot Points
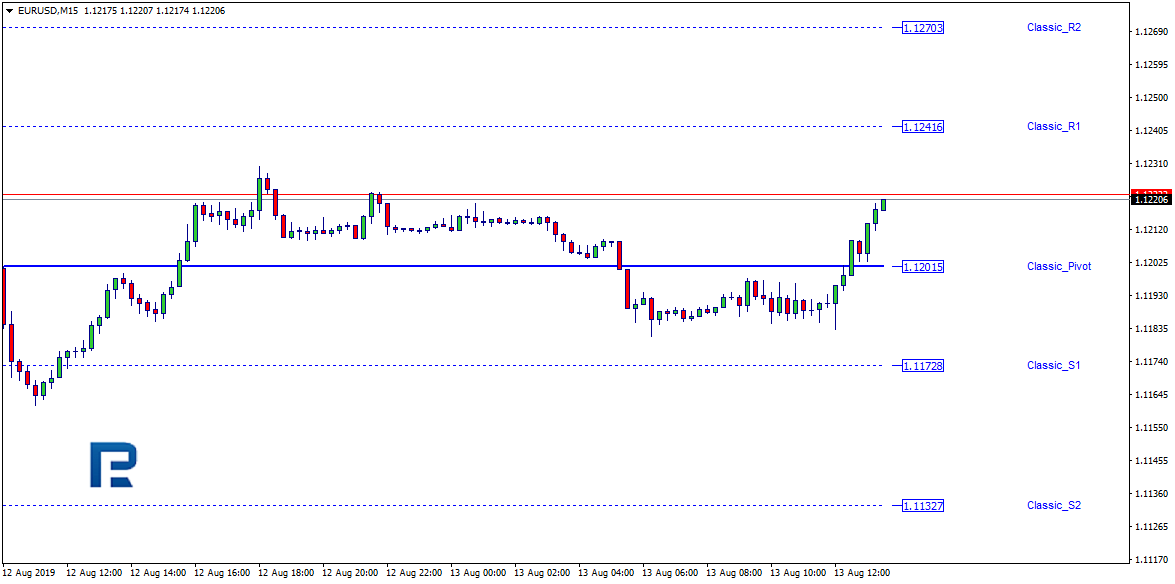
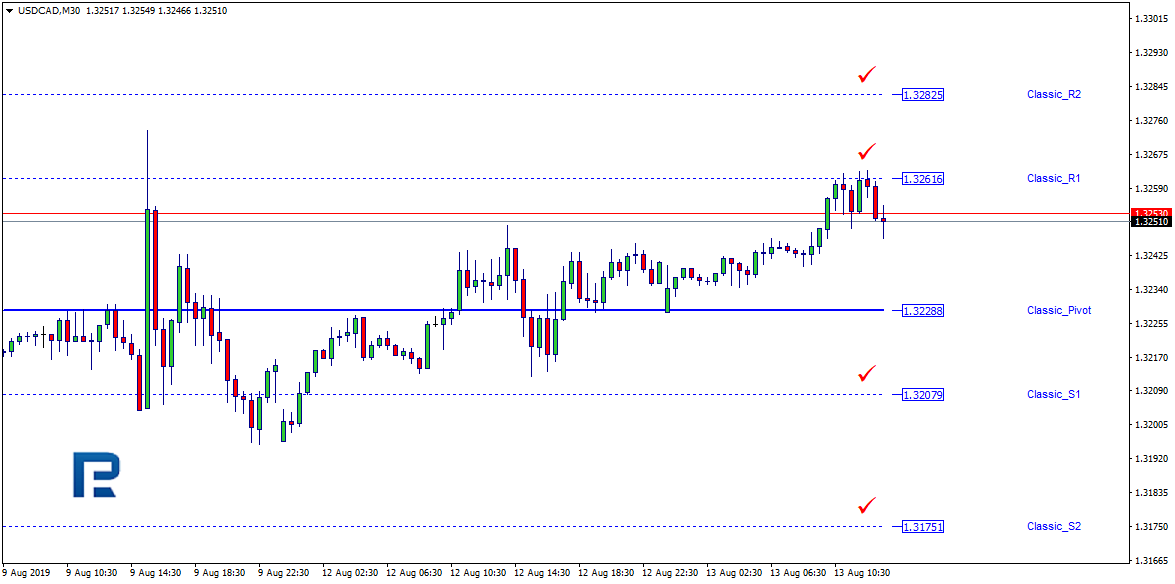
On the chart, let us apply an indicator with the points calculated on the basis of the previous D1 candlestick. The support and resistance levels appear. Then we switch to a smaller timeframe, such as M30. On this chart, we will see the resistance and support levels, which the price may consolidate around, bounce off and break through during the current trading session. A larger chart may be used, such as a weekly W1 or monthly MN. Application of various settings and timeframes depends on the trader's preferences, their goals and tasks.
At present, there are quite a lot of trading strategies using the Pivot Points; it would be hard to discuss all of them in one article, that is why we shall have a look at some of the most popular ways of trading with the Pivot Points.
For trading, we usually combine different indicators with the Pivot Points. Such indicators might be the Stochastic, the reversal candlestick patterns Pin Bar, Shooting Star, Hanging Man, Hammer, Inverted Hammer, Gravestone Doji, Dragonfly Doji.
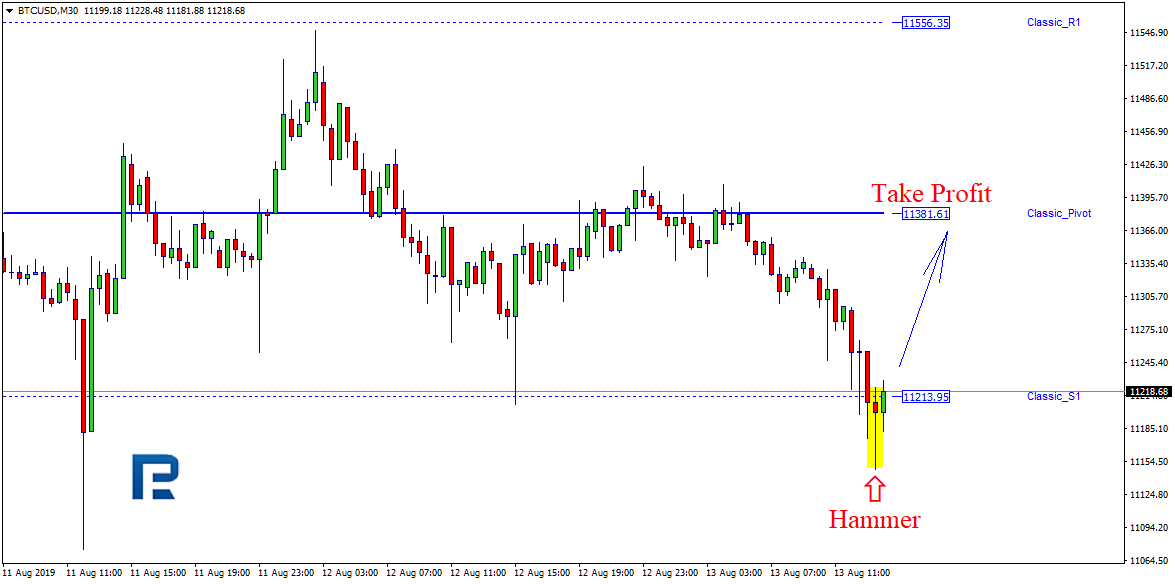
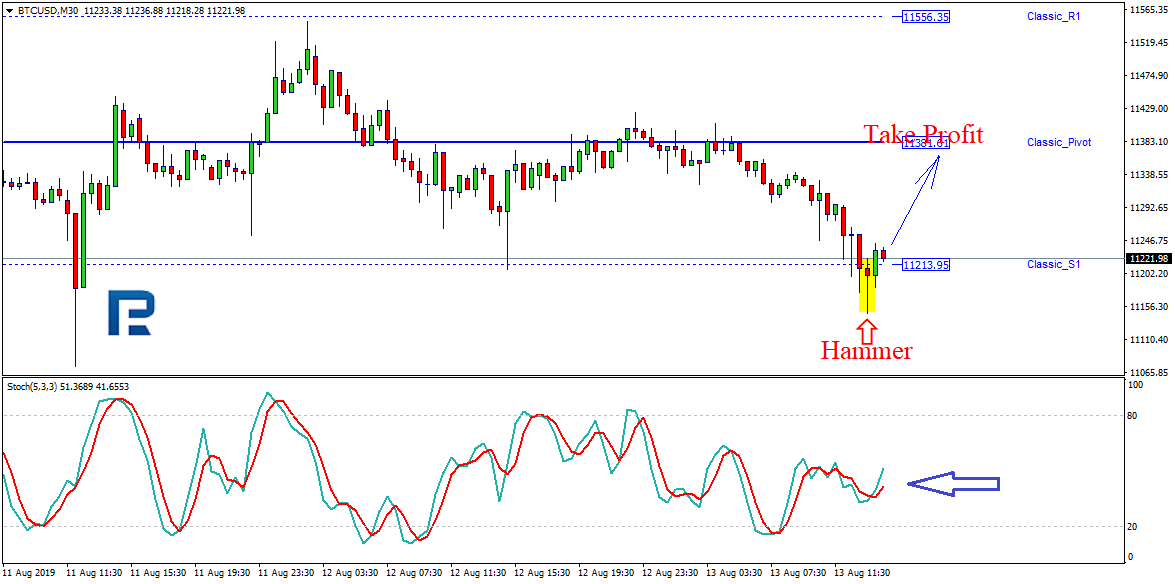
Let us discuss the history of a trading strategy based on the Pivot Points and the reversal candlestick patterns without additional indicators; buying from the support level S1.
On M30 the pair has formed a Hammer at the support level S1. Upon closing of the reversal Hammer and opening of the next candlestick the trader opens a position to buy (Buy); the trade should be closed at the main line of the Pivot Points named Classic Pivot. The Stop Loss in this situation is to be placed at the minimal value of the Hammer (Low). Then the position will be closed upon reaching one of the orders (Take Profit or Stop Loss).
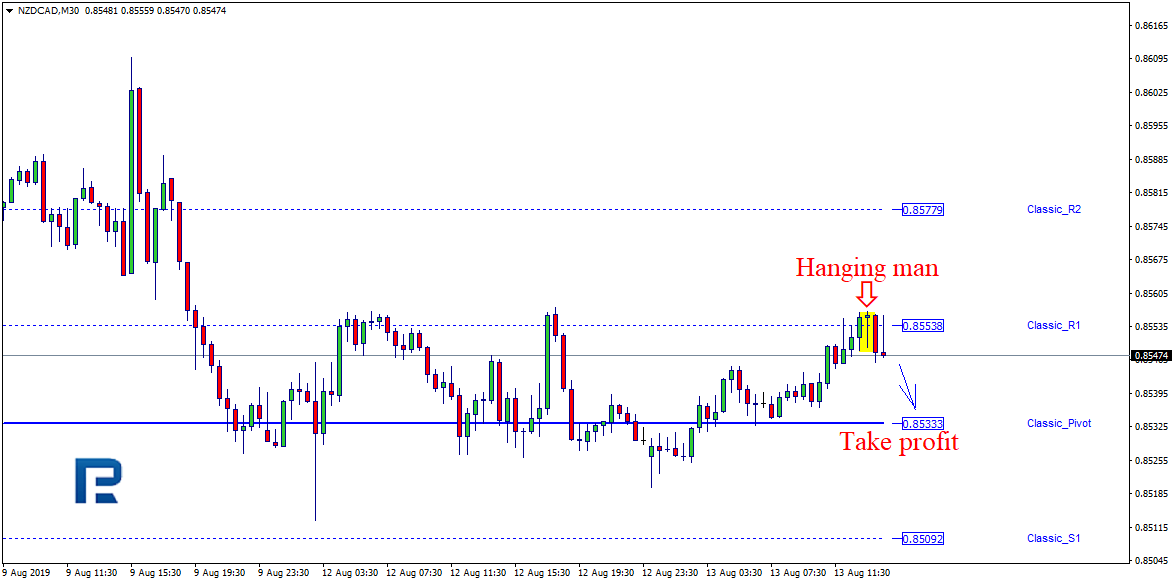
This strategy is rather easy to use but requires good knowledge of the classic candlestick analysis or the trading strategies Price Action or Pin Bar. No doubt any trader will form their own opinion about this strategy as it has both advantages and drawbacks. According to the author of this strategy, in case of a serious approach to studying the candlestick analysis, the Pivot Points may be really helpful when finding entry points to a trade without additional filters. Opening positions by the levels S2, S3 is based on the same principles but the landmark for the Take Profit will be the next level. Selling from R1, R2, R3 happens the same way, only mirror-like.
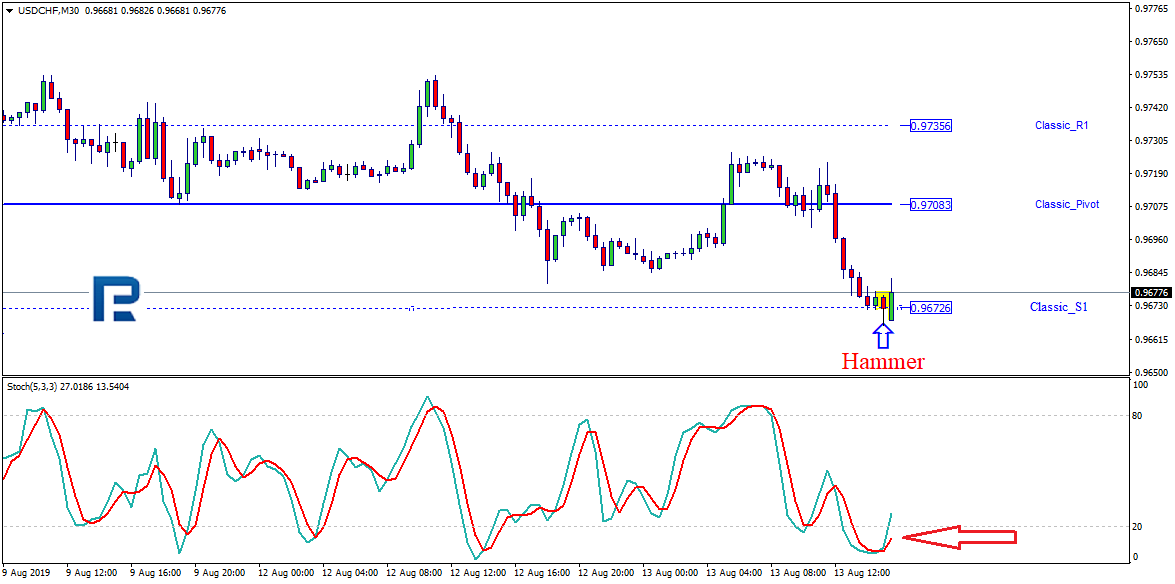
For those who prefer several indicators on one chart at a time, there is an interesting and rather easy trading strategy based on the previous principle of reversal patterns, only as an additional filter, we add the Stochastic with basic settings. In this case, the overbought or oversold areas on the Stochastic, forming near the support or resistance levels and drawn by the Pivot Points indicator, will serve as an additional signal to open a position.
Let us continue discussing entrance on the previous drawing, only with the Stochastic Oscillator added as a supplementary filter. As we may see, the Stochastic did not show an oversold area around the Hammer formation, which means we have not received a confirmation of entrance, hence, opening a buying position is not recommended. Adding indicators as filters reduces the number of trades but never deteriorates trading quality.
In picture 11 we can see a signal complying with the criteria for opening a buying trade. There is a reversal Hammer pattern formed near the support level S1, the Stochastic is in the oversold area below 20; all conditions for opening a buying trade are there. The landmark for the Take Profit is still the main line of the Pivot Points indicator on the Classic Pivot chart; the Stop Loss is placed on the minimal value of the Hammer.
As we may judge by the examples, the trading strategies discussed above are rather simple; however, they have a minor drawback: opening signals appear not as often as many traders would like them to. On the other hand, the rarer the signals, the more reliable they are considered to be. Some think that if the price is below the main line of the indicator, the market trend is descending, while if it is above the control line, the trend is ascending.
We have discussed the principle, the formula and some application options of the Pivot Points indicator. As said above, trading strategies that include this indicator are numerous, and new ones are likely to appear regardless of the indicator being nearly a hundred years old. Now we only have to discuss the advantages and drawbacks of the indicator. Among its weak sides, we can name several ways of calculation, which may perplex a trader, making them doubt about the efficacy of each. Moreover, if we base the calculations on D1, the current data may be invalid for the next trading session.
Advantages and disadvantages of the Pivot Points
The disadvantages of the Pivot Points include several calculation options, which is misleading about the question - which is better, useful and more accurate. If you apply the indicator calculated according to D1, then the current data may not be relevant at the next trading session.
The advantages are:
- simplicity,
- mathematical calculations based on particular prices,
- compatibility with different timeframes,
- shows price potential,
- opportunity of using pending orders.
The Pivot Points indicator is, no doubt, a rather strong means of market analysis, and may be useful for a beginner as well as experienced traders.


