How to Trade Pin Bars: Forex Strategy Review

8 minutes for reading
Candlestick analysis has been applied to financial markets since long ago. Some candlestick setups are used with indicators; some are considered less trustworthy than the others. Today, we shall try to master a candlestick pattern called Pin Bar, which is a part of the trading strategy Price Action. With time, it has become an independent trading strategy, successfully applied not only on Forex but also on the stock market. At the end of this article, we shall try to make some conclusions about the advantages and drawbacks of this strategy; meanwhile, we shall discuss what is the Pin Bar, the conditions of its forming and application options for trading and market analysis.
What is a Pin Bar pattern
Many people, looking at the Pin Bar pattern will call it candlesticks from the classic analysis; it is true, to some extent, but there are certain peculiarities in the conditions of the Pin Bar formation, which make it different from classic candlesticks. The Pin Bar pattern may be called a Shooting Star or a Hammer depending on the place of forming; in their turn, the Shooting Star and Hammer candlesticks in some cases may not be a Pin Bar. Now to the peculiarities of the Pin Bar.
Having spent a lot of time analyzing charts, I came to certain conclusions about the Pin Bar peculiarities. The first condition for their formation is a good support or resistance level, and the trader has certain freedom here. Provided the trader has enough knowledge and experience of technical analysis, they can define the support and resistance levels rather easily. However, if the experience in technical analysis is not enough, indicators of the levels may be used. For example, the trader may use the Moving Averages with different settings; practice shows that the longer the period used, the stronger the level and the higher the possibility of the signal execution. Other indicators might be the Pivot Points, Bollinger Bands, Fibo and others showing the support and resistance levels.
How to find a Pin Bar on the chart?
In the classical variant, it forms near the support or resistance levels the following way: a directed price movement (an impulse) emerges from 2 or more candlesticks, then a Pin Bar forms around the support or resistance level; it has a long shadow in the direction of the main price movement, a small body and an also small shadow in the opposite direction. The signal will be enforced by several additional factors of the Pin Bar formation:
- The Pin Bar body has been opened and closed inside the body of the previous candlestick or it lacks a body completely (Gravestone Doji or Dragonfly Doji).
- The Pin Bar has been opened and closed with a price Gap.
- The colour is opposite to the impulse direction.
- The longer the directed price movement has been, the steeper the reversal after the Pin Bar.
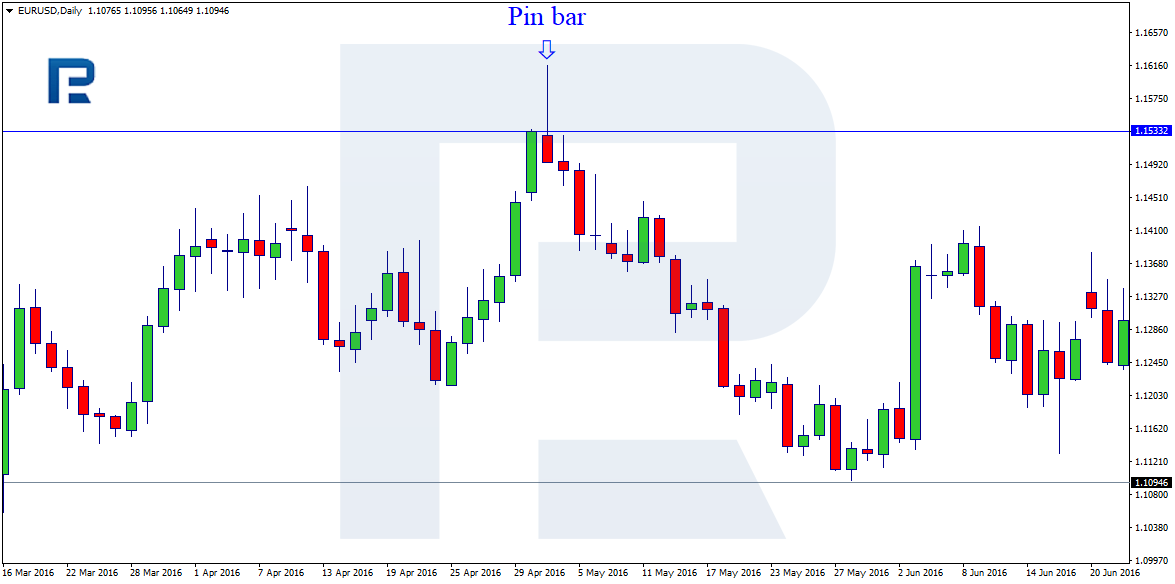
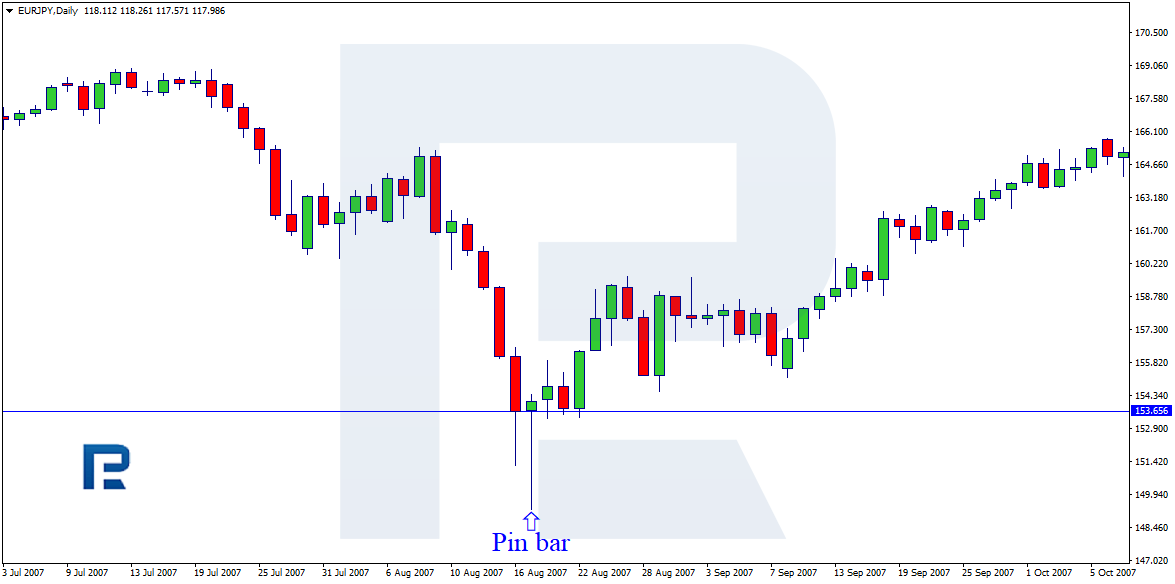
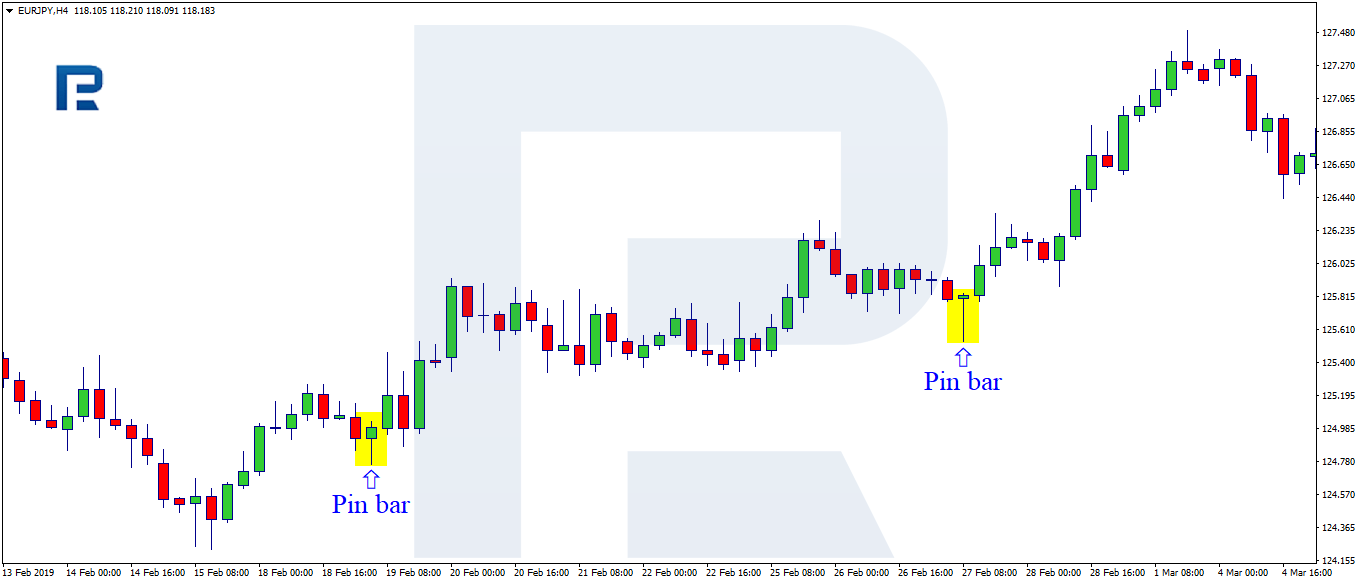
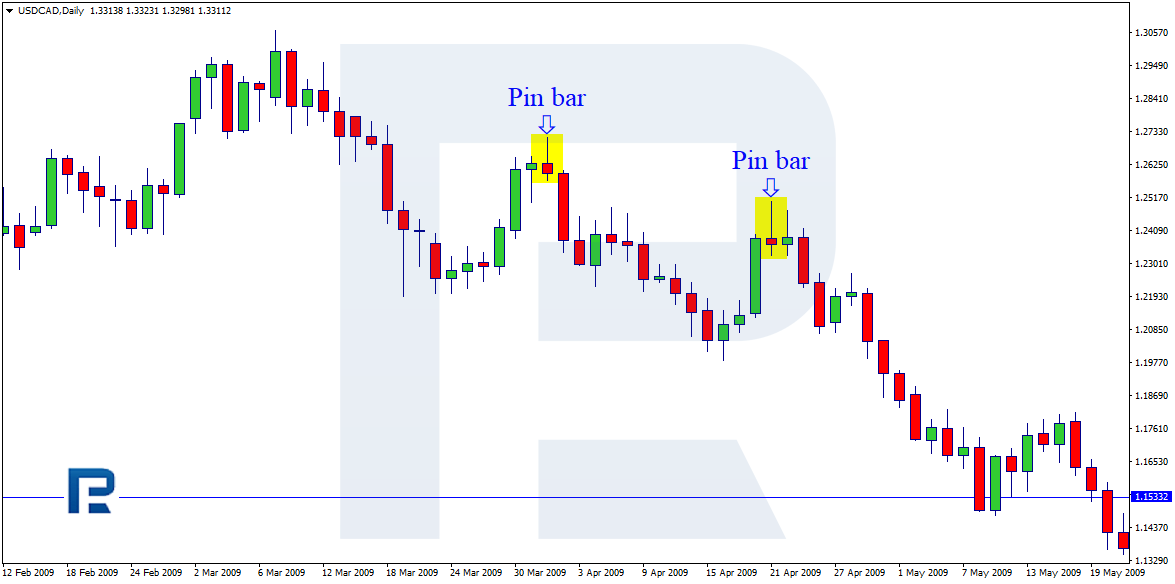
The classic Pin Bar forms on the critical support/resistance levels at the maximal/minimal values in the places where, theoretically, the trend may end. However, there are more options for the Pin Bar formation, which are the places of the trend correction. On the chart, it will look the following way. After a long-time growth, the price makes a pullback for several candlesticks; in the critical point of the correction a Pin Bar forms, signaling the completion of the pullback; then the pair continues the growth along with the main impulse. In such a case the Pin Bar may form with certain errors; however, the trader experience will help define it.
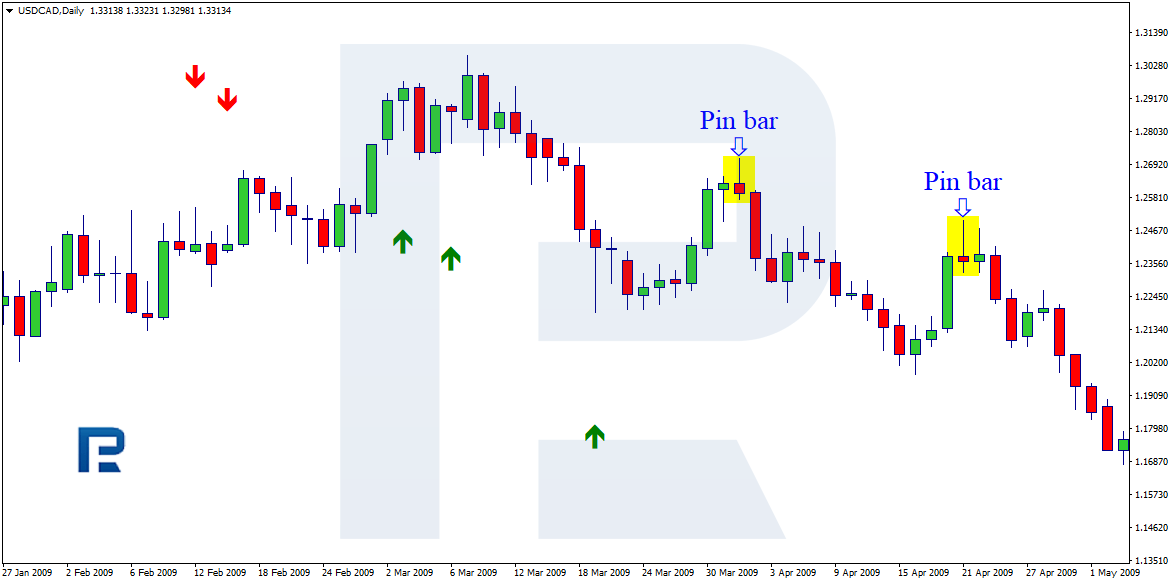
There is a good deal of indicators meant for a better definition of candlestick patterns on the chart. All of them have their drawbacks and advantages; I insist there are more drawbacks. In the picture below you can see two indicators downloadable for free from the MT4 market. It seems correct to remain discreet about their names.
The first one has defined some candlesticks as Pin Bars, though they do not comply with the conditions of the Pin Bar formation or the description of this pattern. It has marked it red and green arrows but has skipped the real Pin Bars. As they say, draw your conclusions.
The next indicator has also shown some candlesticks that are not in compliance with the Pin Bar description. They are marked red and green arrows, but the real Pin Bars remain undetected.
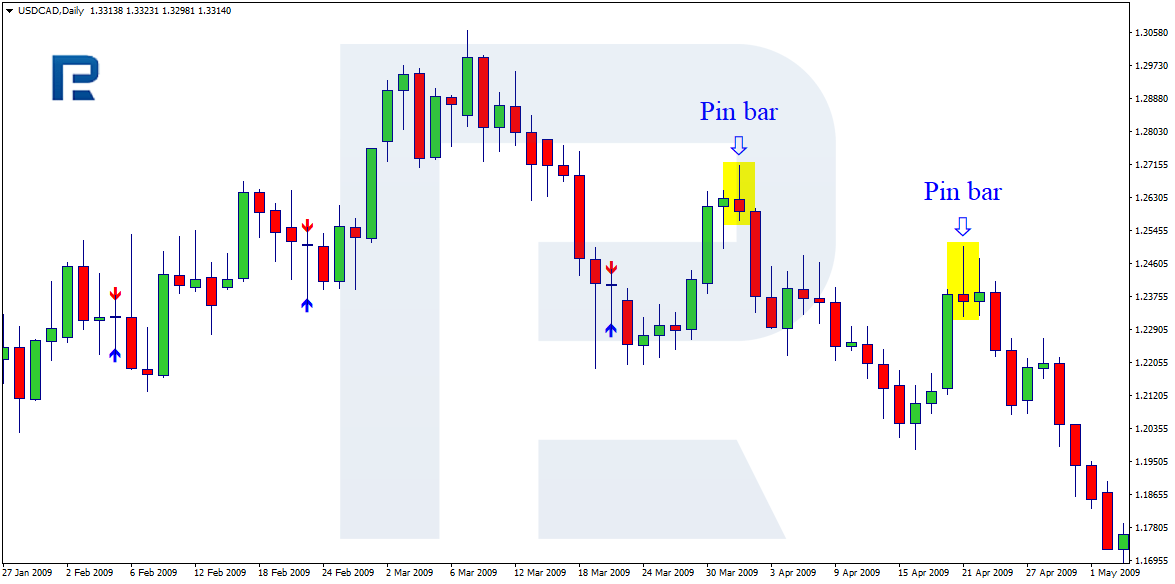
No doubt, these indicators may help someone in trading, for example, in defining the entry points; however, to my mind, they may be perplexing, especially for those traders who have just got acquainted with the Pin Bar strategy. For this review, I have used two downloadable free indicators, and my opinion may not be applicable to other indicators, including payable ones. It is rather likely that on the Internet one may find some indicators, clearly showing the real Pin Bars; anyway, all indicators cannot physically be discussed in this review.
What are Pin Bar trading options


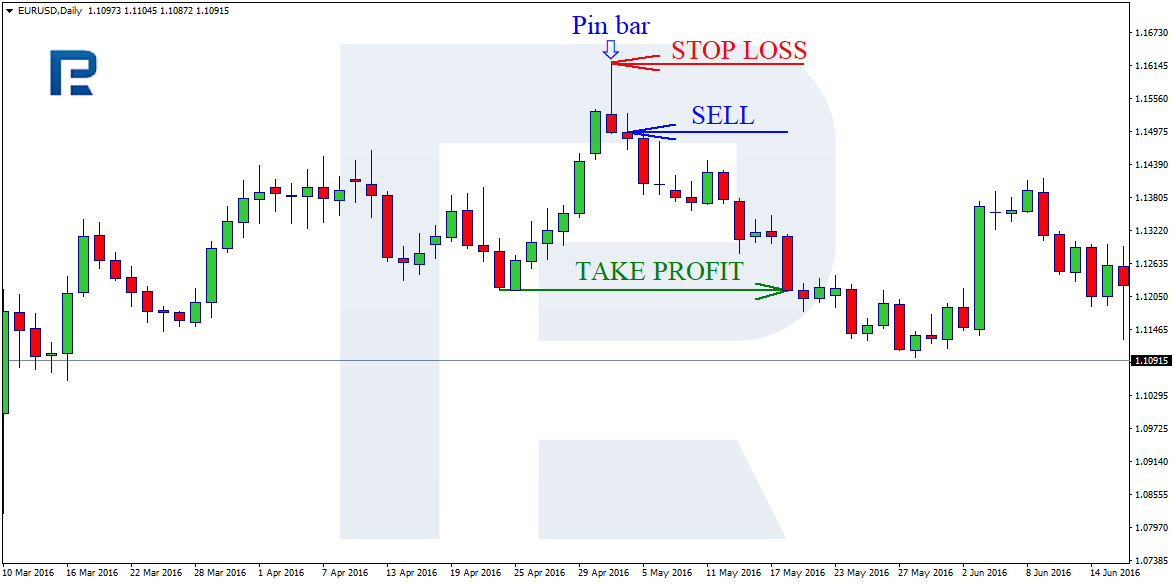
Classic trading
Classic trading looks the following way:
- A Pin Bar candlestick forms on the chart.
- Tag the support and resistance lines in compliance with the history and the conditions of the candlestick formation (discussed above);
- Determine the potential of the movement in order to calculate the Take Profit, which will be the closest support or resistance level.
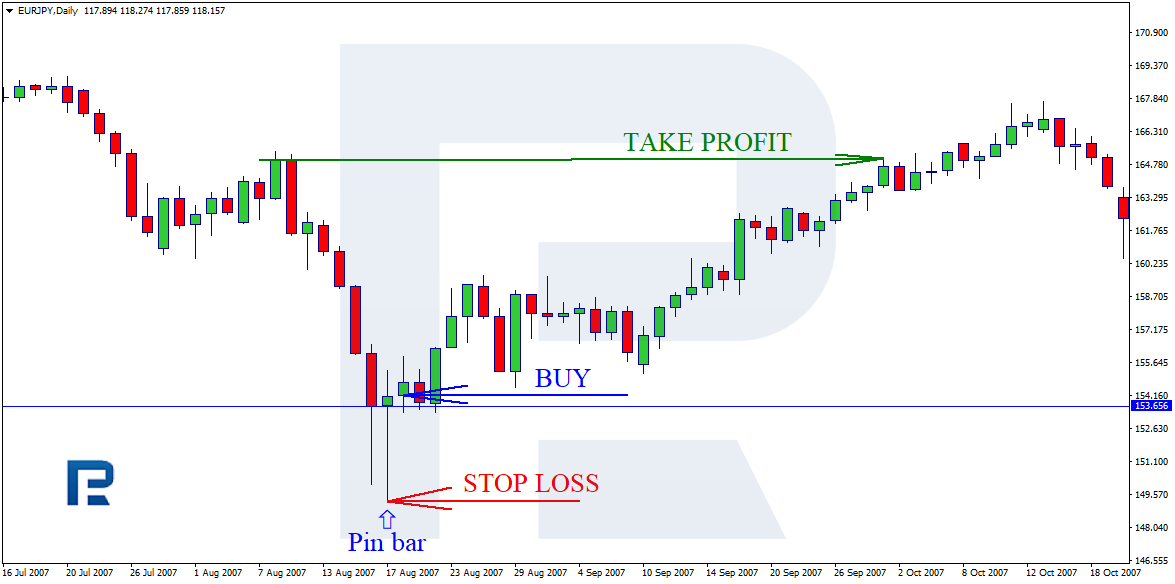
- Enter the trade upon closing of the candlestick that we have defined as the Pin Bar.
- Then detect the place of the Stop Loss, which will be the maximal or minimal value of the Pin Bar depending on the place of its formation.
The Pin Bar trading strategy may be used together with the automatic Trailing Stop as well as the Stop Loss may be transferred in the black manually, which increases the profit significantly. When entering the position on the maximums or minimums, there is a good chance to gather all the upcoming movement. At the same time, you should remember (for successful money management) that on the timeframes older than the H4 the Stop Loss will be rather large.
Now let us discuss several Pin Bar strategies involving indicators.
Using Moving Average for Pin Bars
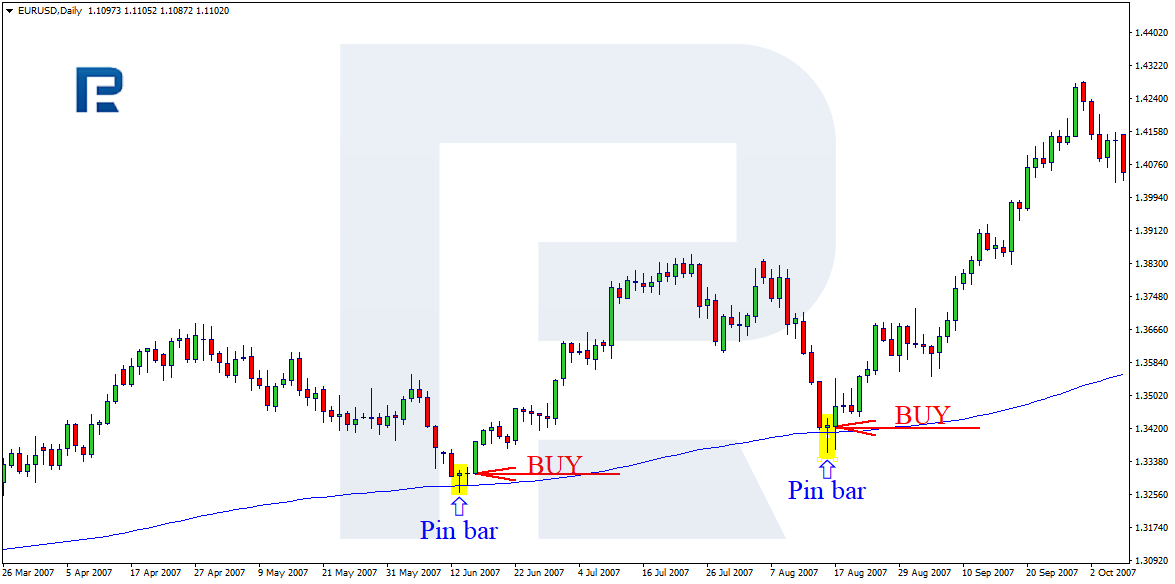
The simplest option, known by both beginners and experienced traders, is the Moving Average. On the chart, draw an Exponential Moving Average with the period 200 (the settings may be changed in accordance with the traders preferences and the situation, in particular, the volatility of the pair and the timeframe). The EMA will act as some sort of a resistance or support line. In this case, we are waiting for a bounce off the EMA. Signals are most likely to come on the pullbacks from the main trend. In all cases of the Pin Bar trading, Stop Losses are placed either on the maximums or minimums of the candlestick.
Using Bollinger Bands indicator for Pin Bars
The next example is trading with the use of the Bollinger Bands. As long as the Bollinger Bands are an upgraded Moving Average, the principle of entering a trade will be similar to entering it with the MA. The price reaches the lower or the upper border of the indicator and forms the Pin Bar pattern. Then the trade is entered for buying or selling; the landmark for the potential profit will be the price reaching the opposite line of the indicator; meanwhile, the potential for entering the trade is rather hard to calculate as the indicator is not drawn further. However, as the history and practice of using this combination in trading shows, the possible loss to the potential profit ratio is more than 1:3 (3 points of the potential profit to 1 point of the possible loss).

When using the Fibo or Pivot Points as supplementary instruments of defining the support and resistance levels, similar principles of trading. Most often, the trade is entered on the bounce off the levels.
Summary
Trading with the use of candlestick patterns is rather widespread among traders; however, it should not be forgotten that no indicators or candlestick patterns are yet able to give a 100%-trustworthy entrance point. Everything depends on the conditions of the trading situation. The Pin Bar strategy has been long used on the market, having equally its fans and haters.
I suppose that both groups are right to some extent, and each trader should make their own conclusion upon studying the characteristics of the Pin Bar strategy. As for my experience, this strategy works not only on classic larger timeframes as H4, D1 and higher but also on the small M5, M15. The difference will be in the size of the potential profit and the time of the lifespan position. When trading on D1, an open position may last for several months.