Testing the Strategy Three Moving Averages

4 minutes for reading
The Moving Averages are one of the oldest indicators on the market. It is considered to have brought market players the most money in the history of trading. This is a trend indicator that works well in the situation of a good move on the market.
Like many other indicators, the MAs were initially designed for the stock market but in the modern circumstances, they work equally well for the financial markets.
There are several ways of using the MAs: some traders add just one line to the chart, some prefer a combination of the MAs for a clearer result.
About the strategy Three MAs
This instrument is quite easy to use. If the price is higher than the MA, the trend is ascending, and we are watching out for the signals to buy. And if the prices are lower than the MA, the trend is descending, so we should look for the signals to sell only.
In our strategy, we will use three MAs with different periods. One we will use for trend definition and the remaining three – for the entry and exit signals in the current trend.
A flat will be a hard task: the prices will keep crossing the line, and we will receive lots of false signals. In such moments, it is important to control risks and abstain from increasing the lot size. As soon as a strong trend begins, all the losses will be played back.
The parameters of the Three MAs
We are trading the strategy on H1 but smaller or larger timeframes can be used. For normal work, you need to prepare the chart and add the following necessary instruments to it:
- EMA (65) – Exponential Moving Average with period 65. Drawn on Close, color red.
- EMA (15) - Exponential Moving Average with period 15. Drawn on Close, color blue.
- EMA (5) - Exponential Moving Average with period 5. Drawn on Close, color orange.
Signal to buy
For the signals to buy to form in our system, the following rules should be followed:
- The prices are above the red EMA (65), which will signify an uptrend at the current moment.
- The orange EMA (5) crosses the blue EMA (15) from below – this is a signal to buy.
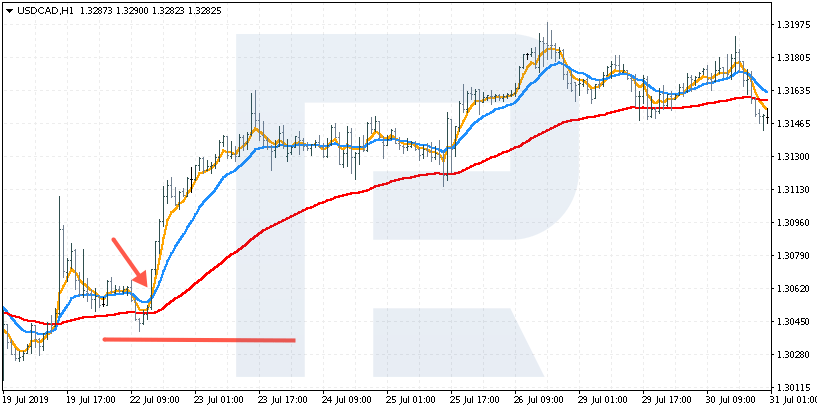
Let us have a look at the example with the USD/CAD pair. As we may see, the prices are above the red EMA (65), which signifies an uptrend.
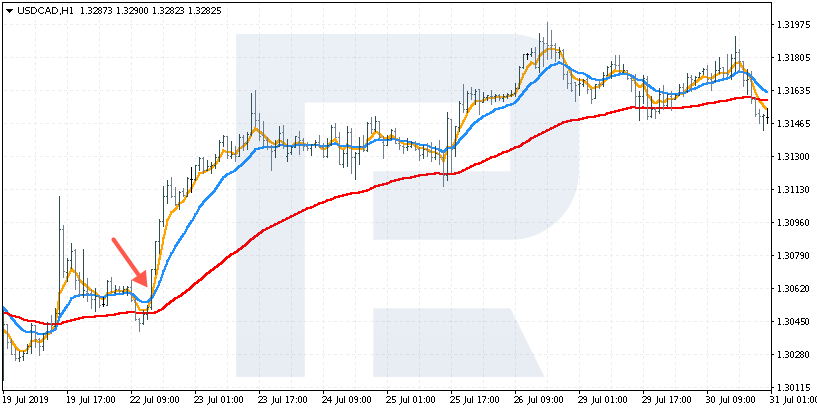
The quick EMA (5) has crossed the EMA (15) from below, which suggests a market entry. The protective SL is put behind the minimum closest to the crossing.
Signal to sell
For the signals to sell to form in our system, the following rules should be followed:
- The prices are below the red EMA (65), which will signify a downtrend at the current moment.
- The orange EMA (5) crosses the blue EMA (15) from above – this is a signal to sell.
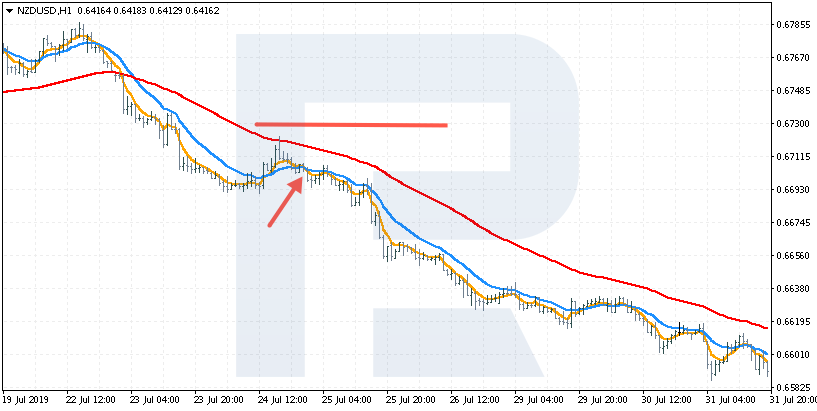
Let us have a look at the example with the NZD/USD pair. As we may see, the prices are below the red EMA (65), which signifies a downtrend.
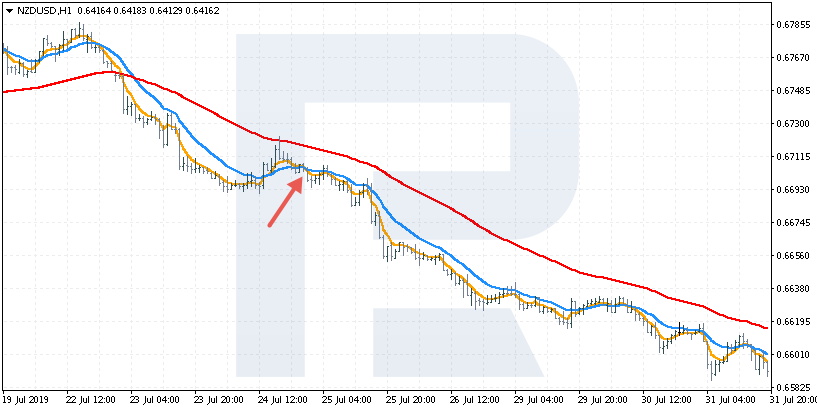
The quick EMA (5) has crossed the EMA (15) from above, which suggests a market entry. The protective SL is put behind the maximum closest to the crossing.
Closing trades in the Three MAs strategy
Positions are closed with a profit at the moment of the second (reverse) crossing of the EMAs 5 and 15.
If we are in an uptrend, for a close with a profit we need the EMA (5) to cross the EVA (15) from above. This will signal to close.
And if the trend is descending, it is important that the EMA (5) crossed the EMA (15) from below. This will signal to close.
Summary
The drawback of the system is the lagging of the indicator so that the trader loses part of the movement. We cannot asses the profit to loss ratio in advance either; we have the point for a Stop Loss but the position will be closed only after a signal for it. For this latter signal and the entry signal not to be missed, we have to watch the chart all the time.
The trading system based on the three MAs is a simple system with clear rules of market entry and position closing. It is very easy to asses the effectiveness of the strategy historically on the charts. Another advantage of the strategy is that it goes along with the trend which is important for a beginner.
The MAs work well with oscillators such as the RSI and even the Stochastic. They will act as an additional filter for the market entry signals. Anyway, the MAs will be a good start for a trading system.


