How to Trade the “Two Moving Averages + Fractals” Strategy

5 minutes for reading
In this overview, we will describe the simple medium-term swing trading strategy “Two Moving Averages + Fractals”. We will explain how it works, how to set the indicators, and how it can be used in trading.
What is swing trading?
Swing trading is a medium-term trading style that implies working with various financial instruments over the course of a few hours to a few weeks. As a rule, swing traders open trades in the direction of the current trend to catch the price movement momentum after the end of a local correction. In their search for trading opportunities, swing traders mainly use technical analysis.
How the “Two Moving Averages + Fractals” strategy works
The strategy uses two moving averages (Moving Average, MA) – the EMA (10) and SMA (30) – to confirm the trading direction and search for trading signals. The MA indicator has long been considered a simple and effective tech analysis tool, which tracks trend movements well. To pinpoint entry and exit points on the price chart, the strategy also uses Bill Williams’ Fractals indicator.
How the strategy works:
- To find buy signals, the trader needs a downward correction after an upward price impulse. The EMA (10) must be above the SMA (30), confirming the uptrend. During the correction, the price should fall to the SMA (30) and form an uptrend reversal with the formation of a lower fractal – this will be a signal to buy
- To find sell signals, the trader needs to wait for an upward correction after a downward price impulse. The EMA (10) must be below the SMA (30), confirming the downtrend. During the correction, the quotes must rise to the SMA (30) and form a downward reversal with the formation of an upper fractal – this will be a signal to sell
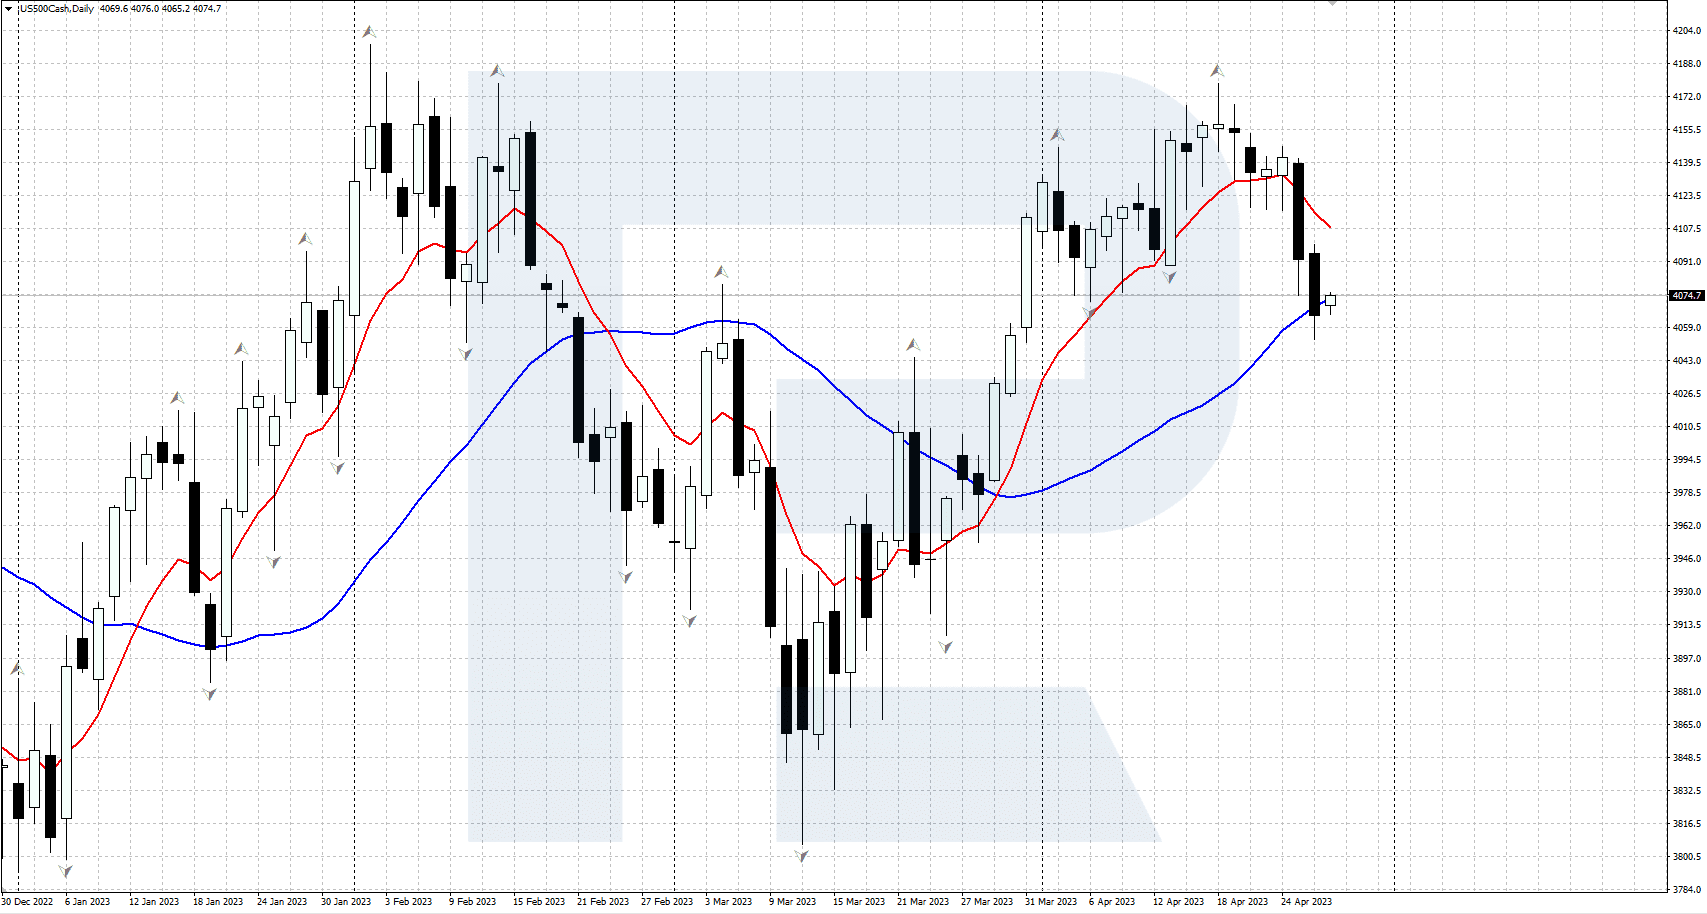
It should be noted that the Two MAs + Fractals strategy is particularly suitable for trading various financial instruments. The recommended timeframes on the chart are H1, H4, and D1. Trades are made in the direction of the trend at the end of the correction.
How to install the Moving Average and Fractals indicators
To install the indicators on the popular trading platforms MetaTrader 4 and MetaTrader 5, follow the process below:
- Open the terminal and log in to your account.
- Select the chart of your desired instrument.
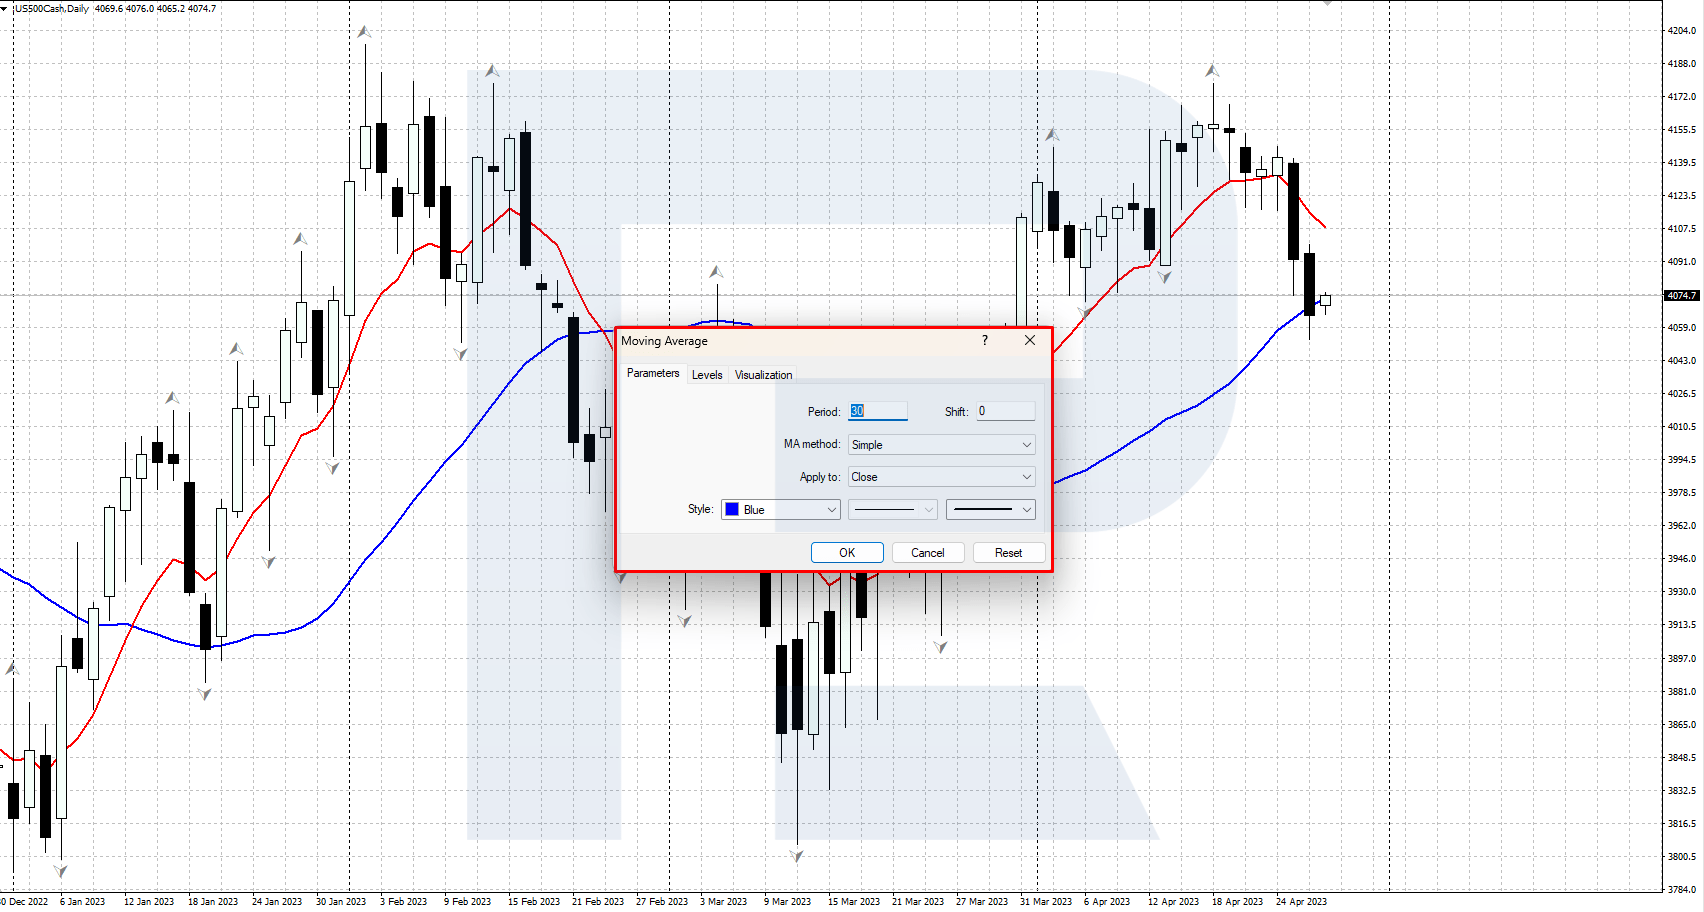
- From the Main Menu, go to – Insert – Indicators – Trend, and then click on Moving Average.
- In the settings window that appears, select the period 10, the colour and width of the line, MA method – Exponential. Click OK to apply the parameters and close the settings window.
- Repeat the actions above but in the settings window select the period 30, the colour and width of the line, and the MA method – Simple. Click OK to apply the parameters and close the settings window.
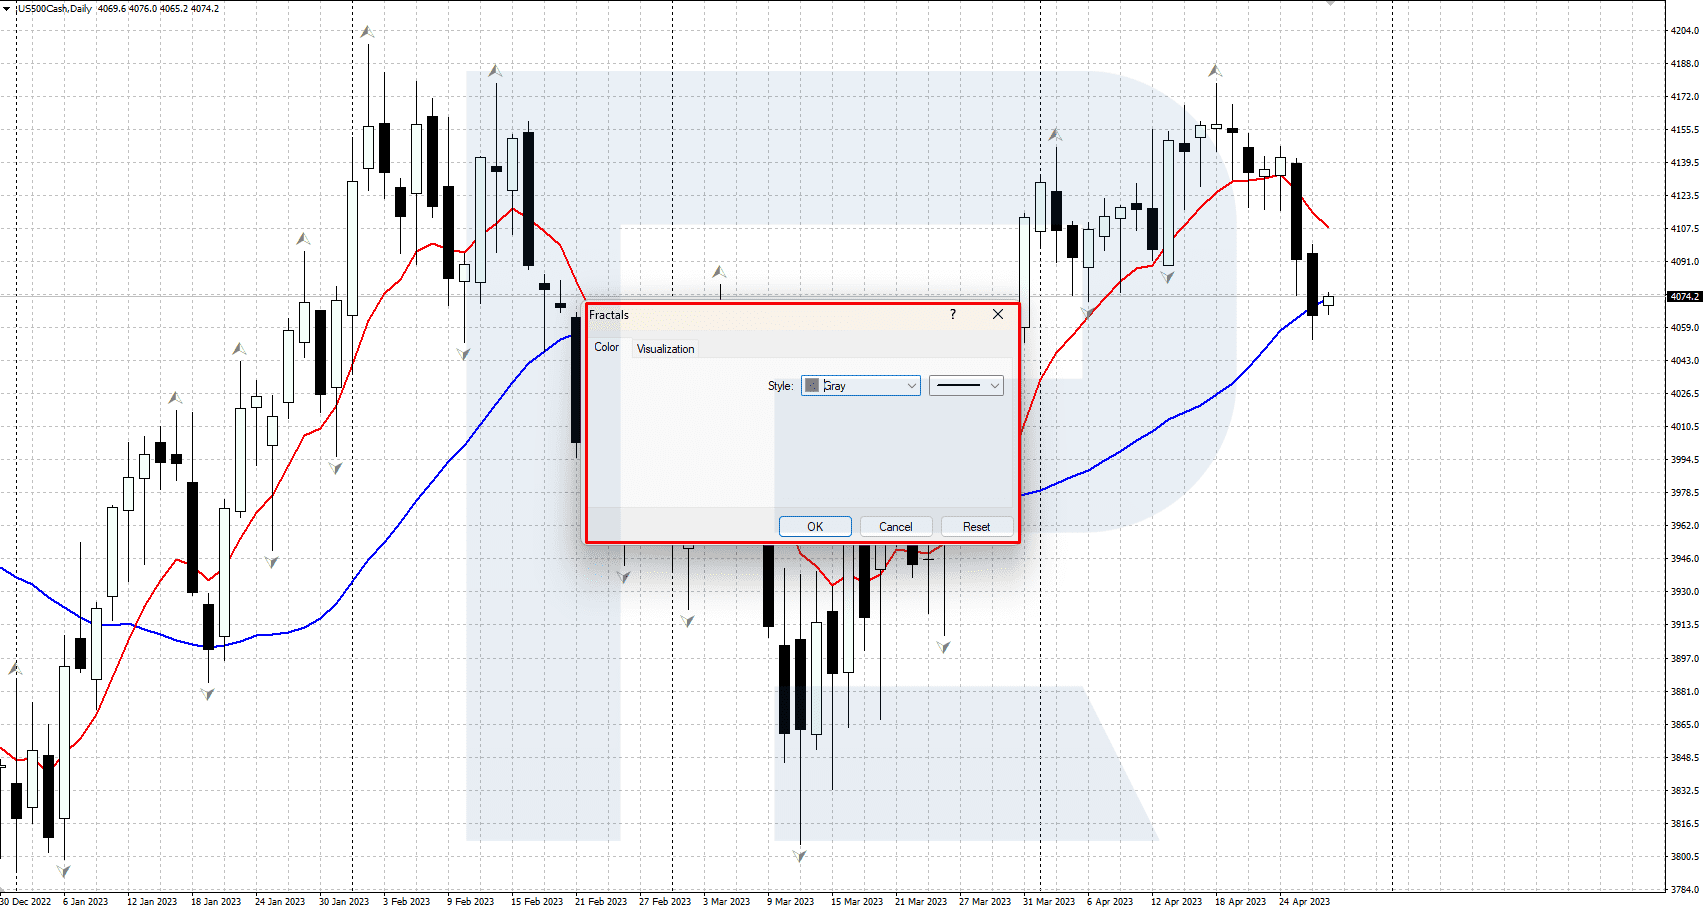
- Go to the Main Menu – Insert – Indicators – Bill Williams, choose Fractals
- In the setting window that pops up choose the colour and size of the fractals; other parameters are set up automatically. Click OK to apply the parameters and close the setting window.
How to buy with the “Two MAs + Fractals” strategy
- The market Is in an uptrend, and the EMA (10) is above the SMA (30)
- During a downward correction, the quotes drop to the SMA (30) and form an upward reversal with the formation of a lower fractal
- The trader opens a buy position and sets the Stop Loss just below the local low formed by the correction
- The position is closed when the opposite upper fractal appears on the chart


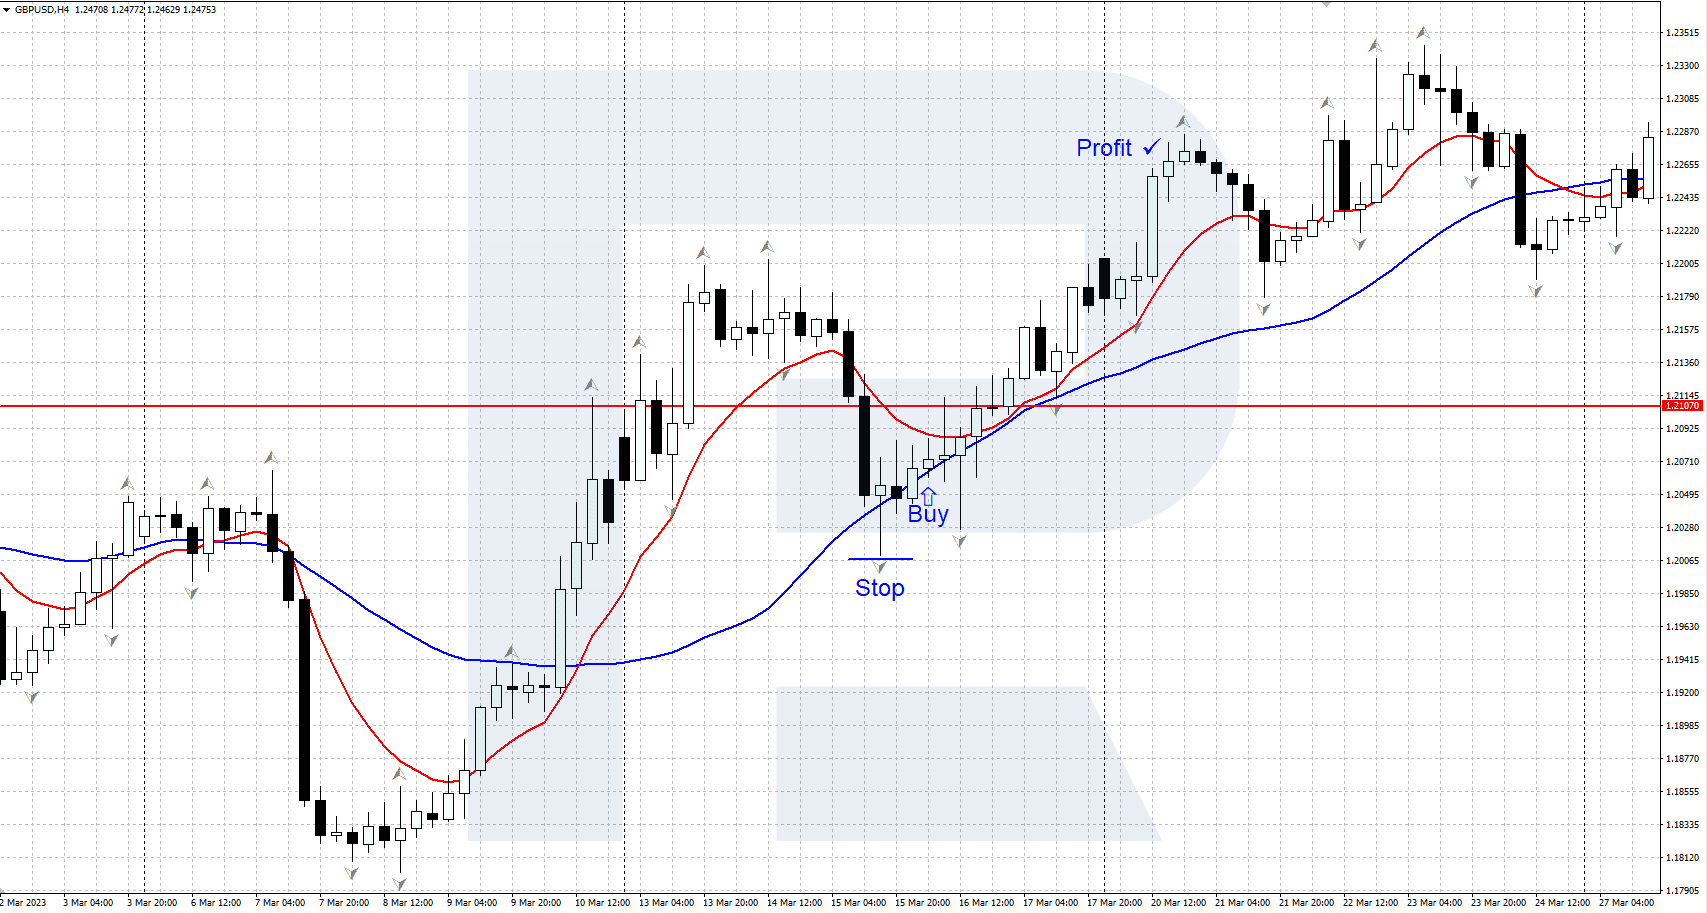
Example of a buy using the “Two MAs + Fractals” strategy
- On 15 March 2023, GBPUSD quotes formed a signal to buy on the H4 chart
- The red EMA (10) was above the blue SMA (30), and the market was in an uptrend
- During the downward correction, the quotes dropped to the SMA (30), forming an upward reversal and a lower fractal
- A buy position was opened at the price of 1.2050, and the SL was set at 1.2005, just below the low of the correction
- The position was closed after the quotes rose and an upper fractal formed, roughly at 1.2250
How to sell with the “Two MAs + Fractals” strategy
- The market is in a downtrend, and the EMA (10) is below the SMA (30)
- During the upward correction, the quotes rise to the SMA (30) and form a downward reversal and an upper fractal
- The trader opens a selling position, setting the Stop Loss just above the local high formed during the correction
- The position is closed when the opposite lower fractal appears on the chart
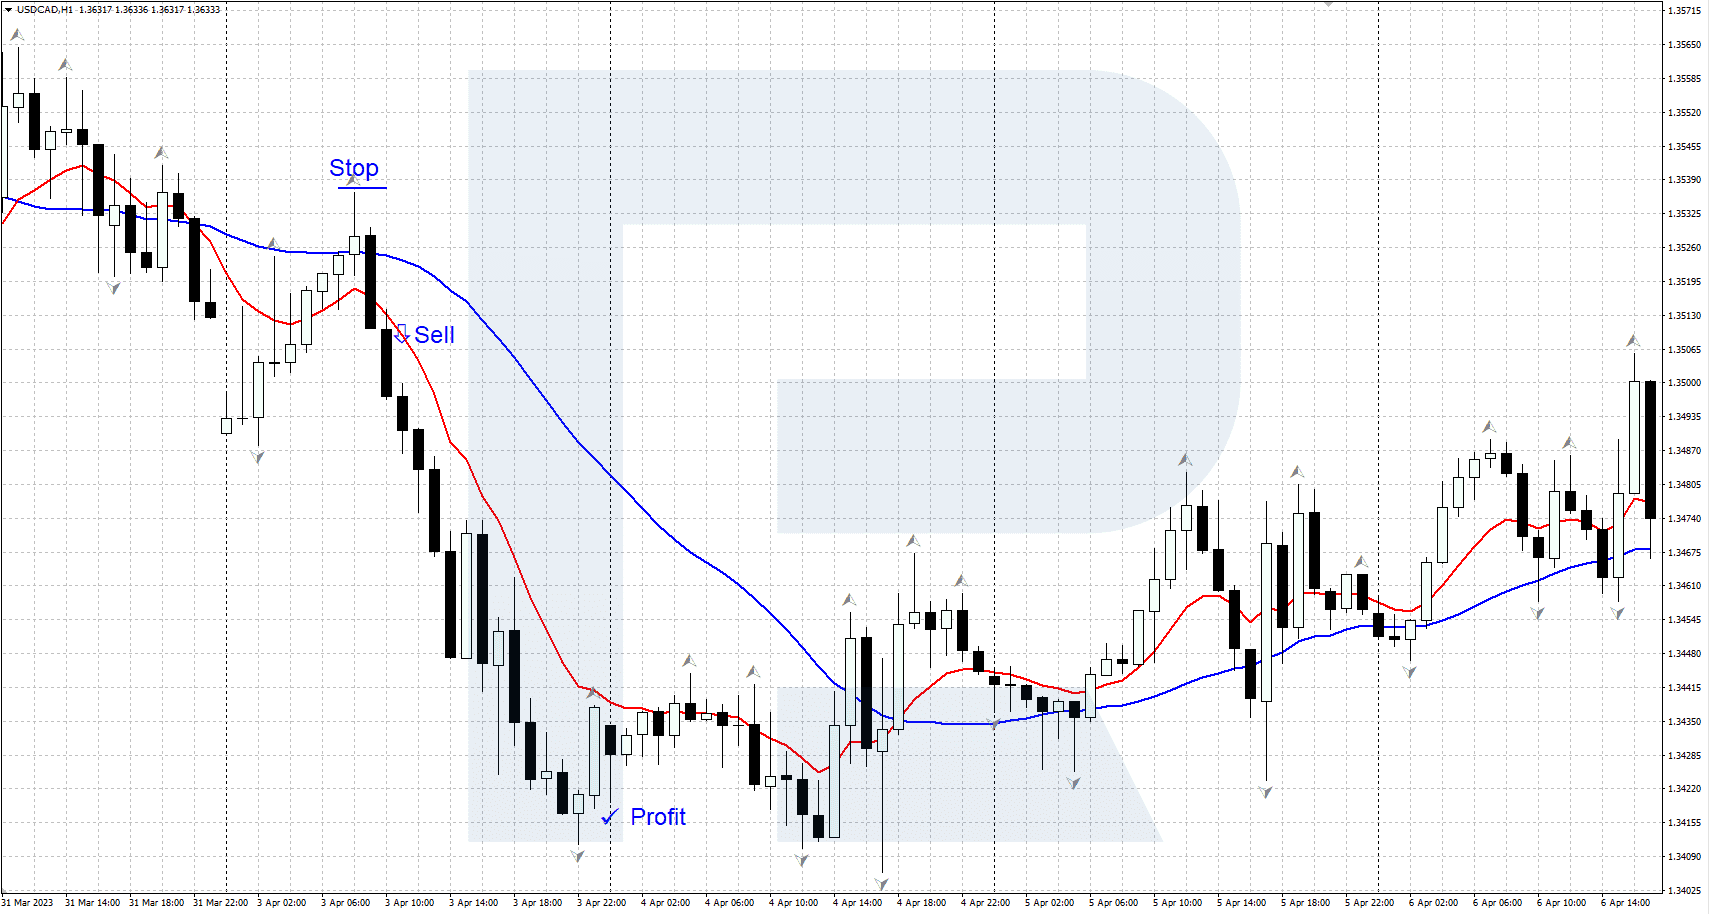
Example of selling by the “Two MAs + Fractals” strategy
- On 3 April 2023, USDCAD quotes formed a signal to buy on the H1 chart
- The red EMA (10) was below the blue SMA (30), and the market was in a downtrend
- During the upward correction, the quotes rose to the SMA (30), forming a downward reversal and an upper fractal
- A sell position was opened at the price of 1.3510, and the SL was set at 1.3540, just above the high of the correction
- The position was closed after the quotes dropped and a lower fractal appeared, roughly at 1.3430
Summary
This strategy is a fairly simple swing trading system based on the signals of the popular Moving Average and Fractals indicators. The system works successfully during a trend on local corrections, but it is better not to use it on a flat market. For added reliability, we recommend using the strategy alongside classic tech analysis tools. Make sure to test the strategy on a demo account before actually using it.