How to Use Gann Fan in Trading?
6 minutes for reading
In this overview, we will discuss the use of one more trading instrument that draws support and resistance lines on the chart and helps forecast probable price surges. It is called the Gann Fan.
What is Gann Fan?
William Delbert Gann is a famous and successful US trader that influenced the development of tech analysis a lot. Trading in exchanges, Gann found out certain patterns and laws in the interrelation of price and time; on their basis, he created an instrument named after him – Gann Fan (or Gann Angles).
Gann Fan consists of several lines going from one point in several directions. The main Gann Angle (45 degrees) is the diagonal of the square in which one side demonstrates price changes while the second one shows time changes. The calculation method of such a square (the search for the equality of price and time) is called “squaring” by the author.
What does Gann Fan show?
Gann's trading method is based on the use of the lines of the Gann Fan for forecasting the behavior of the price. The author stated that it was vital to pay attention to the slope angle of the trend. He thought the angle between the trend an the time axis to a large part reflected market dynamics and properties.
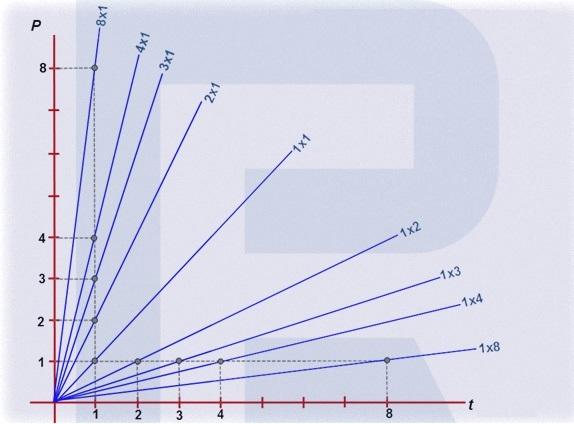
The Gann Fan shows 9 forking lines (looking like a fan) that act as some sort of support/resistance lines. The most important angle is 45 degrees; the main 1:1 line has such a slope. There arr also 4 additional angles above and 4 angles below the 1:1 line, based on different relations of the price and time:
- 8:1 line — 7.5 degrees
- 4:1 line — 15 degrees
- 3:1 line — 18.75 degrees
- 2:1 line — 26.25 degrees
- 1:1 line — 45 degrees
- 1:2 line — 63.75 degrees
- 1:3 line — 71.25 degrees
- 1:4 line — 75 degrees
- 1:8 line — 82.5 degrees.


The Gann Fan indi cator
There is a special instrument that automatically draws the lines of the Gann Fan on the chart. It has the same name. To add it to the chart of your desired instrument in MetaTrader 4 or MetaTrader 5, go to the Main Menu/Insert/Gann/Gann Fan.
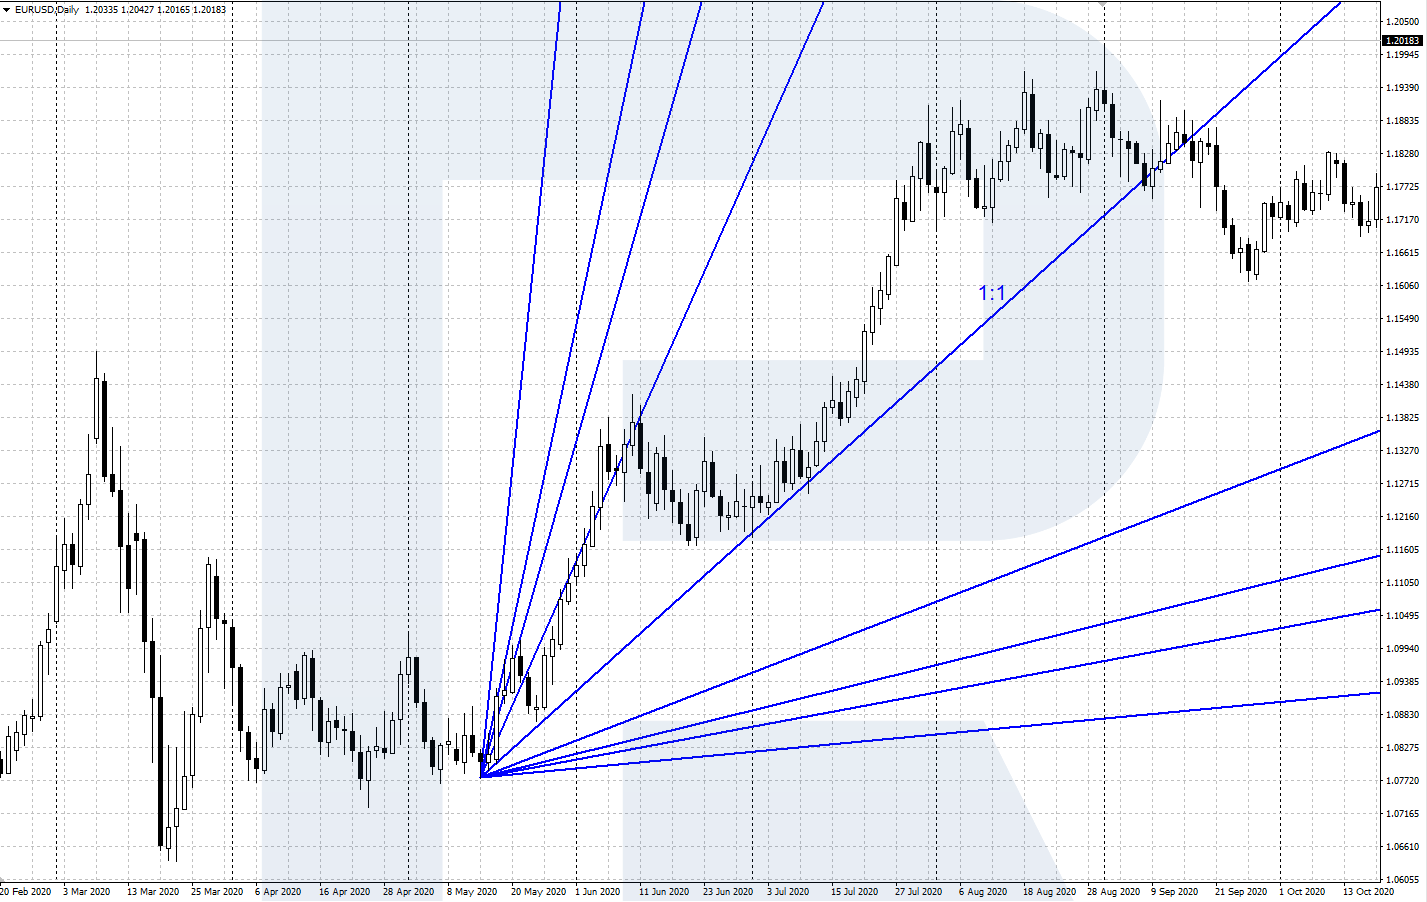
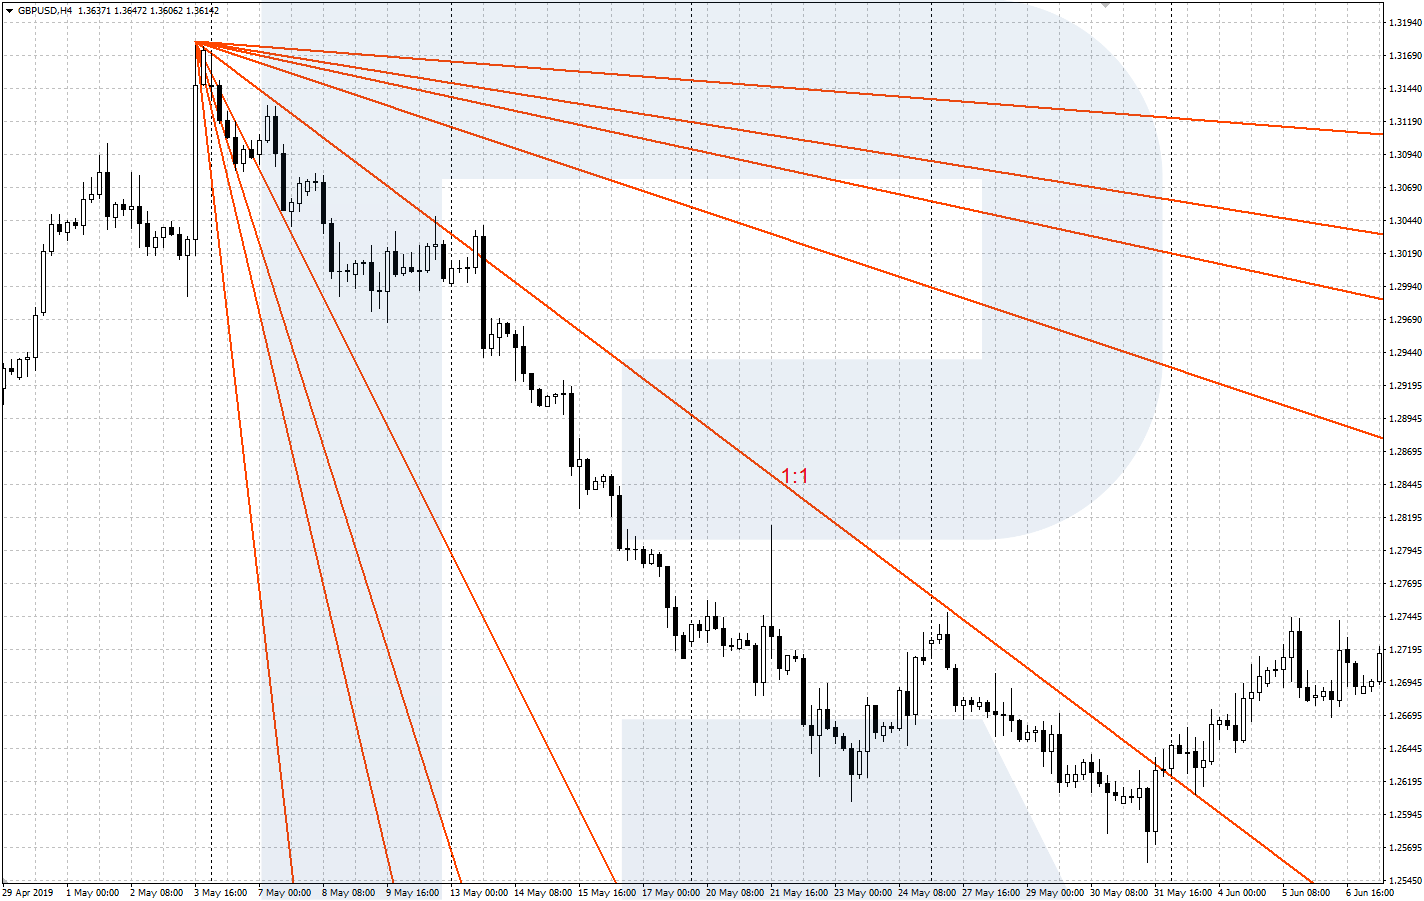
Then locate it on the chart, setting the starting point. For an uptrend, take the local low from where an ascending impulse has started; the indicator lines will head upwards. For a downtrend, take the local high in which the downtrend started; the lines will go downwards.
You can customize the width and color of the lines. By default, 1:1 has a slope of 45 degrees but this is also changeable. To change the angle of the main line, double-click it: the boxes will appear on the line, by moving which you will change the slope and move the whole indicator.
Trading with the Gann Fan
According to Gann's theory, the market has a perfect balance when the price and time are synchronic. The larger part of the theory is based on the idea that the market is bullish when the price chart gets above the main 1:1 line sloping at 45 degrees. And vice versa, when the price chart is below the line, the market becomes bearish.
In essense, the lines of the Gann Fan can be used as supplementary support and resistance lines on the price chart. They are compatible with classic tech analysis lines and levels. Also, the indicator produces independent trading signals. Let us have a look at the most important ones — a bounce off and a breakaway of the main 1:1 line.
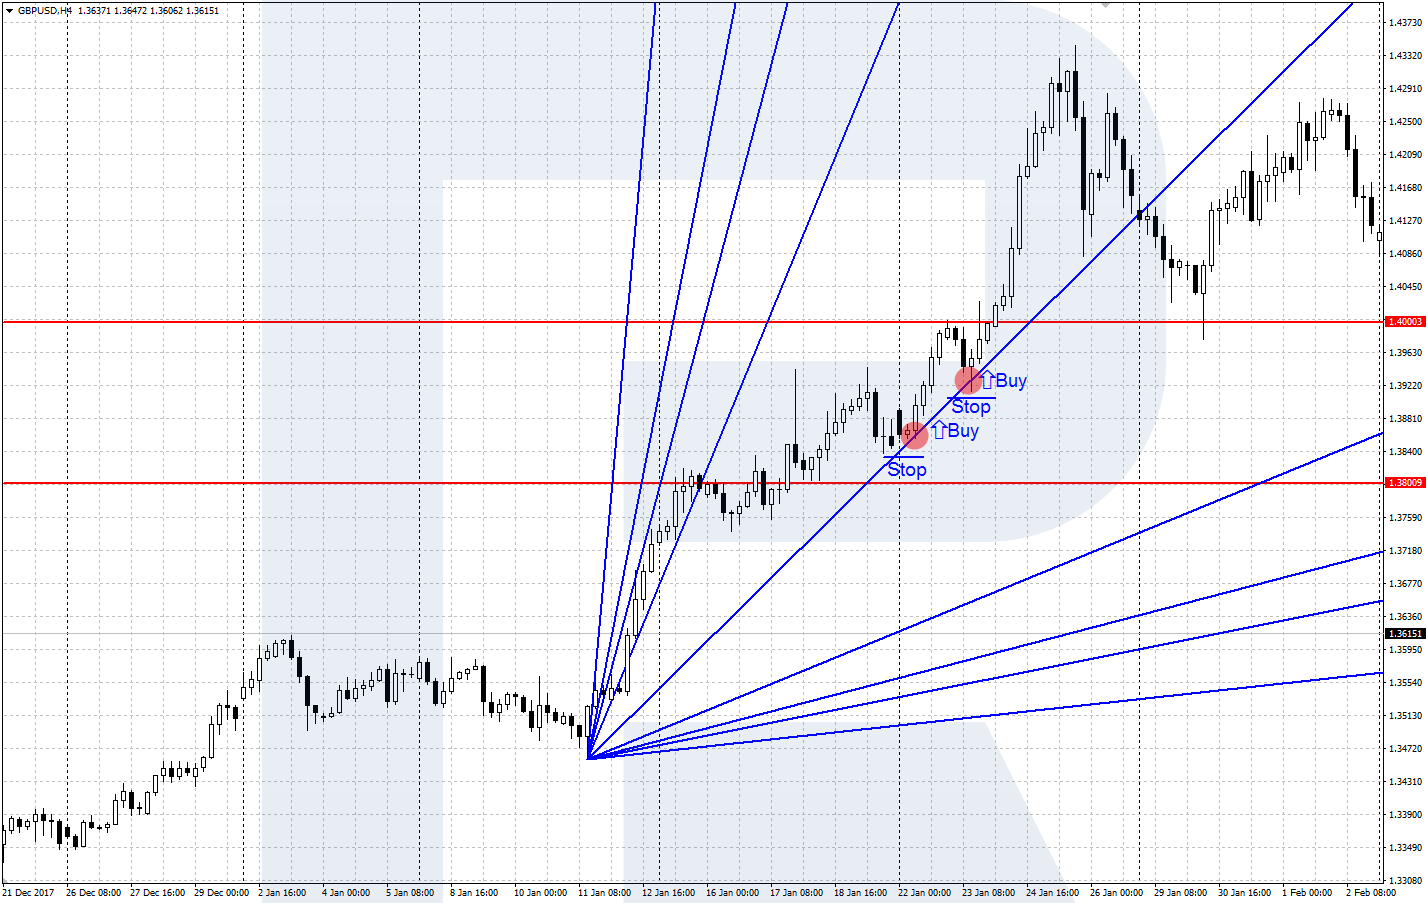
A bounce off line 1:1 of the Gann Fan
If in an uptrend the price falls to 1:1 and forms a local low but then reverses upwards, you can open a buying position. Place your Stop Loss behind the local low and take your Profit when the price reaches 2:1. For a downtrend, the actions are the same but in the opposite direction (and you open a selling position).
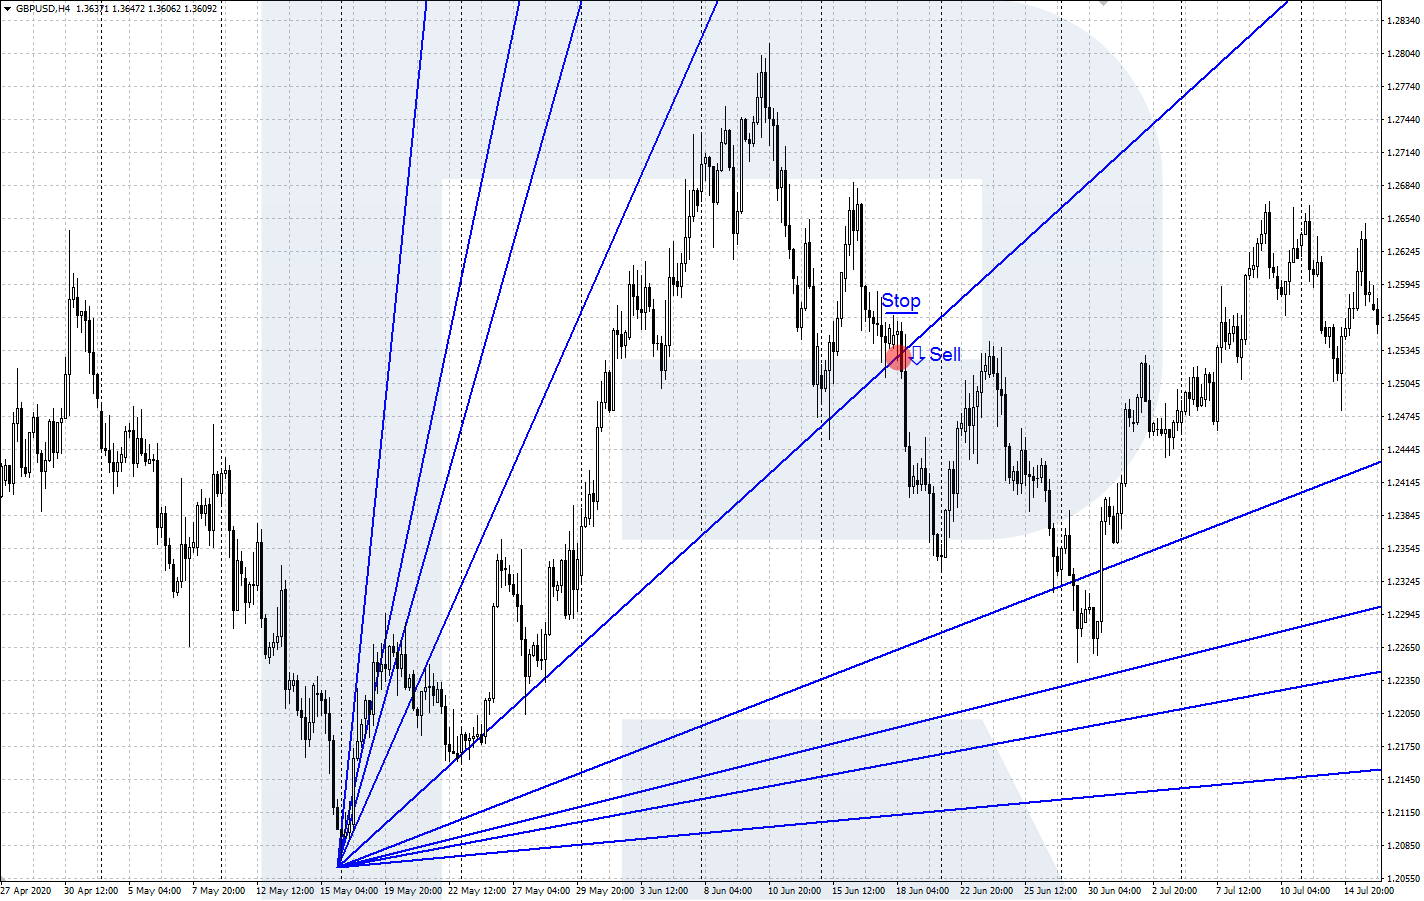
A breakaway of line 1:1 of the Gann Fan
If an uptrend is reversing, and the price closes confidently below 1:1 (breaking it away downwards), wait for it to return to the broken line and open a selling position with an SL behind the local high. Take your Profit when the price reaches 1:2. For a reversal of a downtrend, do the same but in the opposite direction, opening a buying position.
Closing thoughts
The Gann Fan is a curious instrument for tech analysis and price forecasts. It can be used alongside classic tech analysis or on its own. To get the very gist of this trading method, read the book "How to Make Profits in Commodities" by William Gann.


