Quantitative Tightening and How It Influences Markets

5 minutes for reading
This article is devoted to the idea of Quantitative Tightening, its history in short. use, and influence on financial markets.
What is Quantitative Tightening
One of the previous articles described Quantitative Easing (QE): this is an instrument used by Central Banks (CB) in economic crises that includes adding money directly to the economy in order to stimulate it. So the process of taking the excess money out of the economy, opposite to QE, is the definition of Quantitative Tightening (QT).
QT presumes controlling policy of the CB, aimed at taking excess liquidity out of the economy in order to decrease inflation stress. For QT, the CB cuts down on its balance, inflated during QE. It gradually sells assets (treasury bonds and other securities) and puts on halt reinvestments in bonds upon expiry.
What Quantitative Tightening is necessary for
This is quite a new instrument of monetary policy, used mostly by the US Fed. Quantitative Tightening is one of the ways to normalize monetary policy. The task is too cool down the economy a little, slow down inflation, and somewhat decrease the balance of the regulator that during QE took in more than it could hold normally.
By Quantitative Tightening, the Fed tries to fight back excessive inflation when it rises over 2%. As a rule, QT is used alongside the most popular credit and monetary instrument of t Fed – changing the interest rate. Taking liquidity out of the financial system by QT and raising the interest rate are aimed at slowing down inflation that grows too fast.
Investors keep a close eye on the policy of the Fed and become cautious as soon as QT starts. Everybody knows that at some point the regulator will start driving liquidity out of the economy. The length of QT and the speed of cutting down on balance can substantially influence financial markets.
Whether Quantitative Tightening was used earlier
The experience in using Quantitative Tightening by the Fed is limited by the times of the financial crisis in 2008-2009.
After the crisis, the Fed only once cut down on its balance – in October 2017, when the interest rate was at about 1.25%, about two years after the Fed initiated its rate normalization plan. After the first cycle of QT, the US CB carried out five more increases in the interest rate by 25 base points every quarter, and by December 2018 the rate reached 2.5%.
QT was carried out step by step: in Q4 2017, $10 billion of liquidity was taken out monthly, in May 2019 - $50 billion. Then the process slowed down and totally stopped in autumn 2019. The programme was finished preliminary due to worsening of the financial situation.
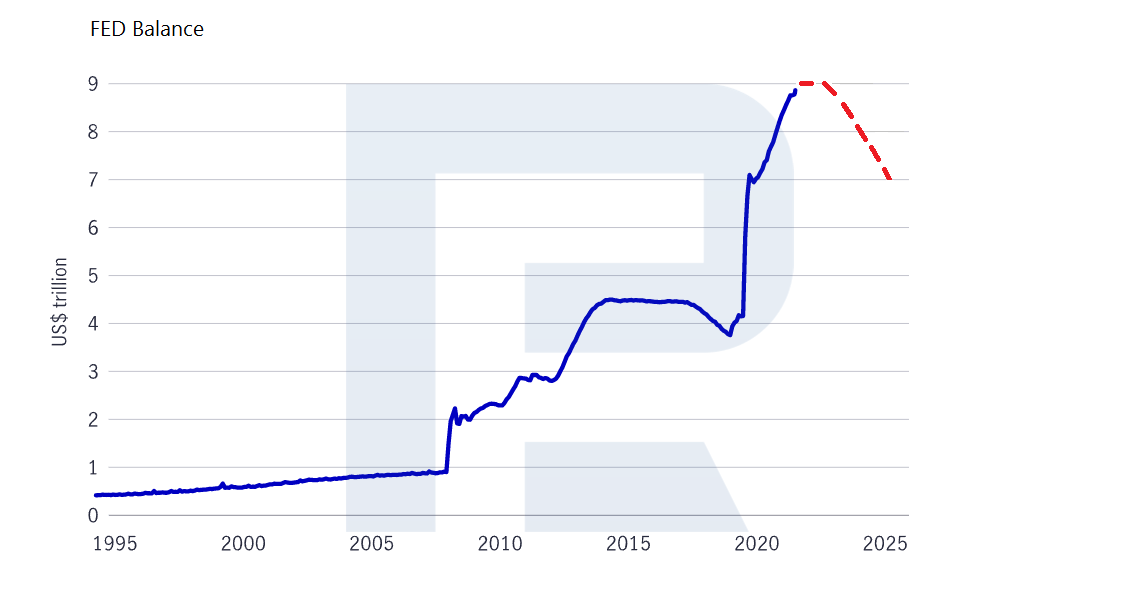
A year later, a new crisis broke out due to the COVID-19 pandemic. The CB had to use QE again to stabilize the economy. As a result, the balance of the regulator was inflated from about $4 trillion to $9 trillion.
In 2021-2022, inflation in the USA has been growing, provoked, among other things, by the preceding QE. To solve the problem, the Fed announced a cycle of increases in the interest rate and new Quantitative Tightening. An increase in the interest rate by 0.25% was announced on the meeting in March, and the start of Quantitative Tightening is scheduled for summer. By Q4 2022, the balance is expected to have dropped by $2 trillion.
How Quantitive Tightening works and influences markets
High tide raises all boats, and this saying perfectly characterises QE. Availability of liquidity provided by QE leads to higher prices.
As for Quantitative Tightening, which resembles low tide, it drives liquidity out of the market. At those times, market prices can correct from inflated speculative levels and become more bound to fundamental values.
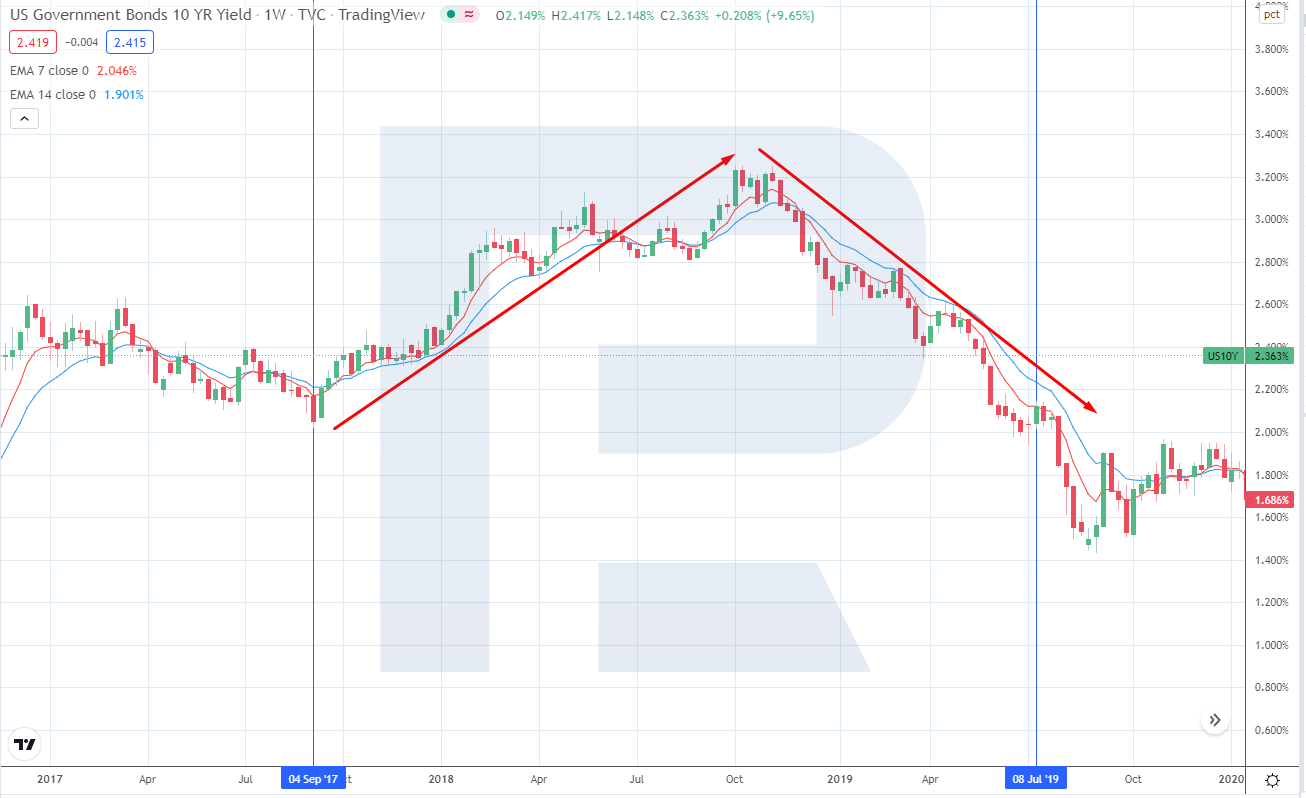
How bonds market reacted to Quantitative Tightening in 2017-2019
From the point of money flows and the demand/supply ratio, Quantitative Tightening policy is a bearish market driver for the bonds market. Thanks to it, the price of bonds can fall and the profitability can grow. In 2017, the profitability of 10-year treasury bonds grew from 2% to 3.2%, and in 2019 – it dropped to 2% again.
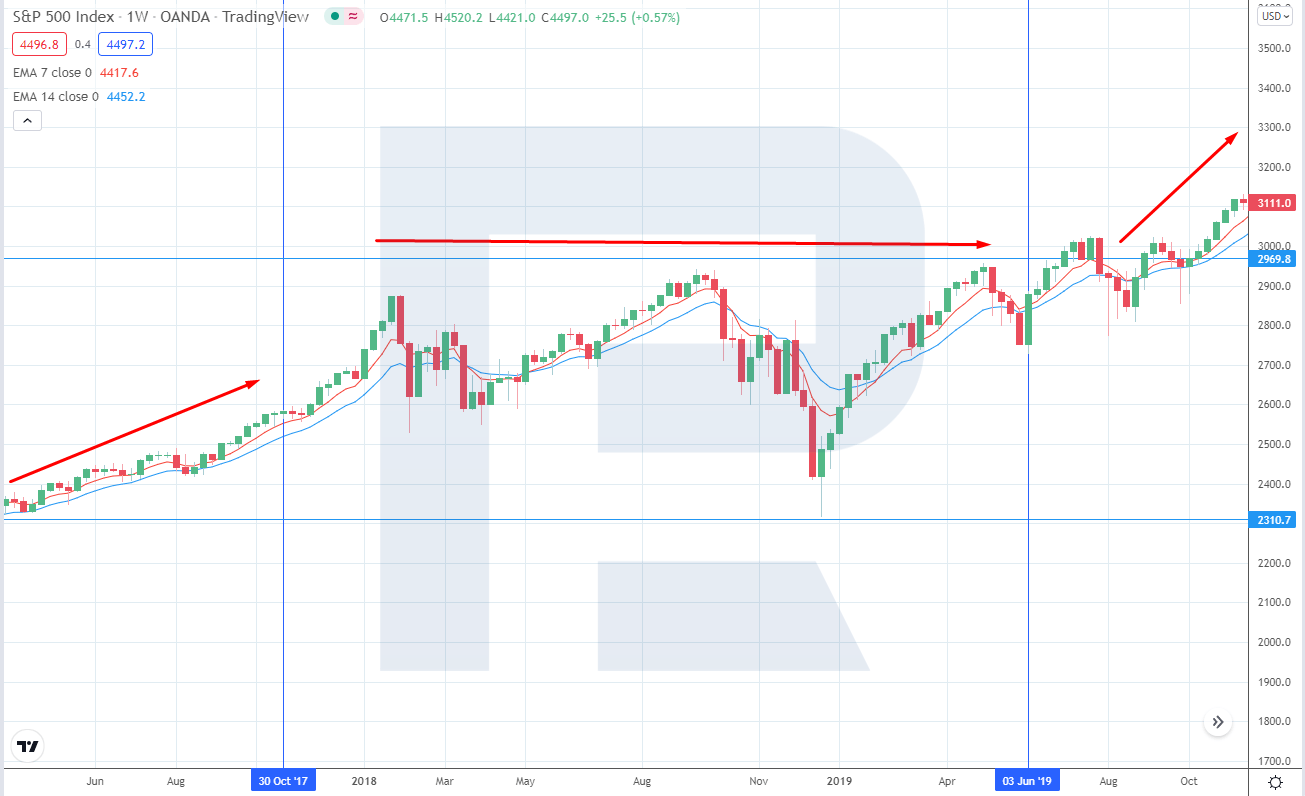
How stock market reacted to Quantitative Tightening in 2017-2019
Quantitative Tightening is a measure of toughening credit and monetary policy, so it holds back active stock price grows. Over the times in question, stock price dynamics was clearly unstable: it featured corrections and quite a broad range. There was no serious decline, yet the S&P 500 managed to continue stable growth after QT was wound up.
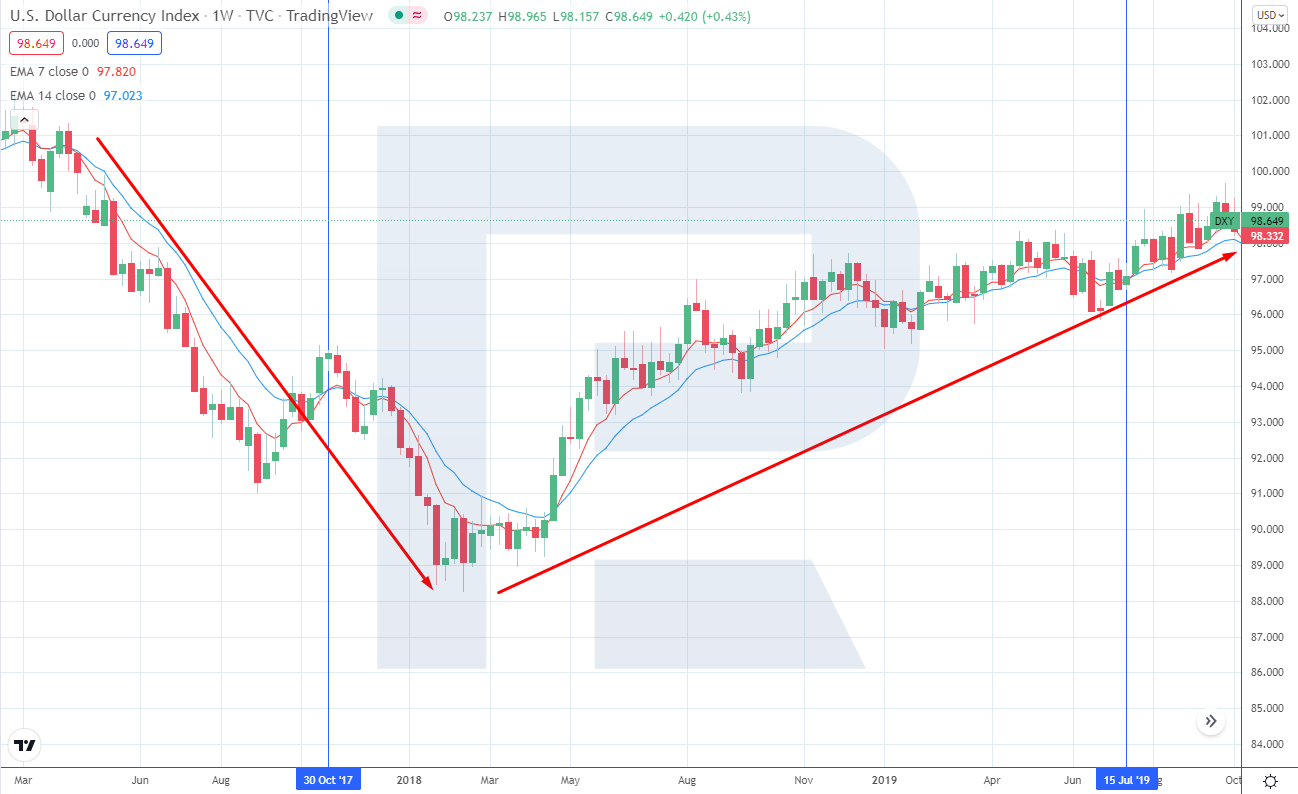
How Forex reacted to Quantitative Tightening in 2017-2019
The beginning of Quantitative Tightening was a bullish factor for the USD. The increase in interest rates normally supports the US dollar. In 2017, the downtrend in the USD index reversed and an uptrend began.
Bottom line
Quantitative Tightening is not a standard instrument of CBs monetary policy that helps drive excessive liquidity out of the economy in order to fight back inflation. Quantitative Tightening programme can lead to a correction and a lengthy range in the stock market, growth of bonds profitability, and securing of the national currency.


